Homepage
Welcome to the A/B Street website. Here you will find information about the project, an overview of the software products it has enabled, a user guide, technical details aimed at developers, and lots more.
Like any open source project, A/B Street has evolved and will continue to evolve, and that applies to the documentation. Any contributions to the website, the source code of which can be found at github.com/a-b-street/docs are very welcome. In fact, contributing to the project's documentation can be one of the easiest ways of supporting the project.
Software
Our main software is A/B Street, but along the way, we've split out a few related side projects. A/B Street has a huge scope, so over time, we'd like to carve out more smaller pieces from it.
The main projects:
- A/B Street for running a traffic simulation, editing roads and intersections, and measuring the impact of your changes. It has game-like elements, but leans more on the side of being a real prototyping tool.
- Ungap the Map for exploring current gaps in a city's bicycle network and proposing new bike lanes.
- 15-minute neighborhood explorer for seeing where people live in relation to commercial and public amenities.
- 15-minute Santa, a light-hearted arcade game to demonstrate the concept of a 15-minute neighborhood.
- Low-traffic neighborhood for understanding how modal filters can discourage vehicle traffic from cutting through residential areas.
Some dedicated tools for the OpenStreetMap community:
- OpenStreetMap viewer for auditing lane tagging
- Parking mapper for editing street parking data
Some pieces of the code-base are eventually destined to be stand-alone and useful for other projects:
- widgetry Rust UI library for native/web
- a common library for transforming OpenStreetMap key/values to a clear schema of lanes
And some planned projects:
- a low traffic neighborhood planner
- something focused on public transit
A/B Street
Overview
A/B Street is a traffic simulation game exploring how small changes to roads affect cyclists, transit users, pedestrians, and drivers. In other words, you can transform that street parking into a bus lane or fix that pesky left turn at a traffic signal, measure the effects, then propose actually making the change.
A/B Street uses game-like elements to gradually introduce all of the features of the simulation, with a tutorial and a few challenge modes. But just becaused it's called a "game" doesn't mean it's not trying to model the real world as accurately as possible from open data. (Keep in mind it's impossible to simulate all complexity in the real world of people moving around a city. Every traffic model makes lots of assumptions and trade-offs, including A/B Street.)
Explore
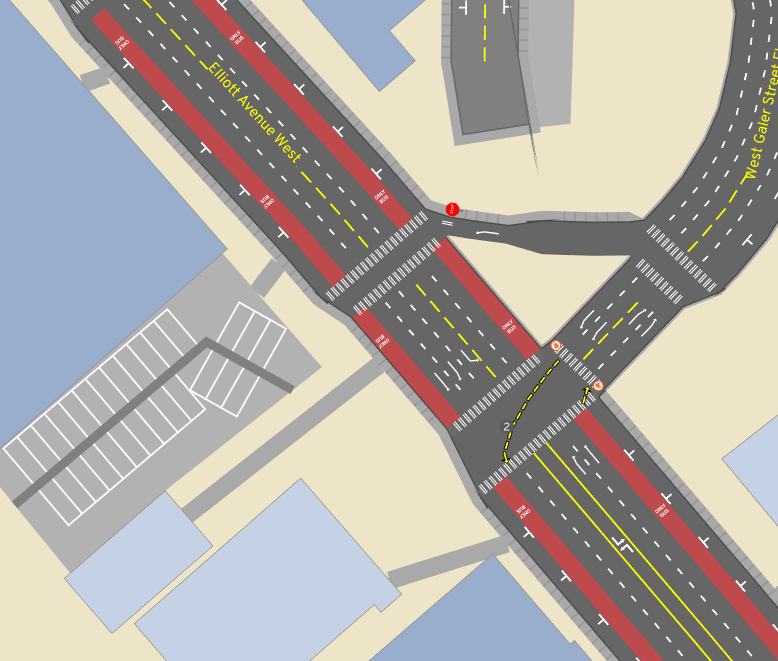
A/B Street gives you a 2D representation of roads, with as much detail about bus/bike/turn/parking lanes, transit stops, traffic signals, and parking lots as possible, all from OpenStreetMap.
Depending on elevation data availability, some areas let you visualize steep streets -- because your bike network should be planned accordingly.
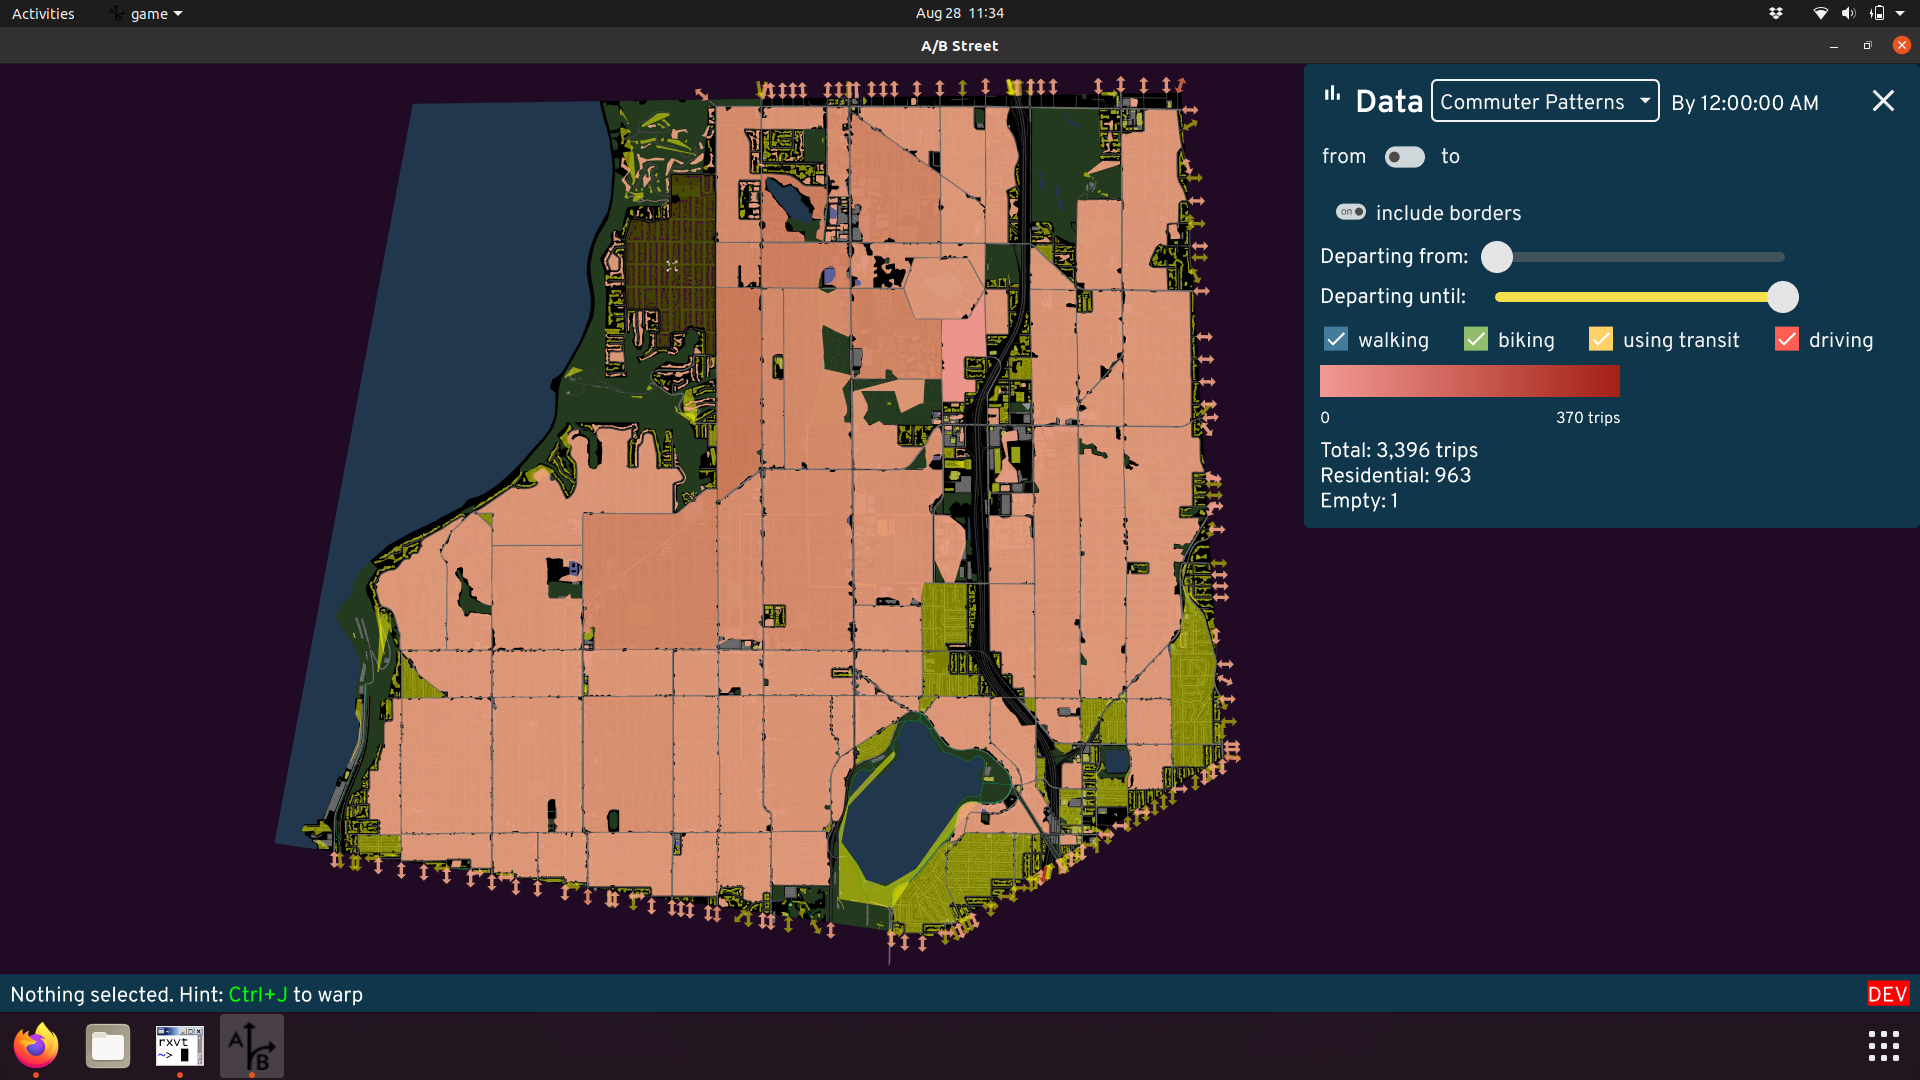
Using external travel demand models, you can explore patterns of where people live, work, and shop.
Simulate
Using some external data about what trips people take on a typical day, you can simulate drivers, bicyclists, and pedestrians moving around. (Public transit and scooter/bikeshare micromobility planned.)
You can follow individual people and watch them wrestle with problems, or get a bird's-eye view of how everything is moving.
Every driving trip begins and ends with parking, which might be easy in suburban areas, but hard in cities.
Some details:
- People will take the best route available, not accounting for current congestion. Drivers prefer the fastest route (shorter distances, higher speed limits). Pedestrians and cyclists also factor in elevation changes.
- Vehicles instantly accelerate and stop. This is a useful simplification to speed up the simulation, but of course, you shouldn't use A/B Street to simulate jam waves on freeways.
- Vehicles stay in the same lane once they pick it, and sometimes they choose their lane really poorly. We're working on improving this.
- We don't simulate accidents -- but we do measure "risk exposure" where a collision may be likely.
Edit
A/B Street lets you change how road space is divided up. You can create regular vehicle lanes, bus-only lanes, bike lanes, street parking, and new sidewalks. You can either transform existing lanes, or slightly widen/shrink the road. You can reverse the direction of lanes, or close them down to simulate construction.
You can also change speed limits and restrict access to an area. Only trips that start or end in a private area can use the roads within, modelling gated communities. Or you can allow through-traffic for people walking and biking, to create low-traffic neighborhoods.
You can also change how traffic signals work. You can modify the timing if you notice left turns need more time, or set up actuated timing, so that the green light lasts longer when many vehicles are waiting. You can also change which movements are allowed each stage, so you could try out a dedicated left turn stage or a pedestrian all-walk/scramble cycle.
Measure
A/B Street lets you tell data-driven stories about both infrastructure and people.
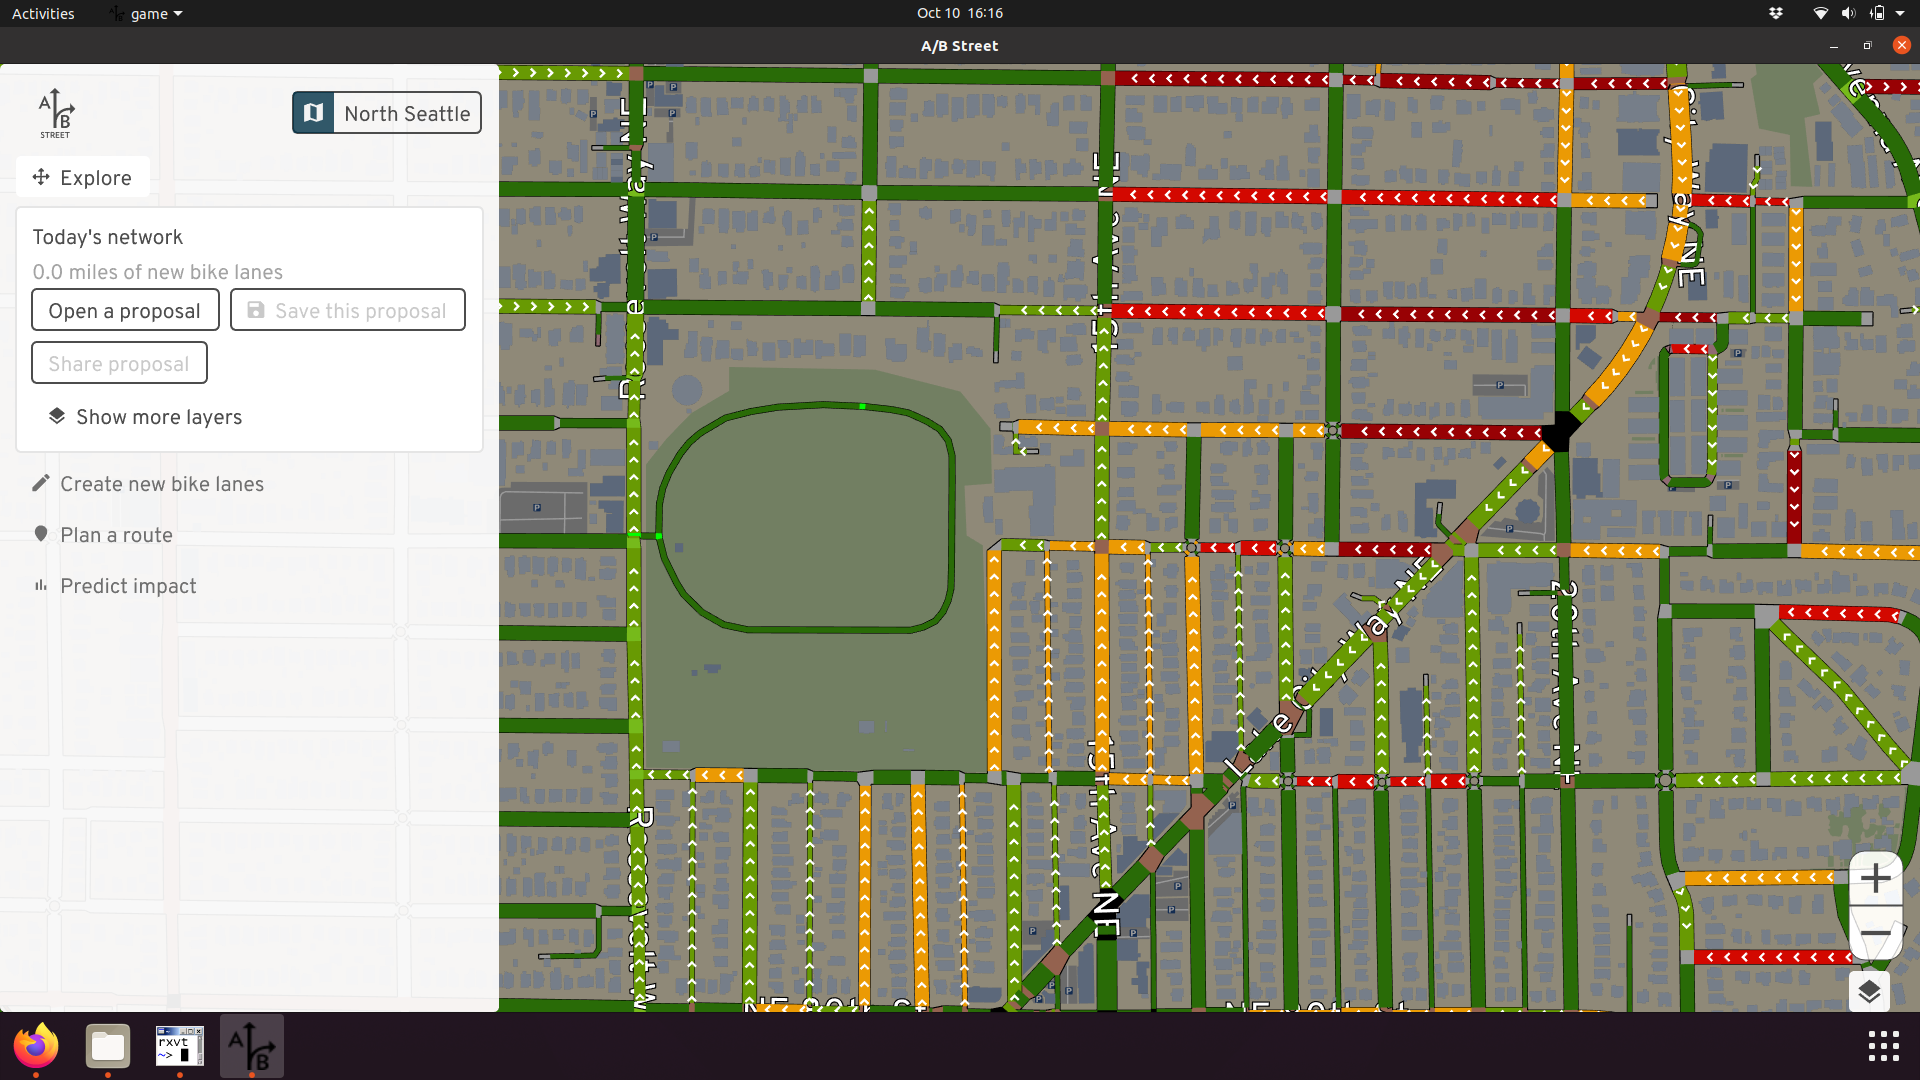
Ungap the Map: envisioning better bike networks
Ever want to visualize how your city would look if streets were designed to safely/comfortably make most trips by bike? This tool lets you quickly sketch out your own vision to fill in missing gaps in the network, see how the changes would impact your commute, and share the results with others.
- Web version
- To work for larger areas (like all of Seattle), it's highly recommend to
install the latest release
for Windows, Mac, or Linux. After unzipping, run
ungap_the_map.shorungap_the_map.bat. - See an example vision for Seattle
- 15-minute video overview
- This page: bike.abstreet.org
Credits
This project was inspired by conversations with members of Seattle Neighborhood Greenways, who had feedback about the main A/B Street traffic simulation being too open-ended. This was developed during August-October 2021 for the Taiwan presidential hackathon. This tool is part of A/B Street, which has had many contributors, but specifically for this tool:
- Dustin Carlino: primary creator
- Michael Kirk: usability feedback and fixes, ideas for what the tool should do, implemented road labels and large parts of the lane editor
- Mara Cruz: part-time UX help, connections to NYC's advocacy group
- Robin Lovelace: domain knowledge about mode shift
- Yuwen Li: A/B Street's main UX designer. Not directly involved in this tool, but the design is largely adapted from her prior work
- the Aurora Reimagined Coalition for letting us bring a prototype to a design workshop event
- contributors from the National Day of Civic Hacking
- Eldan Goldenberg: prior work on elevation data
- the OpenStreetMap community
- Angelina and Amanda, DemocracyLab volunteers, for participating in usability studies
- the organizers of the Taiwan hackathon for providing motivation and direction for the project
User guide
You can use the different parts of this tool in any order you like, but the recommended flow is:
- Start by exploring the existing bike network in your city. Try zooming in to see detail about how street space is currently used!
- Go plan a trip to see what trade-offs between safety and speed you might experience biking today. You can save these trips to later evaluate your proposal.
- Create new bike lanes where you think they should exist!
- Check your trips again, to see if the most direct route is now safer.
- Use the "predict impact" mode to estimate how many other people might make use of your changes.
- Upload your proposal, then share on social media or start a conversation with your local city government or advocacy groups!
General tips
This software can run in your web browser without any installation. If the loading times are slow, install and run for a much faster experience, especially for larger areas. There's no support for mobile devices yet.
You can move around the map just like most digital maps. Click and drag to pan around. To zoom in, just scroll with your mouse or touchpad, double click, or use the buttons in the corner. This map shows much more detail when you zoom in -- give it a try!
The map works anywhere in the world. You can use the button at the top to change regions. Many cities have already been set up. If you're using the downloaded version, you can also import another region yourself. (Sorry, no web support for that yet.) If you want any help importing your region, file an issue or contact dabreegster@gmail.com.
Exploring the map
Types of bike infrastructure
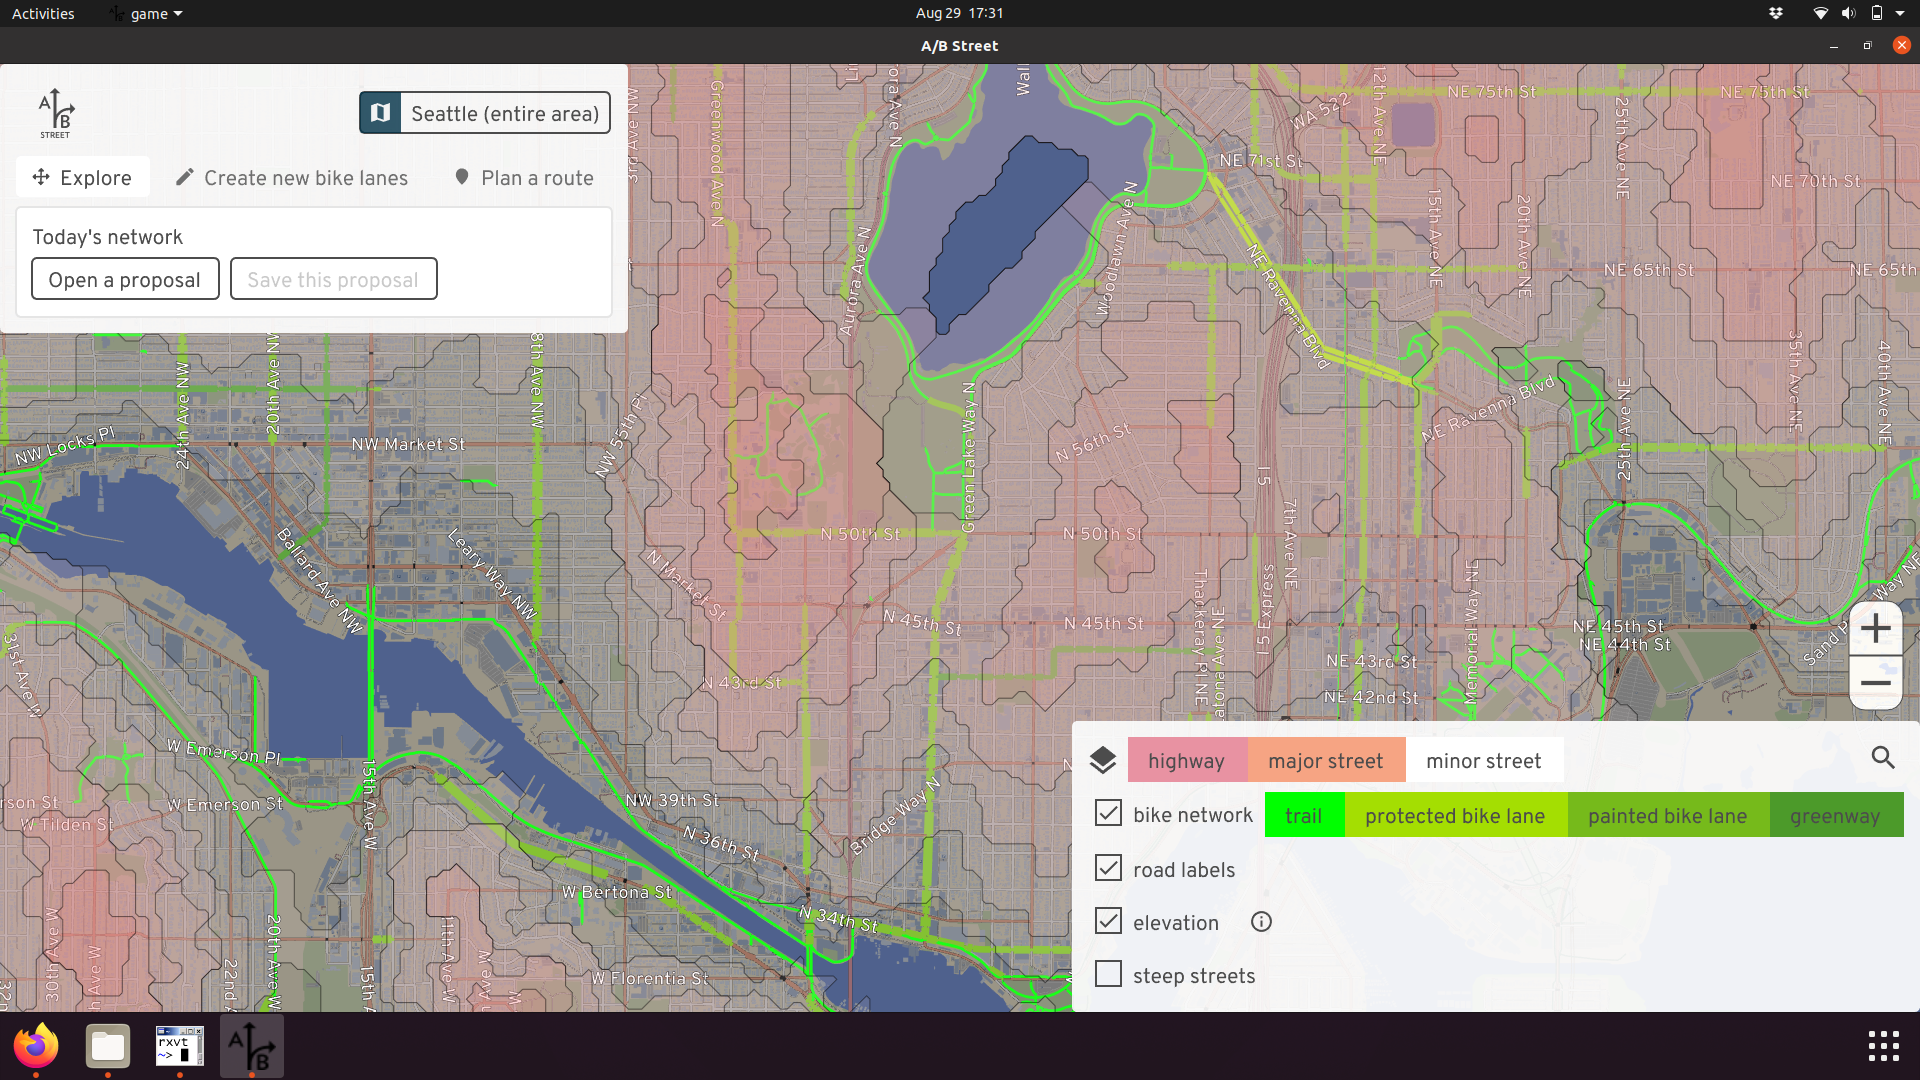
If you open the layers in the corner, you'll see that bike infrastructure is divided into 4 categories. Dedicated trails are usually the most segregated from motor vehicles, and are often shared with people walking. In most cities, most bike facilities are directly on the street, alongside traffic. Protected bike lanes have some kind of buffer protecting cyclists from other vehicles -- sometimes concrete barriers, but often just about a foot of paint and some flexible bollards. Painted lanes have no protection from traffic; cyclists just have to trust vehicles not to cross a thin line of paint. Often painted lanes are located very close to street parking, forcing cyclists to ride in the "door zone," where somebody in a parked car might suddenly open their door and block the lane.
Greenways are streets where vehicles and cyclists share the same space. The city has designated these as low traffic, and there might be small traffic calming measures to discourage high-speed traffic -- like speed bumps, slaloms, curb bulbs, small traffic circles, and signage. These routes have different names across the world -- Stay Healthy Streets, neighborhood greenways, low-traffic neighborhoods, slow streets, etc. In a place like Seattle, these streets are very narrow because of cars parking on both sides, so when a cyclist and an oncoming vehicle need to pass each other, both have to slow down. In the author's opinion, it doesn't feel like the cyclist really has any sort of priority here.
Finally, some cities use "sharrows," or painted markings, on general-purpose lanes to indicate to drivers that they're supposed to share the road. These aren't reflected in the map at all, because they're not real infrastructure. Studies have shown they can actually make things worse.
Understanding elevation layers
Many places are flat or have widespread adoption of e-bikes. But in cities like Seattle and San Francisco, the city is arranged on steep hills, which can deter people from cycling for commuting. If you open the layers panel, you have two ways to understand how the topography affects biking.
The elevation layer draws a contour map, drawing higher elevation in red. You can quickly get a sense of how the city is arranged, and discover unexpected flat "shortcuts" when the streets aren't aligned to the hills!
You can also check the incline on individual street segments. The arrows point uphill.
Note the elevation data is high-quality for Seattle, but has issues in the rest of the world. And the estimated incline on bridges is usually wrong!
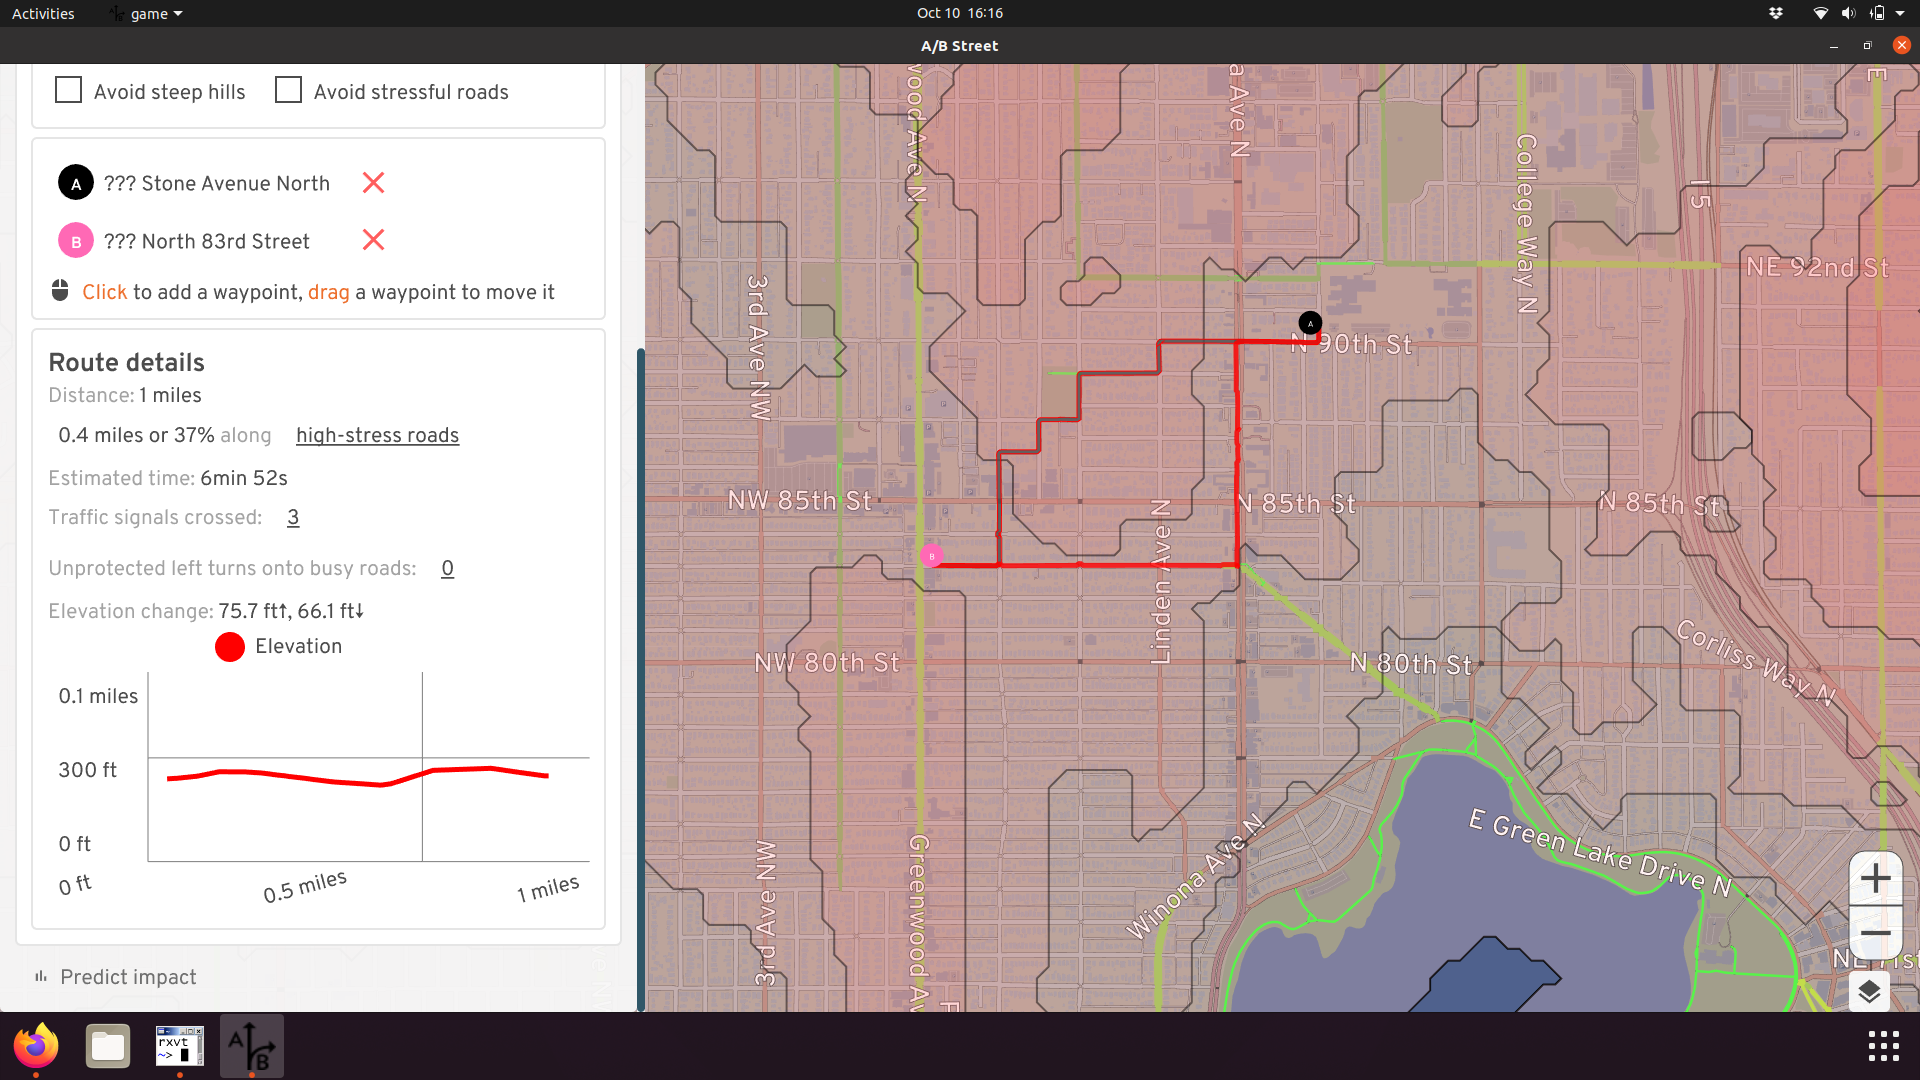
Planning a trip
Use this mode to plan a cycling trip. Just click the map to add waypoints, or drag the waypoints to adjust.
Saving trips
You can name each trip, then save it. This is useful to define "test cases" for evaluating how well the bike network serves the trip. The sample trips could be based on your own commute, or trips you know are common -- like from a university to the popular night-life district.
Preferences
When you plan a bike route, you usually have to make a trade-off between time, hilliness, and stress. The fastest, most direct route often forces you to ride alongside high-speed traffic. Often the safer route will avoid major roads and take longer, and maybe also force you to climb steeper hills.
By default, the most direct route is shown. You can change your preferences with the checkboxes. Alternative routes are also shown, and if you hover over one, you can compare to the direct route.
Details
Besides showing you the distance and estimated time of a route, the tool also tells you how comfortable the trip might be. You can see which segments of the route travel on high-stress roads, which are defined as major roads without any dedicated bike lanes. You can also explore the elevation profile of your route, see the number of traffic signals you'll encounter, and check any potentially difficult turns.
Creating new bike lanes
Once you know where you'd like to add new bike infrastructure, use this tool to quickly sketch it up. Click the start and end of the path you want to modify, then you can adjust by dragging intermediate points.
You can choose what type of bike lanes you want to add. Just painting lanes takes the least amount of space, but adding some kind of barrier makes them much safer. The software makes best guesses at the existing width of the road, and adding bike lanes should never physically increase that width, but there may be errors. Generally the tool will try to replace street parking first, then sacrifice a driving lane if there are multiple. If there's no room (according to the imperfect data) to add lanes, the tool won't make any changes. You can always use explore mode to edit the road individually to fix up any problems.
Also note some roads fork off into separate pieces when there's some kind of physical median. When you select a route to modify, this only traces one direction. You might need to repeat for the other side.
Proposals
Once you make changes to the map, you can save and load them. Maybe you have a few different alternatives you'd like to try, or you'd like to compare your ideas when your city's official plans.
You can also upload your proposal and share the URL with others. Note that proposals are uploaded anonymously, and when you make any changes, you have to upload again and share a new URL.
Editing roads in detail
If you zoom into an individual road, you can click on it to edit. With this mode, you can customize the width of each lane and other details. If you're focused only on a small area, this might be useful. But if you're interested in quickly sketching over a large area, use the "create new bike lanes" mode.

Predict impact
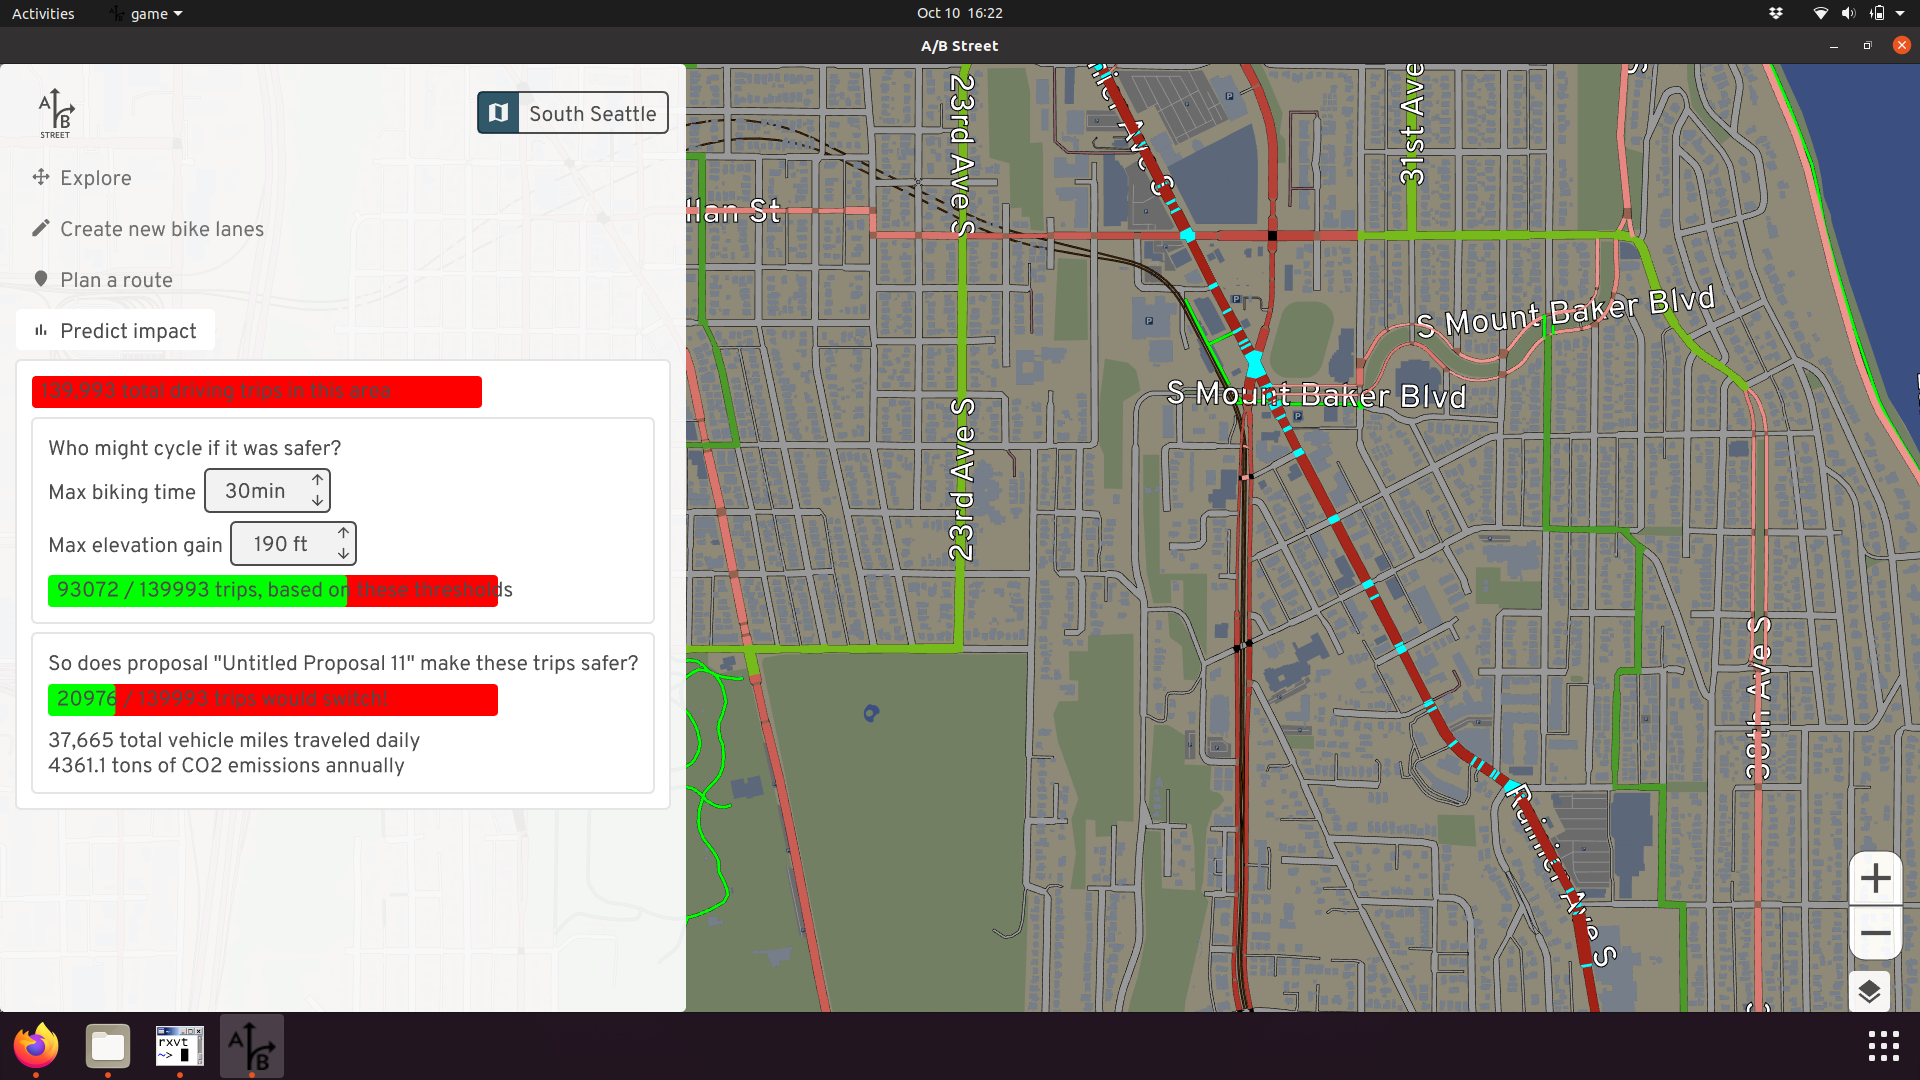
Evaluating your proposed network against a few sample trips is useful, but from a planner's perspective, you want to predict how many people will make use of the new infrastructure. This tool analyzes all short driving trips in the area, then calculates which of them might decide to switch to cycling. This feature only works in Seattle or the UK, where we have a travel demand model describing the population's existing commuter patterns.
There are many assumptions going into this calculation. You can adjust many of these parameters yourself. The first bar shows all of the driving trips in the area. First you have to decide which of them would even consider switching. Based on existing research, the two main factors are the time the biking trip would take instead, and the amount of hills encountered. People with a quick, comfortable drive today are unlikely to bike for a long time up steep hills.
The middle bar changes to show you how many of the trips would consider switching, based on these settings. Now the question becomes, if these trips wouldn't be so inconvenient for people to bike, what's stopping them today? Of course there are many factors, but the one this software focuses on is safety -- the direct cycling route encounters too many high-stress roads without any bike lanes. The red heatmap shows you these problems, ranking which roads are the most important to fix, based on the number of trips that're prevented from switching.
In response to your proposed network, the final bar guesses how many trips would switch to biking if your changes were built. Then, to quantify the environmental impact, the miles spent driving currently are added up, repeated every weekday for a year, and converted to CO2 emissions. If your proposal comes to life, this is what might be saved.
Project motivation
This document will argue why this bike network software can help achieve the UN's Sustainable Development Goal 11 of improving cities.
The theory of change summary:
- Problem: Car dependency harms the environment. Biking is one low-cost alternative. Cities need to build infrastructure to make it safe. Poor communication between stakeholders slows down these changes.
- Activities: This new "Ungap the Map" software will help stakeholders communicate more effectively.
- Outputs: Better plans for bike networks and increased civic engagement.
- Outcomes: Bike networks get built more quickly.
- Impacts: More people decide to bike, decreasing the environment impact of transportation.
Driving is a problem
According to the EPA, 29% of greenhouse gases in the USA come from transportation in 2019. Driving causes many other externalities -- noise pollution, an incredible amount of space is used for parking, collisions kill many people, and incentivizing driving reinforces suburban sprawl and unsustainable land use patterns. Even though less people drove in 2020, more people died from car collisions. Similar statistics can be found across most of the world. Many people have made strong arguments that cities need to drastically reduce the use of personal motor vehicles for trips.
A popular deflection currently is that fossil-fuel based cars are the problem, and that electric vehicles will solve these problems. While they certainly help with engine emissions, they still pollute due to tires and do nothing to help with the space consumption or safety problem. And migrating the majority of gas cars to electric would be incredibly expensive!
Another false promise is autonomous vehicles. The technology is seemingly always a few years away from wide rollout. Even once it's ready, there's a very real risk that it'll just exasperate problems with suburban sprawl even more, by letting people tolerate longer hands-off commutes. As Tom MacWright has explained, beware the ethical car.
The alternatives to driving
Major European and Asian cities have effective mass public transit, and some -- the Netherlands being the most famous example -- have a high percentage of trips done via bicycle. The world isn't missing some new technology like autonomous cars; car-centric places can just look at these existing places for inspiration on how to design sustainable transportation systems.
Transitioning away from cars is a very complicated problem, and the solution probably involves land use changes (allowing mixed commercial/residential use to create 15-minute neighborhoods, and changing zoning laws to allow mid-rise residential buildings where only single-family homes exist today), investing in public transit (both local buses and regional high-speed rail), designing proper spaces for walking and biking, and encouraging remote working and staggered commute times. It's also important to discourage automobile use as these alternatives become available, by ending gas subsidies, implementing congestion charges around city centers, removing parking minimum requirements, and so on.
Many of these changes are expensive or very complicated and slow to implement.
The case for biking
This project focuses on a small piece of the solution: biking. Both cost and benefit motivate this. Amazingly, 60% of trips in the US are under 5 miles -- a range easily covered by a bike or an e-bike. This report estimates that urban transport emissions could be reduced by 7% if a modest 16% of trips were shifted from driving to biking. Biking also gets people doing moderate exercise, and it's even a low-impact activity for people with knee injuries! The barrier of entry and cost is much lower than driving, making it a more widely accessible option.
One of the main barriers stopping people from switching to biking is safety. Most streets are designed for moving vehicles quickly and can be incredibly unsafe for cycling. Luckily, the cost of reallocating the space on these streets to separate cyclists from motor vehicle traffic is low, compared to building new light rail lines or improving bus route frequency. In the extreme case, making a road more comfortable to bike on can be done with very little money or time, via techniques of tactical urbanism. Some advocacy groups or cities will set up a temporary demonstration of a changed street by simply using signs and movable barriers for a few days, and in other cases, these street improvements are even installed in the dead of night by citizen activists.
Rising momentum
Right now, cities across the world are actively finding ways to reduce car dependency. This is a ripe time to accelerate this culture shift. Some examples:
- Paris has installed a huge number of new bike lanes, and seen usage skyrocket
- In the middle of the sprawling Phoenix metro area, the new Culdesac project is building the US's first car-free neighborhood
- Many US cities are attempting Vision Zero plans to reduce the number of traffic fatalities
- Birmingham is piloting a low-traffic neighborhood
- Advocates are pushing for a massive car-free zone in Berlin
- Many US cities transformed streets into outdoor dining spaces during COVID. This kind of change would never have happened politically a few years ago!
- Some US cities are considering removing highways that tear through the city center and have been historically used for redlining
In short, the public imagination is picking up on these ideas. But this needs to happen as fast as possible to transform cities into more sustainable places and mitigate climate disasters.
Barriers to change
So why isn't every city following Paris and building out a low-cost bike network to encourage people to stop driving? The issue is often quite political -- if city leaders build without the support of their constituents, they won't be re-elected. The public very much are stakeholders. There's often quite fierce opposition to building new bike lanes. Sometimes the arguments are based on specifics -- some parking will be lost, and despite studies showing otherwise, nearby businesses fear losing customers. (But these arguments rarely quantify how much parking is available nearby -- largely because this data doesn't generally exist without an on-the-ground survey.) Others make a very short-term argument that vehicle traffic will be delayed by the reduction in lanes, and this will actually increase pollution in the area. In other words, the concerns raised are by individuals who don't buy into the idea of "mode shift" at all -- that the purpose of the new cycling infrastructure is to make driving a bit less enticing and encourage people to move more sustainably. Some people quite understandably feel "left out" by these transformations -- they've lived in the city for a long time, moved around it in a certain way, and they feel threatened by the changes. Making it safer to bike is inextricably tied up in this concern about gentrification -- driving out long-time residents for younger, often wealthier people who are seen as the target audience of the changes.
This is a really unfortunate miscommunication. Proper cycling infrastructure and land use patterns make it very comfortable for all ages, abilities, and demographics to thrive in a city. If cycling is just for young and athletic people, why do people in the Netherlands between 18 and 75 years all have similar distances cycled per day? Driving a car is quite expensive, with insurance and maintenance, and children or people with vision impairment are totally excluded. Cycling can be more inclusive.
A strong theme in the rhetoric around resisting change is that "the new infrastructure won't serve me individually." This view definitely ignores how many people the changes will serve. But it's also short-sighted -- if lots of other people switch away from driving, that's less cars on the road and less traffic for the individual who wishes to continue. We all breathe the same air, so reducing the vehicles on the road will benefit everyone. This is a longer-term, broader consequence that's hard to understand.
Another problem with reasoning about incremental changes (often for just a single stretch of road being redesigned) is ignoring the long-term vision. Cities use "master plans" and other long-term planning documents to communicate the overall direction, and may explain the individual changes in context of this vision. But if that story isn't effectively told, then the public can wind up arguing too much about the details.
In other words, I'm arguing that one of the biggest problems is around communication. If city leaders could more effectively market a proposal to their constituents, and if the public was better educated about the indirect consequences of these changes, I believe the political will to deliver changes would gain traction.
Let's look at how this communication happens today.
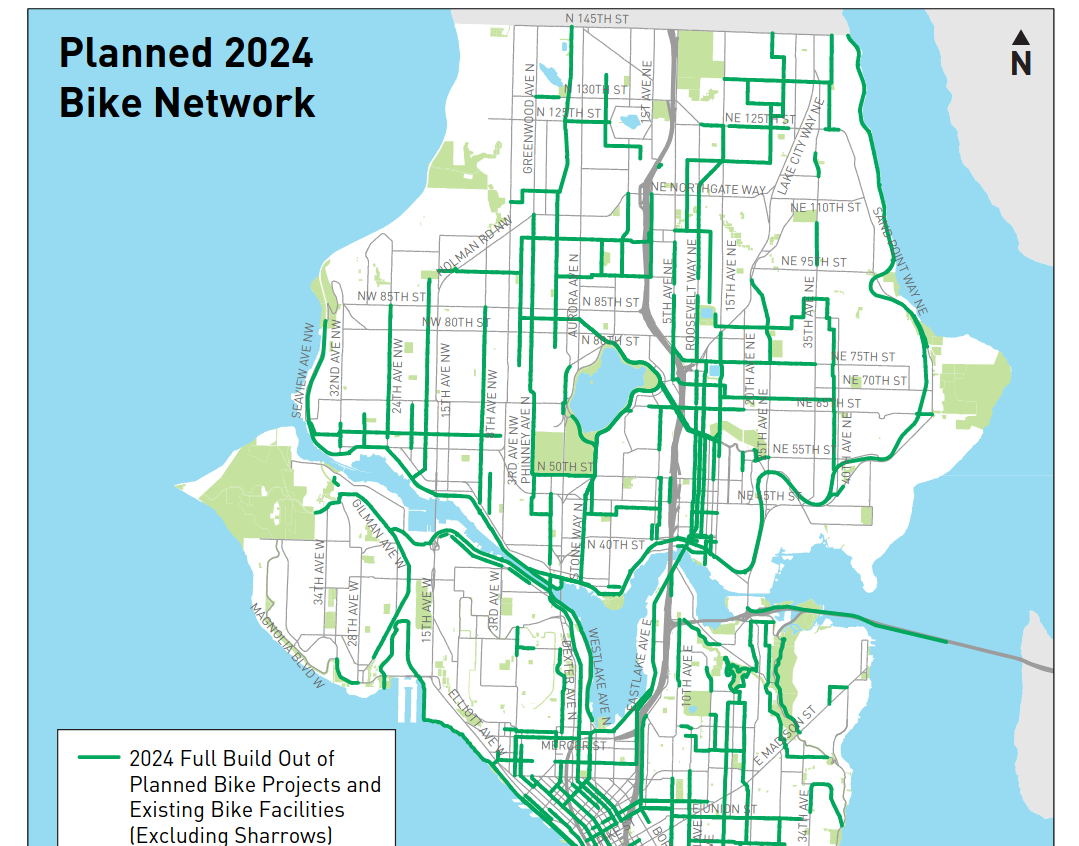
Large-scale changes
As a first example, let's look at Seattle's bike master plan, which describes what the bike network will look like by 2024. The official documents include a PDF that has an overview map, which can't even show the road names by virtue of being a fixed image:
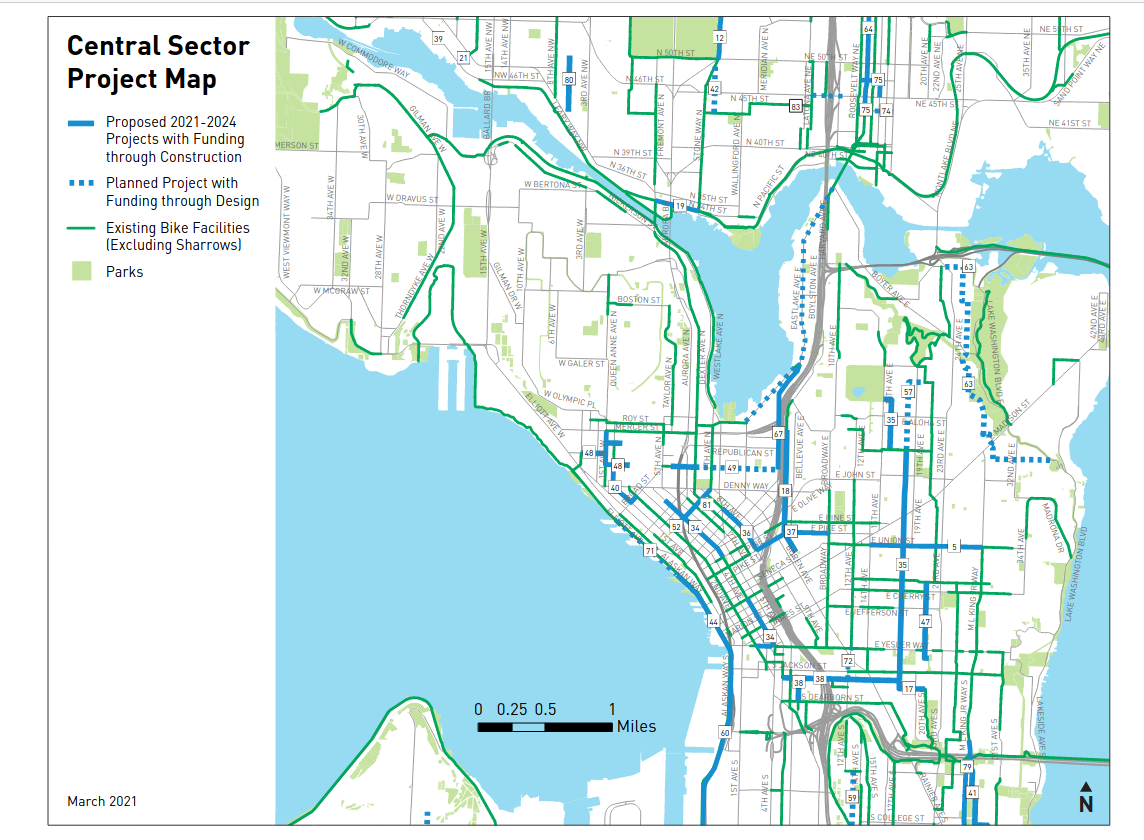
There are maps showing more detail in different areas:
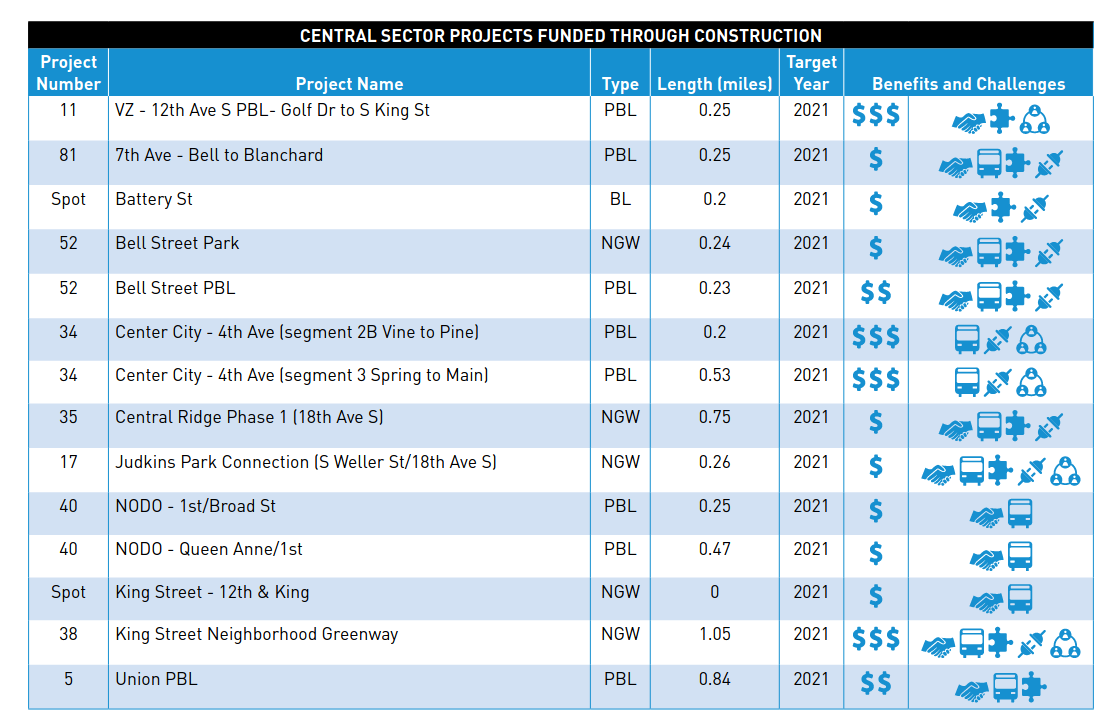
And tables summarizing some new routes:
The official page doesn't link to any web map, but digging around reveals an ArcGIS map:
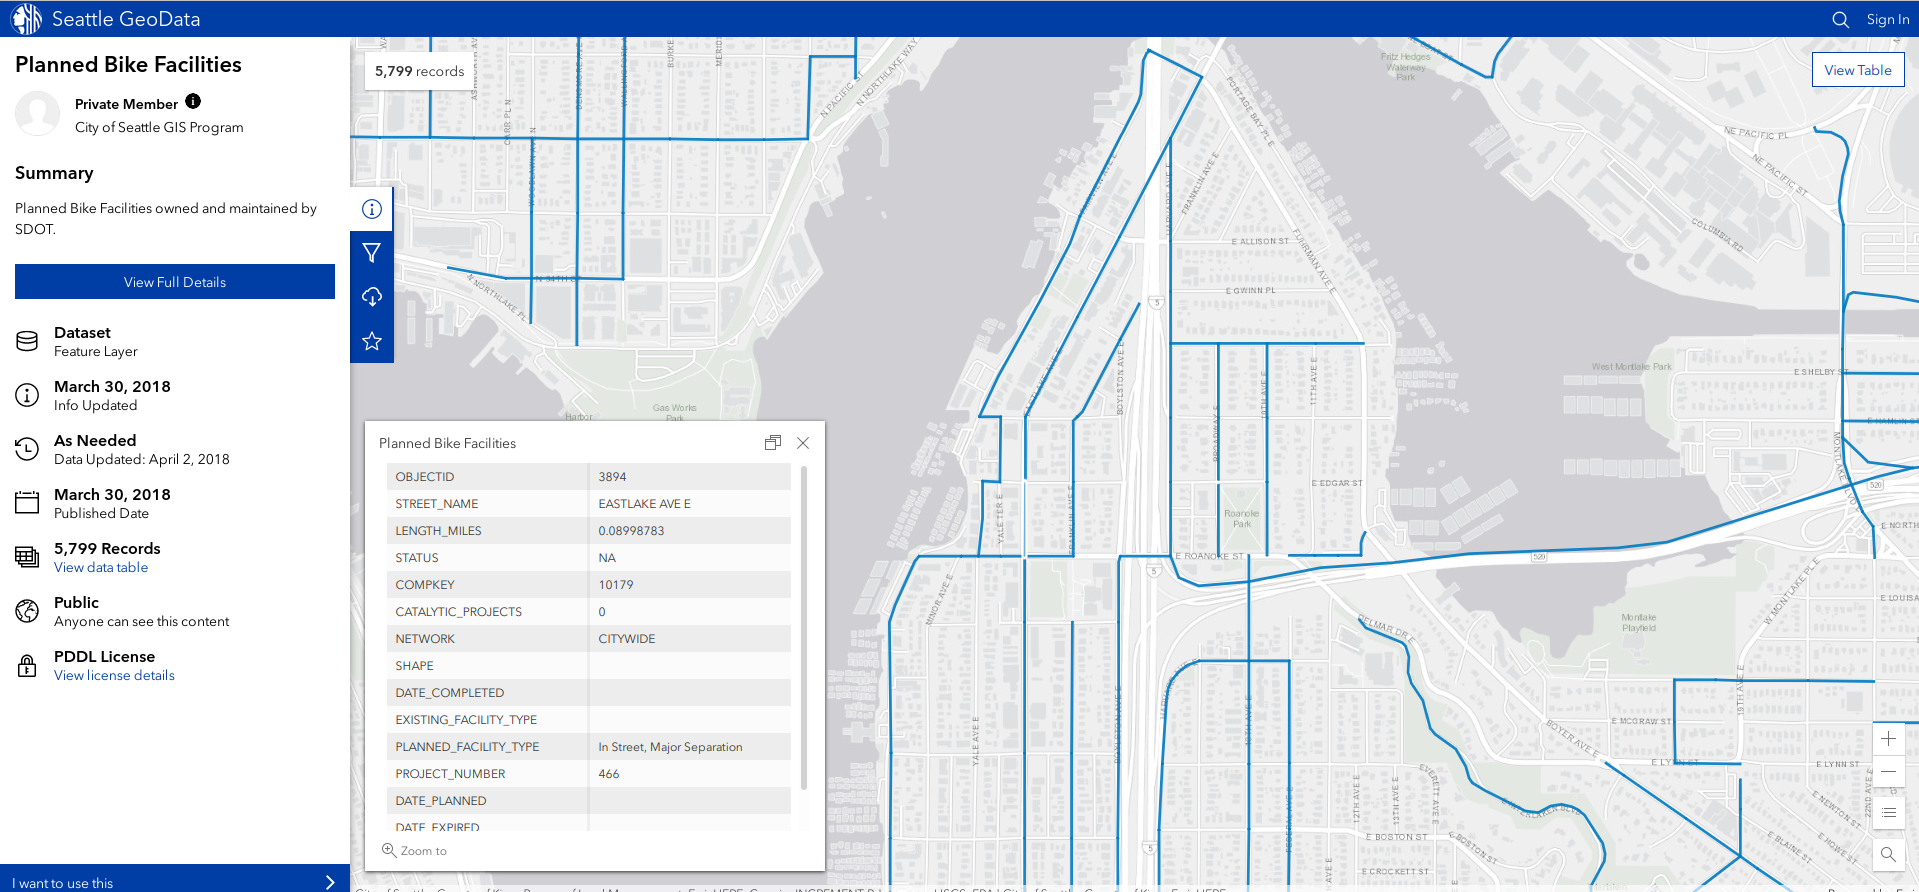
This is a little better, but it's overall pretty tough to just zoom into a road, see at a glance what it looks like today, and see what the promised changes by 2024.
A second example is Seattle Neighborhood Greenways, an advocacy group, describing which streets they'd like to see changed to prioritize people walking and biking, as a way to encourage exercise and social distancing during COVID. Their plans are a layer on top of Google Maps:
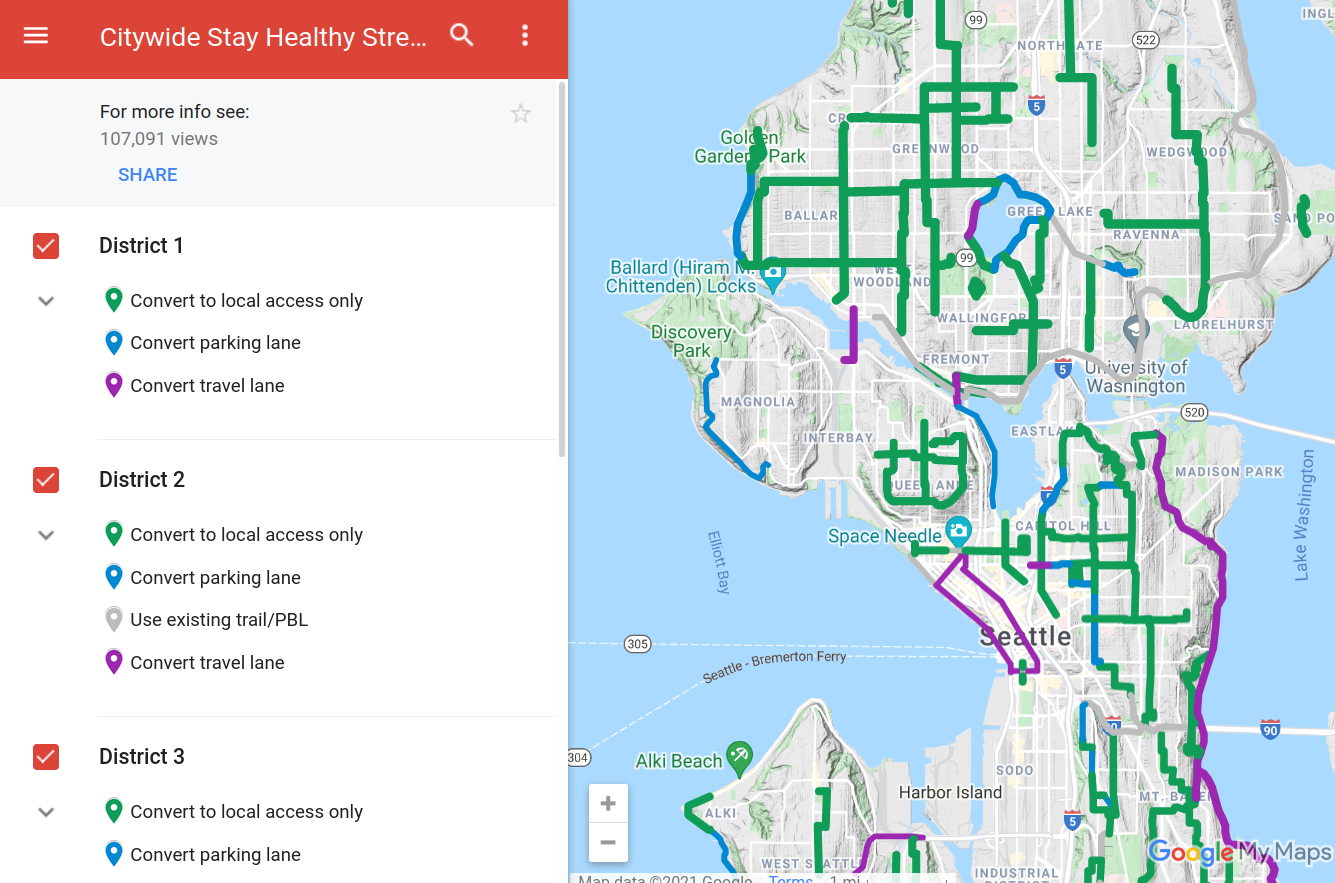
People are accustomed to interacting with maps by routing, to see what their particular trip might look like. None of these solutions let you plan a trip and compare how things might look before vs after the changes. As an individual, I want to know if these plans will make it safer, let me avoid hills, or let me comfortably bike past a commercial district. I have to interpret these planned changes and apply them to my particular situation. Or if I care about broader impact, these documents fail to sell me on the benefits, "we forecast that 200,000 weekly trips will likely start biking instead of driving if we make these changes. That could lower PM2.5 pollution by 3%..."
These methods of communication are also very "dry" -- they do nothing to paint a picture or tell a story about how awesome the city will be once this is built.
Individual projects
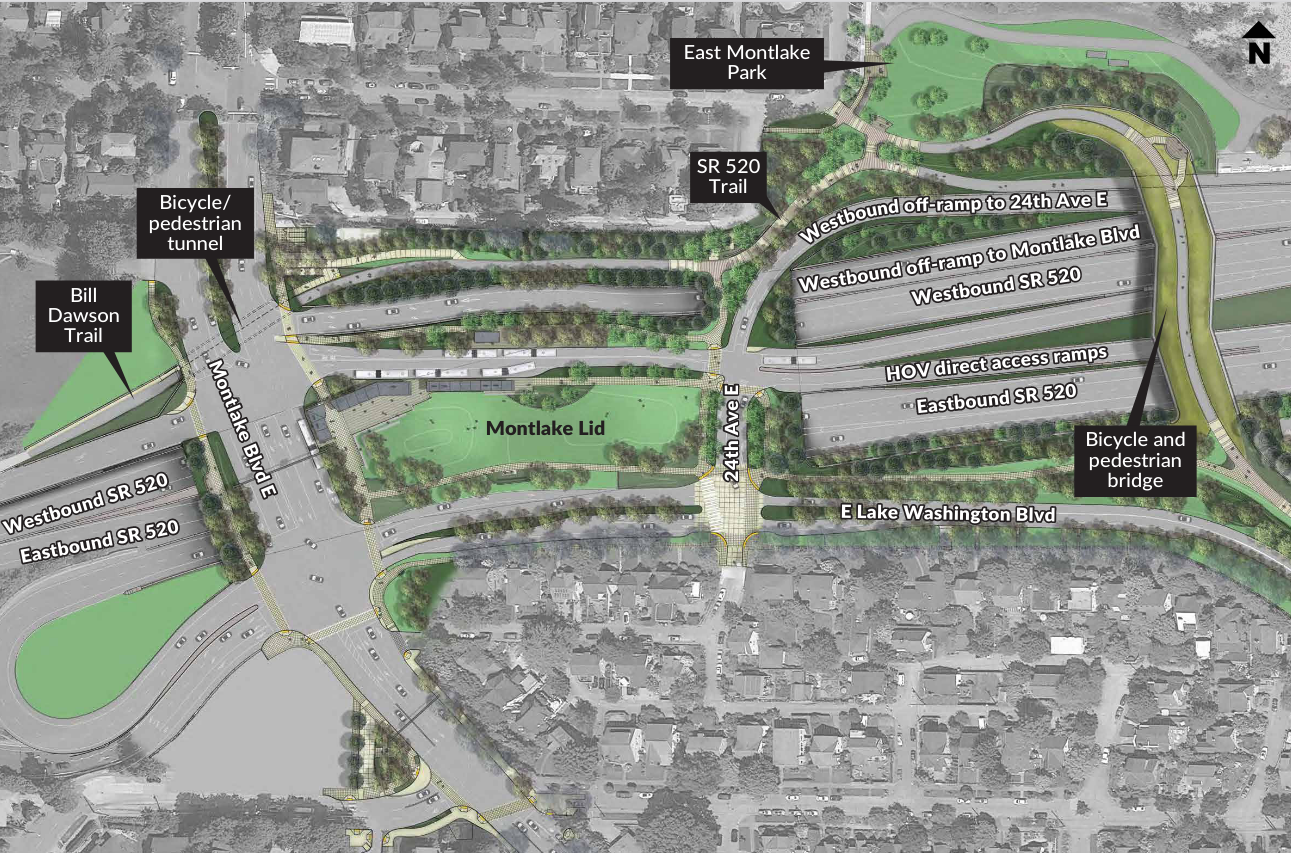
Let's examine plans to install a "lid" over the 520 highway in Montlake, Seattle. The plans show a new park where there used to just be a loud, unpleasant road. This is better in terms of visioning! But advocacy blogs have called out some important questions about these plans -- how long will it take for a pedestrian to wait for a light and cross from the west to east side (from a residential area to a light rail station)? In other words, what's the actual experience of just moving through the space as a pedestrian? A static map or diagram is going to have a hard time communicating this.
Visualizations of changes also tend to be very high-level or very low-level, and switching between the two views is difficult. For changes around Green Lake, here's an overview map:
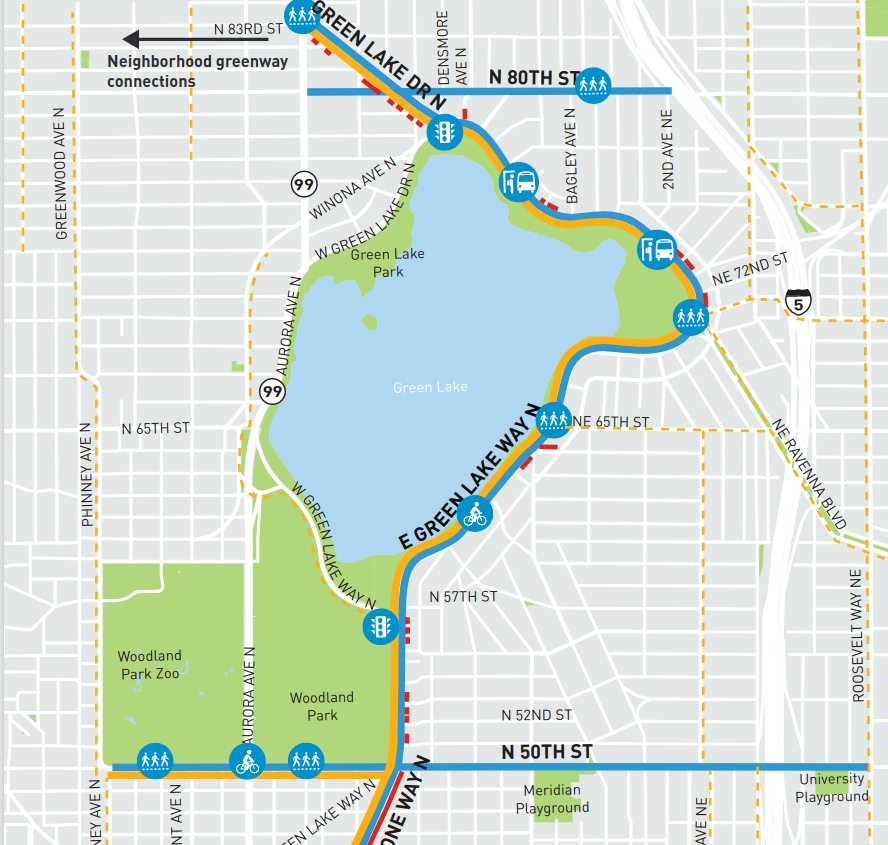
And a CAD drawing:
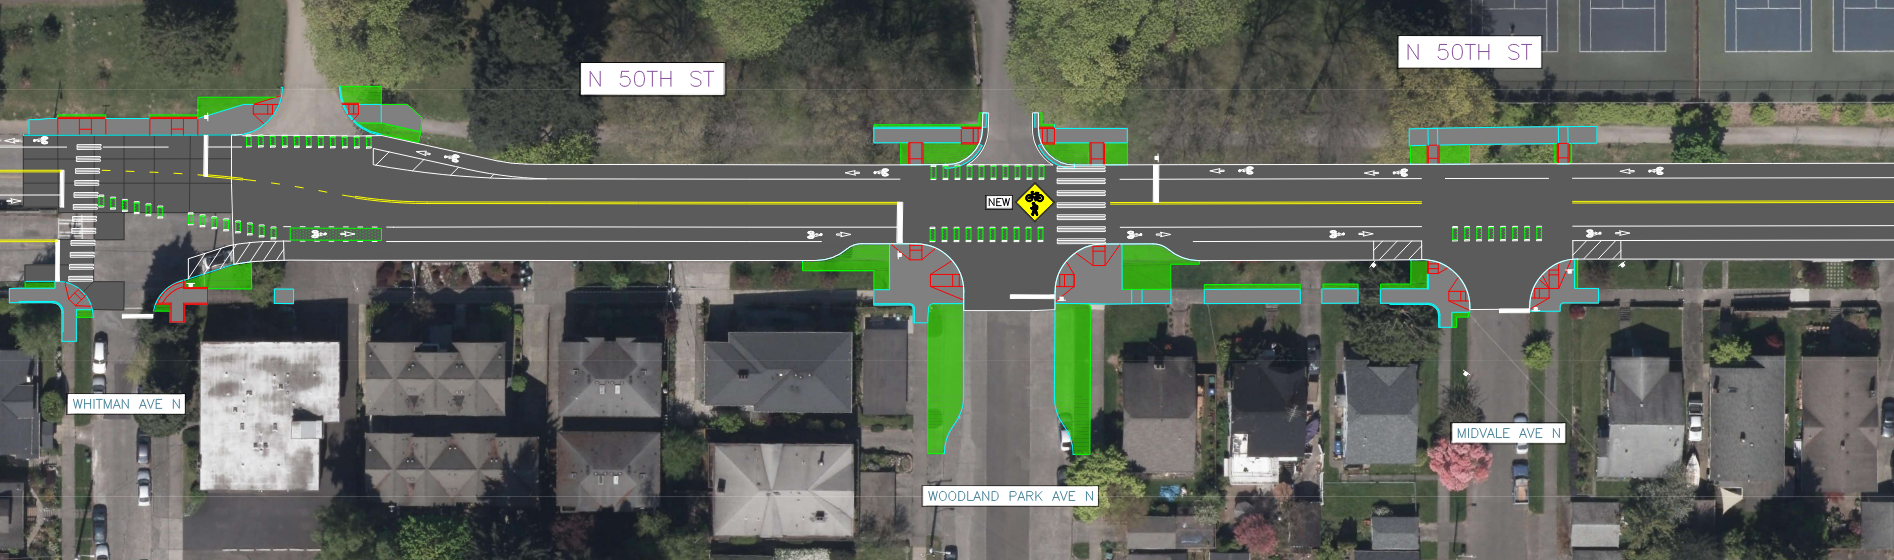
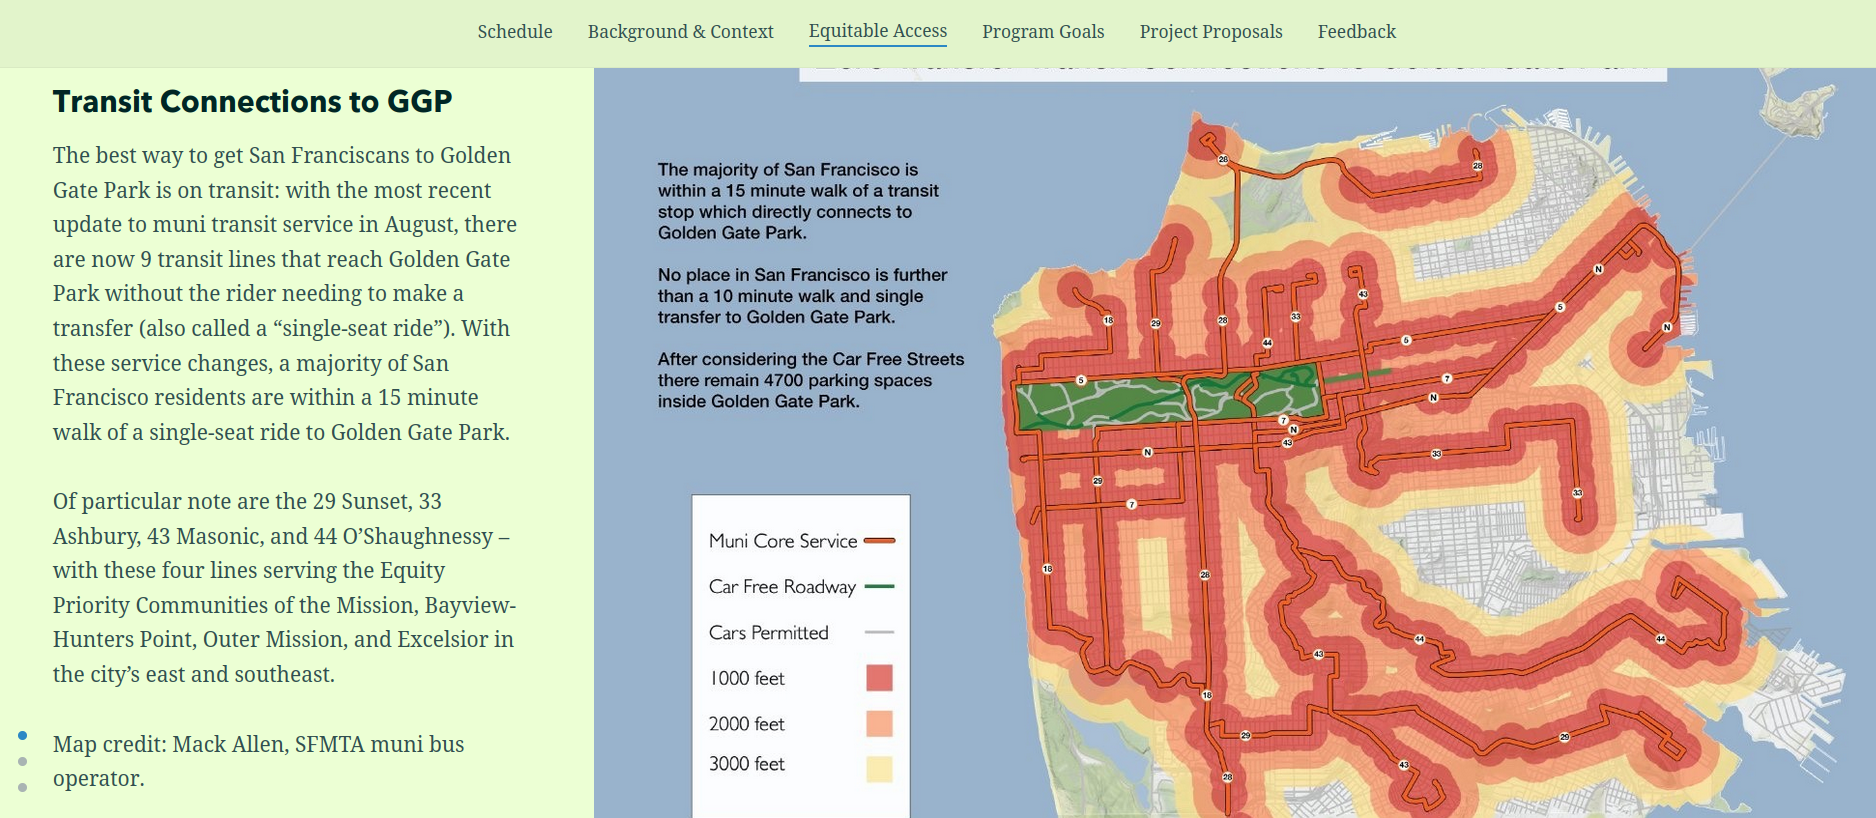
One of the best examples communicating changes I've found is San Francisco's Golden Gate park story map:
Gathering public feedback
Besides just asking people how they feel about some proposals, sometimes governments directly solicit ideas from people -- a form of crowd-sourcing. Seattle's Your Voice, Your Choice is an example, where people can drop pins on a map, describe a problem and possible solution. This program is meant for low-cost, "spot fixes" like making a certain intersection safer.
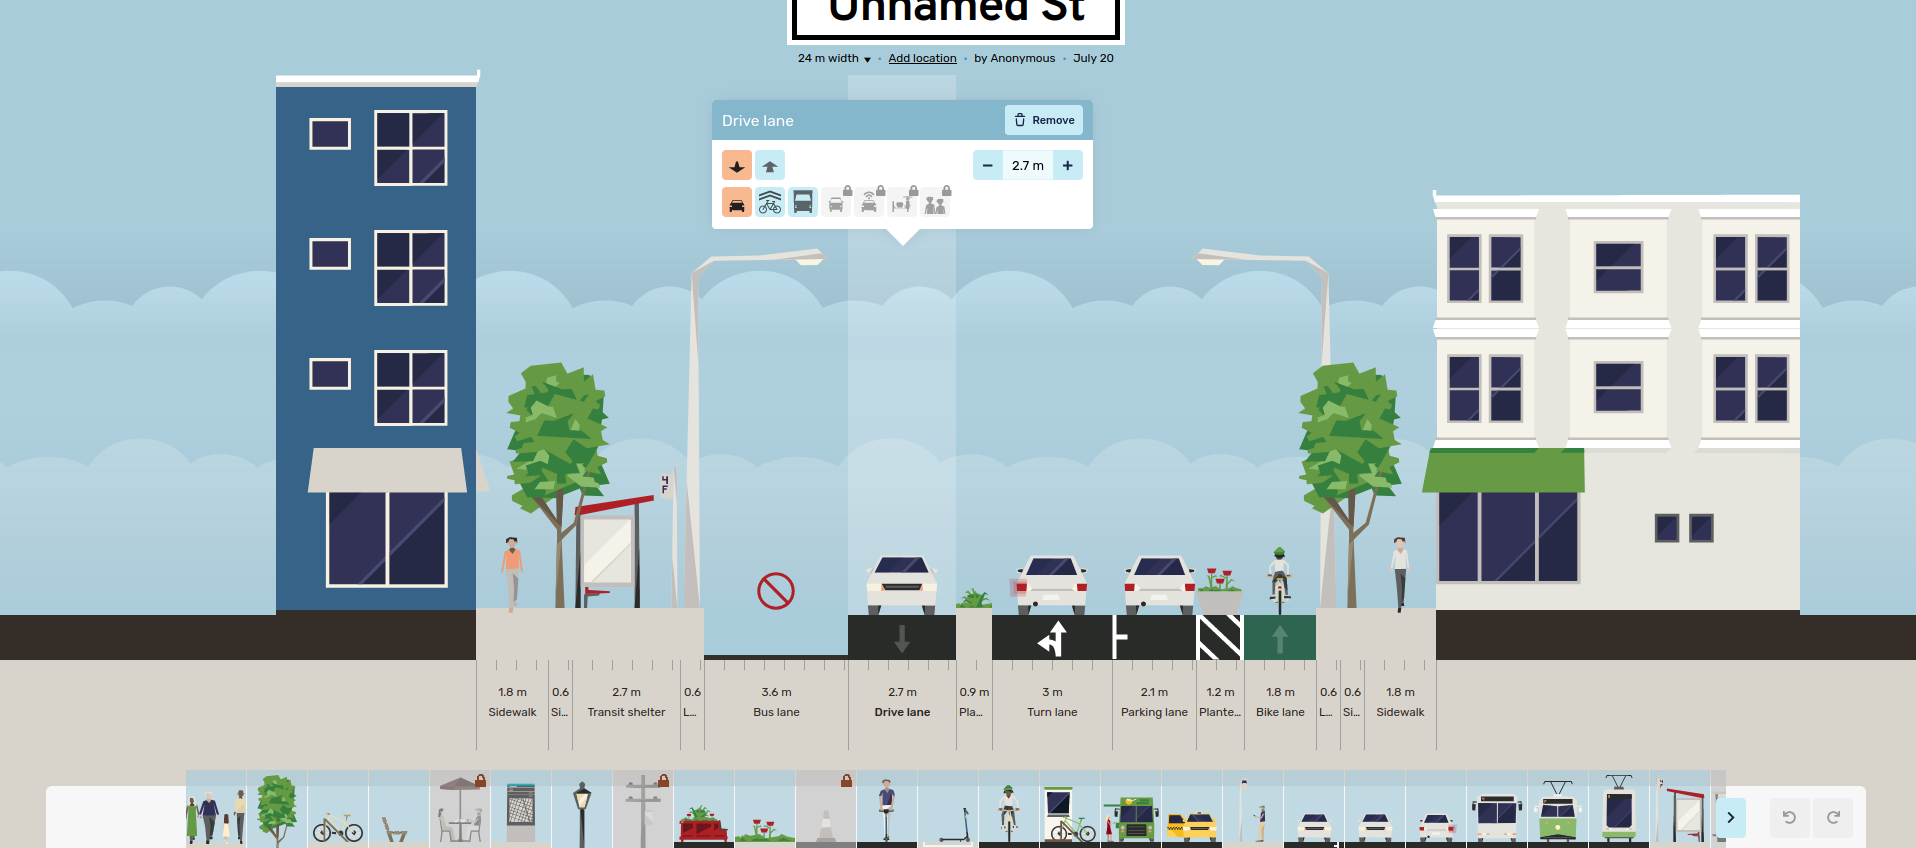
Probably the state-of-the-art in public engagement is Streetmix, a very easy-to-use and fun website that lets you rearrange space along a single street. People routinely share ideas through Streetmix, and public agencies often explain changes using it. The sheer ease-of-use and strong visuals are keys to its success -- the creators have a strong design background, and it pays off. Proposals in Streetmix have even become reality -- Bogota gathered 7,000 proposals from the public, then settled on something based on these designs.
Members of the public aren't experts in transportation engineering, so why not leave the work to the professionals? Laura Adler writes "Only with simple, accessible simulation programs can citizens become active generators of their own urban visions, not just passive recipients of options laid out by government officials.". Individuals are experts at some slice of the city, since they interact with it every day. It's unlikely city planners know every corner of the city as deeply as everyone else combined, so incorporating their experiences is important.
Besides generating better proposals, participatory design can also decrease resistance to change. Brian Deegan, one of the UK's leading street designers, describes this during a workshop for planning low-traffic neighborhoods. When he frames things as a puzzle -- "The number of cars has doubled in the last few years, they just don't fit, we have to fix this somehow" -- people set aside their personal biases and just treat it as an abstract problem to solve. As a result, everyone in the room feels more invested in the ideas produced. "Gamifying" the planning process could be powerful.
How this project can help
A/B Street in general and this bike tool in particular are an attempt to:
- help different stakeholders communicate more effectively
- visually inspire people to see what their city could become
- increase public engagement in transportation planning and amplify voices
Some example "success stories" might look like this:
- City planners use the software to sell the public on existing plans that're facing the threat of budget cuts
- Advocacy groups help amplify that message
- Support for the plans grows, people vote to fund it
Or:
- The government is struggling to implement a contentious low-traffic neighborhood plan. A vocal minority of the public is demanding the changes are cancelled.
- The city organizes an online "competition" to design the best compromise, using the new software
- People self-organize and debate their competing solutions to a shared puzzle, focusing on the details specific to their area
- The government adopts the winning solution and people accept it more readily, because they've been forced to work through the trade-offs of alternatives themselves
To clarify, A/B Street isn't meant to replace any internal CAD or engineering processes that the city already internally uses. It's meant for rapid prototyping and communication; it's a new first step in the design process.
Prior art
Other software exists for related problems. But nothing other than A/B Street:
- visualizes as much detail about existing street layout and bicycle facilities
- lets users easily mock up changes to a bike network, and route using the changes
- works anywhere in the world without substantial setup time
- is free and available to anybody
Streetmix is a huge inspiration behind A/B Street. But it only focuses on an individual street segment; it can't show how bicycle infrastructure exists in context of an entire city.
Remix has some similar goals, but it's meant for different city agencies to internally collaborate. It's expensive, unavailable to the public, and cities are only just starting to use it for public communication.
PTV Vissim is an industry-standard traffic simulator. Many of its customers use it to calibrate traffic models and plan changes. But it's extremely expensive and very difficult to use, especially when initially setting up in a new city.
MATSim and SUMO are open source traffic simulators that can run anywhere in the world. However, they're hard to setup and use, not focused on visualization, and can't easily prototyping changes to roads. They also don't run in web browsers, a further barrier towards people that aren't tech-savvy trying them.
Project plan
Stakeholders
There are three groups usually involved with city-scale transportation planning. First are government agencies -- city departments of transportation (DOT), state-level DOTs for some projects, public transit agencies, etc. Sometimes these contract planning or design work out to private consulting companies. Second are local advocacy groups, who help raise awareness about safety issues and vocally push the government to make changes. Third are individual citizens. Once they're engaged by the issue of inadequate cycling infrastructure -- often because of personal experiences or from looking for safe routes for their children to bike to school -- they get involved in a few ways. Many join the advocacy groups, volunteering their time. A few -- Joe Mangan and Pushing the Needle being notable examples -- start directly writing about their vision. And many more spend endless hours debating strangers online on sites like Reddit, Twitter, or the Urbanist blog.
The aim is for A/B Street to engage all of these stakeholders using the same data and software. Engagement strategies so far include meeting people in person (through meetups, community bike ride events, and public talks), posting demos online (using the "wow factor" of the software to grab attention), and networking. The most common problem so far (from the ~3 years of A/B Street work) is simply not hearing back. An individual or group initially finds the project, expresses interest, but disappears after an initial meeting.
Another challenge is deciding what software solutions can best help. A/B Street's focus has jumped all over the place -- traffic simulation, collecting data for traffic signal timing, 15-minute neighborhoods -- because none of the stakeholders clearly express a need for software to solve a particular problem. Few of these groups have much technical expertise in software, so how could they even imagine some far-fetched program that doesn't resemble anything they've used before? In traditional software companies, product managers serve the role of engaging with these groups, learning about their problems, and gathering feedback about possible solutions. The A/B Street team doesn't have resources for that so far.
A barrier to engaging with government agencies is establishing professional credibility. Governments are risk-averse and establish private industry partners slowly. A/B Street is an open source project not seeking any kind of profits, and backed by a few volunteer individuals. This is not something agencies are used to dealing with -- although in the past, Seattle's open data program hosted some hackathons specifically to engage with civic hackers. One workaround is to partner with academic researchers, who have more credibility and some prior relationships with government.
Seattle
The launch plan for the bike network tool in Seattle includes all of these groups:
- Individuals
- The r/seattlebike subreddit
- publishing an article to Seattle Bike Blog
- The hope is for individual readers of these online communities to try out the software, upload their proposals, and maybe become more involved with widely publishing their ideas. This will help demonstrate the people's visions to the government in a more visual and specific way than what happens now.
- Advocacy groups
- Seattle Neighborhood Greenways, with whom
I've been involved for a while. They're starting an "ungap the map"
campaign, which was one of the original inspirations for this tool's focus.
- The A/B Street team is already involved with one local chapter, the Aurora Reimagined Coalition. We attended a live design workshop in late August and got feedback on the initial prototype of the tool.
- Move Redmond, a similar group for a nearby city. I have some contact with them previously.
- Complete Streets Bellevue, also have prior contact.
- Seattle Neighborhood Greenways, with whom
I've been involved for a while. They're starting an "ungap the map"
campaign, which was one of the original inspirations for this tool's focus.
- Government entities
- I've met and demonstrated A/B Street to a few people within SDOT, but unfortunately I don't expect any further response from them.
- The Seattle Bike Advisory Board is more likely to be responsive.
- Seattle is about to elect a new mayor and city council in November. All the major candidates mention biking in their platforms, so I'll get in touch.
A/B Street has wound up local TV and newspaper media before. It might be strategic to repeat this for the new software, but I'd like to wait and see how many people use the tool and upload proposals. If there's a strong community response, I think this would merit another story.
UK
There's one exception to the difficulties mentioned previously about getting clear product requirements. Brian Deegan is a cycling planner who does consulting across the UK and whose company has written lots of design manuals. Thanks to Robin, A/B Street has a relationship with Brian, and based on studying a design workshop video by Brian, we've started prototyping a new tool focused on placing modal filters to establish low-traffic neighborhoods. The UK planning scene is currently more focused on this type of intervention than building bike lanes. So, we're planning to pivot and focus on this LTN tool after mid-October. The long-term strategy is to continue building these smaller, focused tools, all leveraging the common A/B Street technical platform. Different regions and situations will demand different planning software.
NYC
Thanks to the tool's part-time UX contributor Mara, we have a future meeting with TransAlt, an advocacy group in NYC.
Others
The A/B Street team has a collaborator at the Arizona State Transportation AI lab. It could be the right time to focus on the currently car-centric Phoenix metro area, with things like the car-free Culdesac community gaining traction.
San Francisco is another high-potential market for the bike tool. They have extreme hills, a very active cycling advocacy group, and a large tech industry workforce likely to be interested in this kind of software. During COVID, they established many slow streets. The A/B Street team has some connections to local advocates here.
Results so far
Stay tuned for the reaction to the tool's launch and the example Seattle proposal. Ultimately the measurable result is the number of real bike lane projects that reach construction and used A/B Street in some part of the planning or engagement process. In the short term, metrics we'll track are the number of proposals uploaded, the responses on social media, and any new collaborations that're started after launching.
Action plan
The immediate plans are to launch the tool the week of October 11 to all of the listed Seattle stakeholders. In a few weeks, we'll meet with NYC's TransAlt group. If the initial response in Seattle is quiet, we will launch to San Francisco, after fixing some elevation data issues there.
Roughly whenever we want, we could scale up to more cities. There's always some specialized effort to fix the most egregious OpenStreetMap data quality issues. Getting travel demand data is a common challenge, but it's less important for this bike network tool. The limiting factor to expanding quickly really is time and managing communications with all of the people who will initially be interested -- it's important to balance this with time spent actually working on the software.
Next steps
The immediate priorities are to polish the tool and finish things that didn't make the deadline:
- draw routes more clearly when unzoomed on large maps
- get the entire Seattle region to easily load on the web
- map out the official Seattle bike master plan as a second example
- add functionality to compare different proposals against each other and the current conditions
- implement the decay curves for mode shift to get predictions better calibrated by research
- consolidate the user flow into just 3 stages: explore, your trips, and proposals
To support rolling out to more cities:
- improve elevation data (switch from SRTM to NASADEM)
- snapping separate cycleways to the main road
There are also more features we could add:
- hover on commercial buildings to summarize what's inside
- showing historic collision data to emphasize the dangers of high-stress roads
- animating cyclists following sample routes before and after, using A/B Street's traffic simulator
- simulating other vehicles nearby to enhance the visualization
- improve routing by allowing bikes to enter/exit buildings from either side of the road

Future directions
The longer-term vision for A/B Street in general extends beyond just improving the bike network tool and rolling out to more cities.
- low-traffic neighborhood planning
- As mentioned above, we have a promising collaboration to expand an initial prototype to help design LTNs, which are a very active topic across the entire UK. This is probably the highest immediate priority.
- public transit
- A/B Street has plans to simulate buses and light rail, but there's lots of work to build it out. We'd love to partner with Seattle Subway and inspire the public to vote for ST4
- a website for organizing proposals
- Although it's now possible to share individual A/B Street proposals by URL, there's no way to browse, upvote, or give feedback on ideas
- story-mapping
- Today we present A/B Street ideas like the Seattle bike vision in two formats -- a blog post with pictures, and the software itself. Story maps could be a format to combine these.
- more detailed street and intersection design
- A/B Street doesn't let you visualize or edit details like pocket parking, parklets, curb bulbs, or barriers in intersections. This is maybe something we should leave to experts with CAD software, but it could be worth modeling this level of detail too.
- Incorporating a satellite view layer would also be useful to understand changes in context
- more detailed pedestrian simulation
- Telling an effective story about what a new cafe street or public square requires showing people using the space to meet friends, share meals, relax, and play. A/B Street today just simulates people making trips. We'd like to explore crowd simulation and visualization.
- Incorporating census and demographic information
- City planners prioritize changes based on nearby residents' income, age, employment, and other demographic factors. A/B Street could use public data to further measure the impact of changes.
- Modifying land use policies
- Many cities outlaw medium- and high-density housing in most of the city, and force residential and commercial sectors to remain physically distinct. This leads to longer trips, which most likely use cars. We've started exploring this relationship, but there's no way yet to modify the zoning policy for some land parcels and explore possible effects.
- 3D visualization
- Another way to visually communicate changes is with 3D renderings. We could partner with 3D Street and export A/B Street designs to engage the public even better.
In other words, we envision A/B Street growing into a general digital twin platform for exploring different aspects of urban design. We will continue our key differentiators from other projects of remaining open source and geared towards the general public's use.
Resources needed
In short:
- connections to government or industry stakeholders who could sponsor the project, provide use cases, etc
- staff
- funding (as a way to hire people)
Staffing
A/B Street has just one full-time software developer, who also plays the role of project manager, marketer, and writer. There are a handful of volunteer UX designers and programmers who sometimes have time to help. To really deliver on the project's ambition, we need more full-time help:
- a visual designer, with particular cartography expertise
- A/B Street's zoomed-in view presents an unprecedented level of detail about each lane on a road. We also simulate individual vehicles and people moving around. Color and design choices are difficult. There's lots of information to display.
- This is vital, because A/B Street's job is to tell stories and sell a vision to people. This is best done visually, not by just presenting data!
- UX designer
- Yuwen served as the project's UX lead for ~1 year and totally transformed the project. We need full-time help here again.
- product manager
- Urban planning is a broad space, and figuring out the most important area to focus on is hard. Requires networking with advocacy groups, city planners, etc across the world and figuring out their problems and ways to help.
- marketing expert
- First use is just helping convince different stakeholders to use and invest in A/B Street
- But perhaps more importantly, somebody who understands how the general public perceives transportation and city changes, and can figure out how to educate and convince people it's beneficial long-term
- software engineers
- A/B Street is both very broadly-scoped (and so just needs lots of help implementing) and tackles some very difficult problems requiring deep focus
- Because of this and the use of Rust, a programming language that has an initial learning curve, it's a difficult project for beginners to contribute to.
A single person may be able to serve multiple roles -- for instance, visual designer, product management, and UX. Or a UX designer who can help with programming.
Budget
Say we want to hire one Rust software engineer and one UX designer (who would also help with the cartography and product management roles) for a year. Depending where the employees live, median salaries differ significantly. Glassdoor estimates £42K for a general programmer in London, or $85k for Seattle. Neither the engineer nor designer could be entry-level for a project this complicated.
Funding sources
Becoming a traditional business goes directly against A/B Street's core philosophy. Cities belong to everybody who lives in them, so the planning processes around them should be transparent, accessible to everyone, and any research studies should be reproducible. Open-source software and public data are vital to this. A business exists to generate profit, even if those profits are modest and just meant to sustain the business. The ultimate metric that matters for this project is impact on the real world -- making transportation more environmentally friendly. Therefore, a B-corp or benefit corp might be more appropriate.
One possible direction is consulting. Cities contract the A/B Street team to specialize the software for their immediate needs. All of the work is open source. So effectively they would just define priorities for the project. OpenTripPlanner is an example of open source transportation software funded by different groups as a public good.
Other options are crowd-funding (like Github sponsors) and applying for grants like the Rees Jeffreys road fund.
Schedule
My time commitment is unknown starting November, so I'm only describing the next few weeks.
- October 11-15
- most of the next steps items: unzoomed drawing, large maps on the web, comparing proposals
- gradually launch Ungap the Map to a Seattle audience
- October 18-22
- mode shift decay curves, NASADEM elevation to support San Francisco and NYC rollout
- continue rapid prototyping of the new low-traffic neighborhood tool
- October 25-29
- simulate nearby vehicles (also needed for the LTN tool)
- respond to feedback from whichever stakeholders respond
Technical details
This document summarizes how the Ungap the Map tool works. The tool is just one piece of the A/B Street platform, which has much more technical documentation.
System overview
A/B Street is generally organized into 3 layers. The lowest is the map model, which represents the transportation network of some portion of a city. This model combines the geometry of roads and intersections, routing for different vehicle types, and semantics like turn restrictions, parking, traffic signal timing, and land use patterns. In some regions, there's also a travel demand model describing the trips that people regularly make. Lane configuration, intersection control policy, and access restrictions can all be changed in real-time (usually sub-second). You can think of the map model along with the travel demand as a digital twin of the city, at least from a transportation perspective.
A map and travel demand scenario are just files covering some manually-drawn boundary. The map has "borders" along the boundary, and the travel demand model can describe trips beginning or ending off-map somewhere. There's a complex process to generate a map, pulling in and heavily processing data from OpenStreetMap, different travel demand sources, city-specific datasets about parking, and elevation. All of the datasets are public. This process works for any city with sufficient OpenStreetMap coverage, but it still takes lots of work to improve the imported map. Many cities have already been imported and stored in Amazon S3; most users will never need to perform this process themselves.
The next layer is a 2D rendering and user interface library, written from scratch on top of OpenGL. These libraries have common code for interacting with the map in many ways, and managing things like downloading files for new cities. There's also a traffic simulation in this layer, although the bike network tool doesn't use it. Everything in A/B Street is written in Rust. One advantage of this is that everything can run either natively on Mac, Windows, or Linux, or be compiled to WebAssembly and run in web browsers without any installation.
Finally, the third layer consists of user-facing apps that make use of everything. The bike network tool lives here, alongside tools that're focused on related topics like 15-minute neighborhoods and low-traffic neighborhoods.
Sharing proposals
When the user adds bike lanes to some roads, all of the changes are saved locally as a JSON file. Since the tool's goal is for people to communicate about their ideas and spread the word, there has to be some way for them to share these files. This could be done manually by email or something else, but that would be really painful. So the software can upload the files to a central server, and people can just share a URL to download the file later.
Ideally, this feature would include a proper user account system, where people can sign up, modify their proposals, and maybe even share comments or feedback about other proposals. There are many technical and design challenges with this -- for example, how to prevent abusive users from posting rude comments? In the long-term, this is worth tackling, with careful design to facilitate useful interactions.
But to get something working in the meantime, the JSON proposals can just be shared anonymously. They're uploaded to a central server, which returns a URL to share. Somebody else can load the proposal with that URL. Everybody remains anonymous; it's impossible to prove who uploaded a proposal, or to edit or delete it. The central server is a simple Go API hosted in Google App Engine, storing files in Google Cloud Storage, and using MD5 checksums to identify and de-duplicate proposals.
Routing
Unsurprisingly, A/B Street uses
Dijkstra's algorithm to
find paths. The interesting details are how the graph's edge weights are set for
bicycles. The weights are expressed in units of time, guessing how long it'll
take the typical cyclist to cross a road or turn through an intersection. This
is usually just distance / speed. The speed accounts for elevation, and
the calculation
is adapted from the Valhalla routing engine. See the
vehicle_cost method
for specifics.
Additionally, the user can specify preferences to avoid steep hills or stressful roads. Steep hills are defined as having over 8% incline, and when one is encountered, the cost to cross it is multiplied by 2. Note this multiplication happens after adjusting the typical biking speed to account for the incline. Stressful roads are similar -- if a road is classified as an arterial or highway and lacks bike lanes, the edge weight is multiplied by 2. There are many possible ways to tune these parameters; the current implementation is simple, but produces results that match personal experience around Seattle.
Note the mode shift calculation instead uses contraction hierarchies, which require an expensive one-time preparation step, but answer queries much faster than Dijkstra's. On most of the Seattle maps, the travel demand models require at least 100,000 paths!
Adding bike lanes
The user can edit an individual road segment in detail, configuring individual lane widths. But of course this is really tedious, so most people will probably use this tool to automatically add lanes to an entire path at once. This tool shouldn't require the road to be physically widened -- this is incredibly expensive, and often there's no room to expand in the middle of a city. So instead, the heuristics try to replace existing street parking or extraneous driving lanes. In reality, OpenStreetMap data isn't high-fidelity enough to capture the real width of a road. Often a driving lane might be 15 feet wide, and there's plenty of room on the shoulder to at least paint a lane. See the heuristics and unit tests for details.
Predict impact
This is the most complex piece, due to the number of assumptions made. Particular thanks to Robin Lovelace for lots of advice here.
For a planner to evaluate building out a proposed bike network, the key question is: how many people will use it? This is an incredibly open-ended research question. For example, there might be some people today who live in an area where driving is the only reasonable mode of transport, but they don't have access to a vehicle or have an impairment preventing them from driving. They might choose (or be forced to) work remotely in this situation, and wait to car-pool for groceries. If cycling became a cheap and safe possibility, they might start taking entirely new trips -- this would be a positive instance of induced demand. Over time, if a city becomes friendlier to walking and biking and builds more affordable housing, travel patterns may change dramatically as people decide to live and work in the city, instead of commuting from the suburbs. This long-term, region-scale forecasting is the domain of groups like the Puget Sound Regional Council.
Mode shift: part 1
So let's narrow our focus and just consider "mode shifting" existing trips that people currently perform by driving. We start with a travel demand model describing individual people's typical weekday schedule. The schedule defines a sequence of trips, with specific locations, departure time, and mode of transport. The tool first filters these trips to find all driving trips happening entirely within the map boundary. (If a trip begins or ends somewhere off-map, we don't really know its full distance and can't evaluate relevant factors along the whole journey.)
Mode shift: part 2
Once we've found the initial set of driving trips, we have to figure out which ones would even consider switching to biking. If somebody drives somewhere in 10 minutes now, it's unlikely they'll be willing to bike for an hour, especially if they have to climb steep hills. That's the intuition behind the Propensity to Cycle tool, which calculates a distance and hilliness decay model to predict the percentage of trips that would consider biking. Currently the software defines a hard threshold for these two parameters -- the user can specify the maximum time someone is willing to bike, and the max elevation gain they'll endure. In the future, we can change this to use the decay functions from that prior research, and use data particular to different regions to make this more evidence-based. For instance, as e-bikes become more popular, hilliness becomes a less important factor.
Mode shift: part 3
Based on those settings, the software will calculate all of the biking routes that the filtered trips would take. The question then becomes, why don't those people choose to bike today? The barrier this project focuses on is safety -- even if the most direct cycling route isn't long or hilly, many people aren't willing to risk riding alongside heavy traffic when the street isn't designed for that.
So the tool first displays a red heatmap showing a count of all of the roads where trips would switch, if it was safer. This guides the user to consider adding lanes there.
Then the tool calculates if the proposal makes each trip safe enough. Currently this just sees if even one road segment of the trip now has infrastructure, but this will be made configurable soon!
Carbon score
Finally we have an estimate of which trips might switch from driving to biking! So we can sum up the total mileage of the driving route, multiply by 5 days a week, and 52 weeks a year. This gives us the annual vehicle miles travelled that a proposal will remove. Assuming 404 grams of CO2 per mile -- since we don't have more details about the distribution of vehicle types available -- we can estimate the annual CO2 savings.
Caveats and assumptions
This software aims to do something pretty complicated, based on imperfect public data, and was built by a tiny team. So naturally it has many problems, but hopefully the goal is still achieved. Regardless, let's be clear about some limitations.
Map data
First, OpenStreetMap is produced by volunteers. The tagging schemas can be quite complicated, and detailed lane data is often missing or wrong. Road width is almost never mapped directly. A/B Street tries to workaround these issues with aggressive heuristics.
You'll notice many parts of the map look visually broken, especially near major junctions. That's because generating intersection geometry is incredibly hard.
One particular problem is how protected bike lanes are mapped. In OpenStreetMap, these are represented as separate, but parallel, objects from the main street. This usually appears in A/B Street as the cyclepath just overlapping the road in a completely broken way. "Snapping" the parallel objects together and treating as one road segment is the goal, but this is very hard and ongoing work. The routing should still be able to use the separate cyclepaths, and so things like mode shift calculations should still be fine.
Travel demand data
The impact prediction needs to know trips people take in order to guess which of those trips might mode shift from driving to biking. For Seattle, we use Soundcast, but notably the model is only available for 2014, which is quite out-of-date!
Elevation data
A/B Street uses this Python library to process elevation data and figure out which streets are steep. Currently the results are quite realistic in Seattle, thanks to King County LIDAR data. Everywhere else, currently NASA's SRTM is used, and the results don't seem to be working yet. Additionally, elevation data near bridges is usually messed up, with the bridge suddenly having the ground or water's elevation, and we're not working around this problem yet.
Regional differences
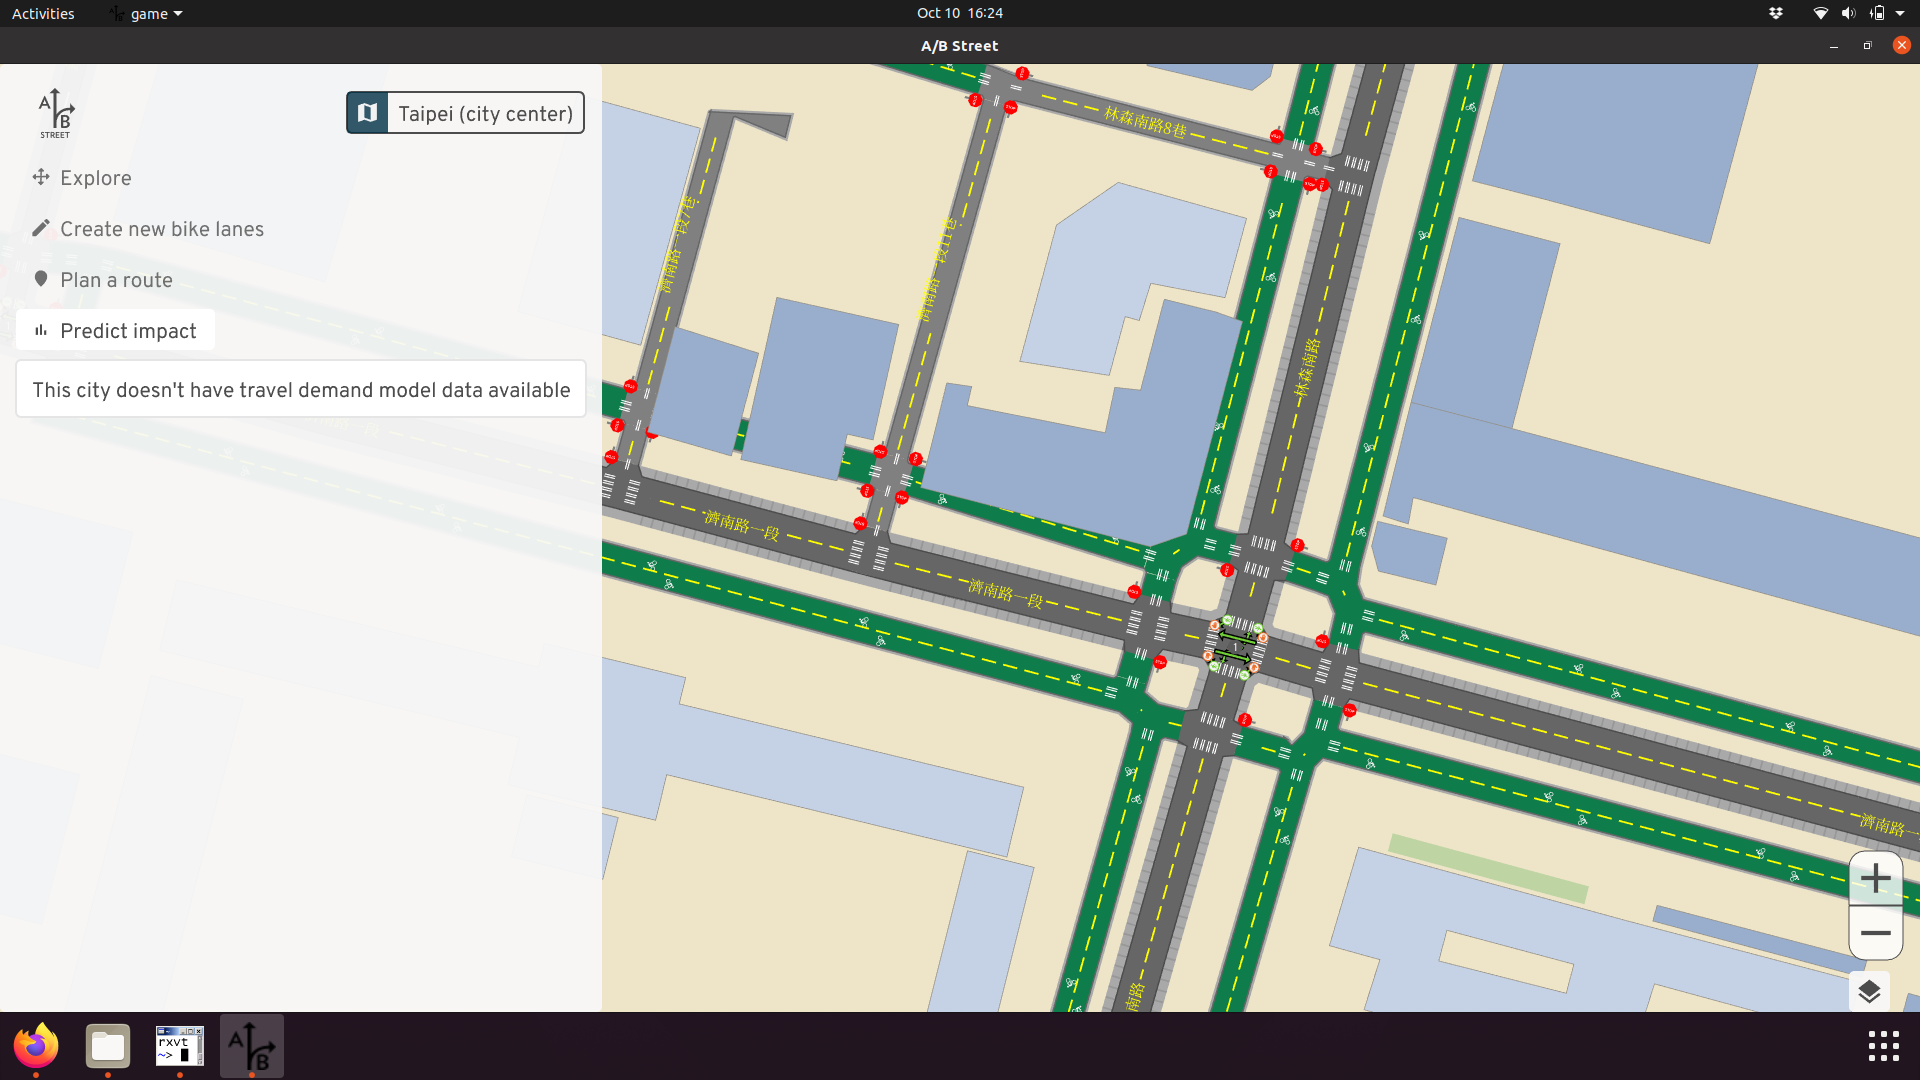
Although A/B Street can work anywhere in the world, its model of roads and travel behavior along them makes some assumptions more tuned to North America and the United Kingdom. A notable example where these assumptions break down is in Taipei. If you look at A/B Street, it seems like there's a phenomenal network of dedicated cyclepaths along most major roads!
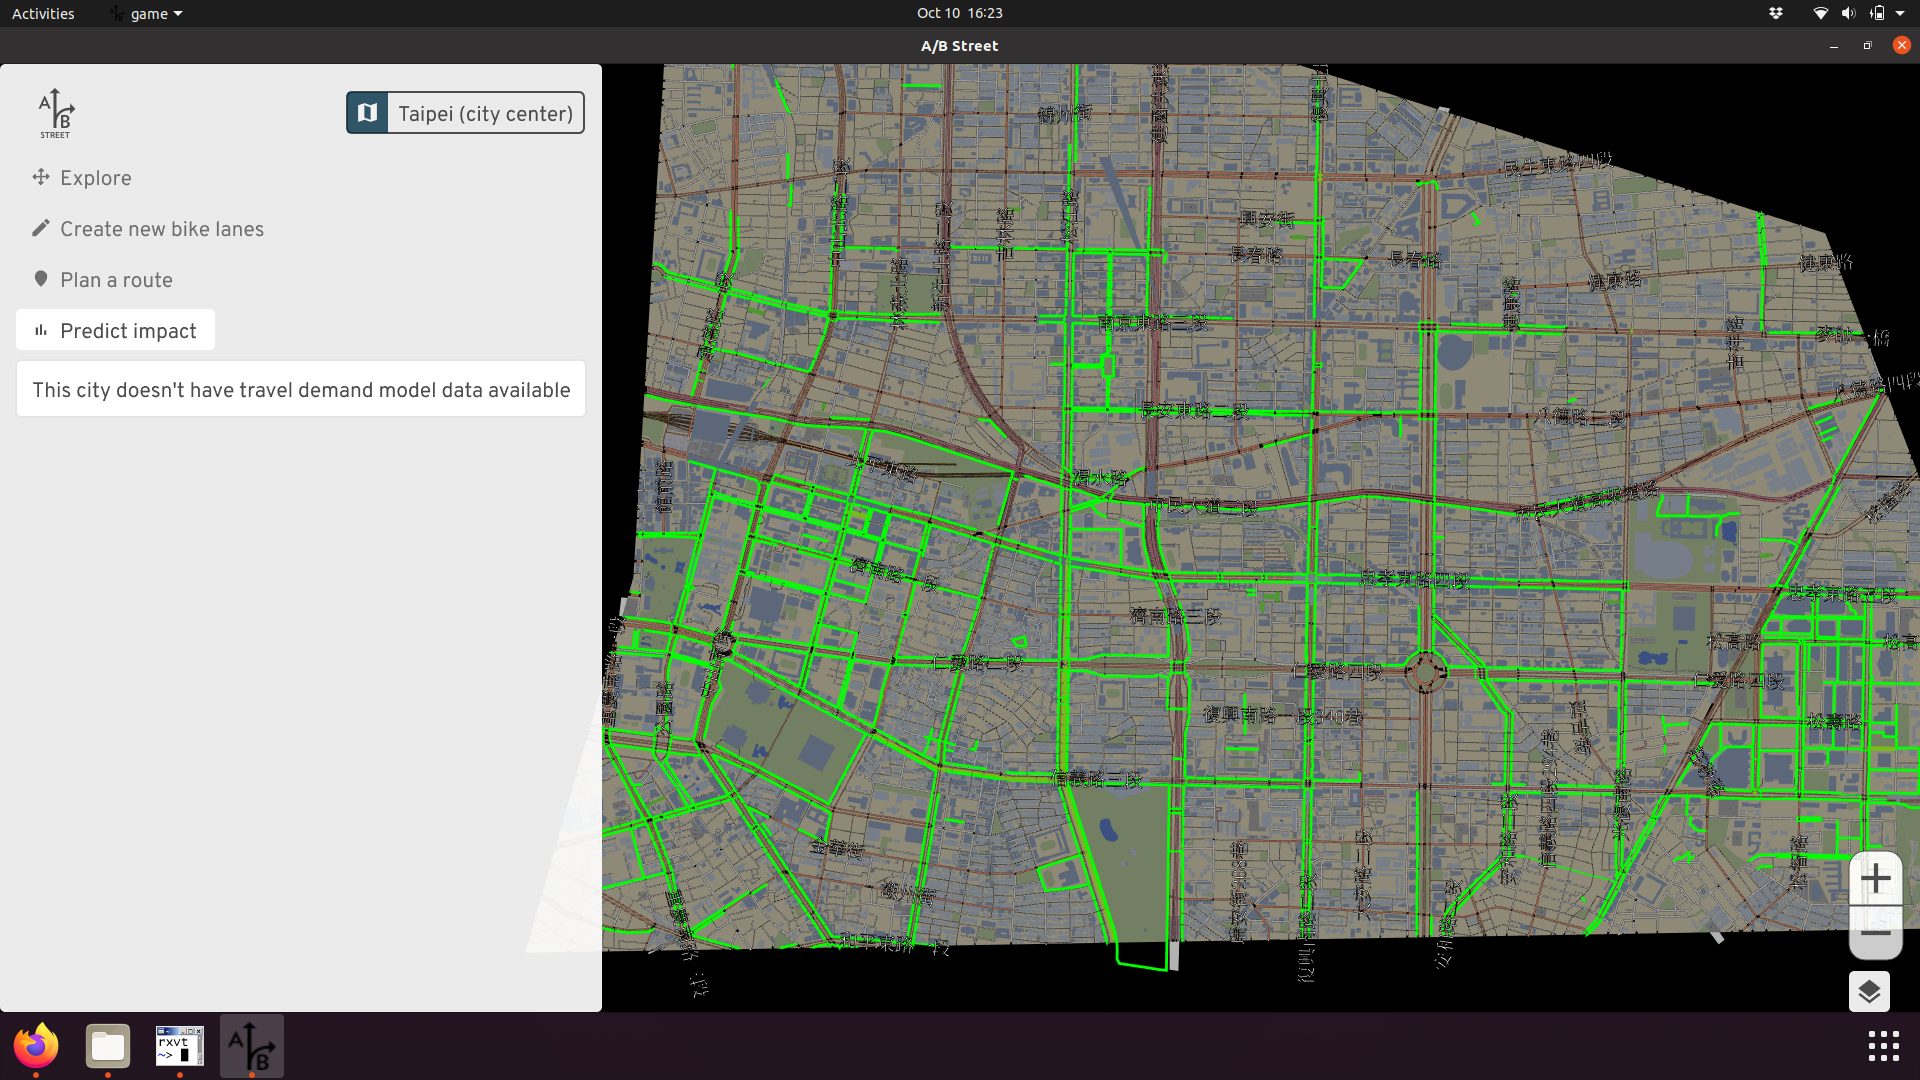
But actually, these are just the sidewalks. Cyclists and pedestrians share this space, and may come into conflict if many people switch to cycling.
Apparently there were some efforts some time ago to install dedicated bike lanes on the roads, but not many people used them, because there's less shade from the sun during summer. In my own research about biking in Taiwan, I didn't discover anything like this; it took local knowledge from the hackathon organizers to clue me in! (Later, I found a bit more about the history of biking in Taipei.) Barriers to cycling uptake vary across the world. Also, in Taiwan, smaller vehicles like mopeds and bikes use hook turns, which should affect routing and simulation. But A/B Street doesn't model this yet.
High-stress roads
One of the key metrics for evaluating a cycling route in the software is how much of it crosses high-stress roads. Currently that's just defined as a "major" (arterial or highway) classification without any bike lanes. There are much more rigorous ways to define stress, such as the one by People For Bikes. Quickly comparing the results from this tool and A/B Street, we mostly agree, though.
15-minute neighborhood explorer
- Web version
- To run locally, get the
latest release for Windows,
Mac, or Linux. After unzipping, run
fifteen_min.exeorfifteen_min. - This page: 15m.abstreet.org
In a 15-minute city, most residents can reach a variety of stores, restaurants, parks, and jobs within about a 15 minute walk or bike ride. Part of advocating for a bike-friendly city is evaluating the zoning laws and understanding where people live in relation to where they work, shop, and meet friends. This tool is a prototype letting you see what's 15 minutes away from a starting point. You can explore the shops and estimate how much street parking and how many people live within a walkshed.
Feedback
The tool is quite simple right now. If you have an idea how this could be used for advocacy, please get in touch.
Implementation
This section describes some of the technical implementation details.
Calculating time to buildings
When you click on a starting building, what happens? Follow along with the code: https://github.com/a-b-street/abstreet/blob/master/apps/fifteen_min/src/isochrone.rs
First, we calculate the time to reach all buildings on the map from the start, based on the current options for walking or biking. For walking, this calls all_walking_costs_from. This method simply performs Dijkstra's maneuever, floodfilling a graph from the start node and tracking the cost to reach other nodes. It terminates early when the cost exceeds 15 minutes.
One relevant detail is that the graph is based off of WalkingNodes, which
represent both endpoints of a sidewalk. A building exists some distance along a
sidewalk. To calculate the final cost to a building, we also add up the cost
between the nearest end of the sidewalk and the building's exact position along
the sidewalk. This calculation doesn't use the length of the building's
driveway/front path, but it could.
The other question is how we calculate the cost to cross a sidewalk. The units
are durations, and most of the time, we simply calculate distance / speed. The
base speed for walking can be configured in the 15m tool UI, with a few pre-set
values for jogging, using a wheelchair, or a general average for adults. We also
adjust speed based on the road's incline,
using a variation of
Tobler's hiking function.
The elevation data baked into the map model likely has bugs, which then affect
walking speed.
In the future, we'll keep expanding this definition of "cost" to capture other factors that make it safe and pleasant to walk, so that the 15m tool ultimately reflects how awful it'd be to access essential services by walking along a busy arterial road.
Drawing the isochrone
Now that we have the cost to reach a bunch of buildings, we want to draw the three-colored isochrone, showing the area reachable within 5, 10, and 15 minutes. We use the contour crate to do this, which uses the marching squares algorithm to find the "contour" where the cost changes from less than 5 to over 5 minutes.
In my mind, an isochrone contour algorithm could just take the list of (point, cost) pairs as input, but marching squares requires a grid, so the code first creates that grid, using a fixed 100 meter cell size. If two buildings happen to map to the same square, the cost of one of them is used arbitrarily. It shouldn't matter much; it takes around 30 seconds to walk 100 meters, so the contour might be a little off by about that much.
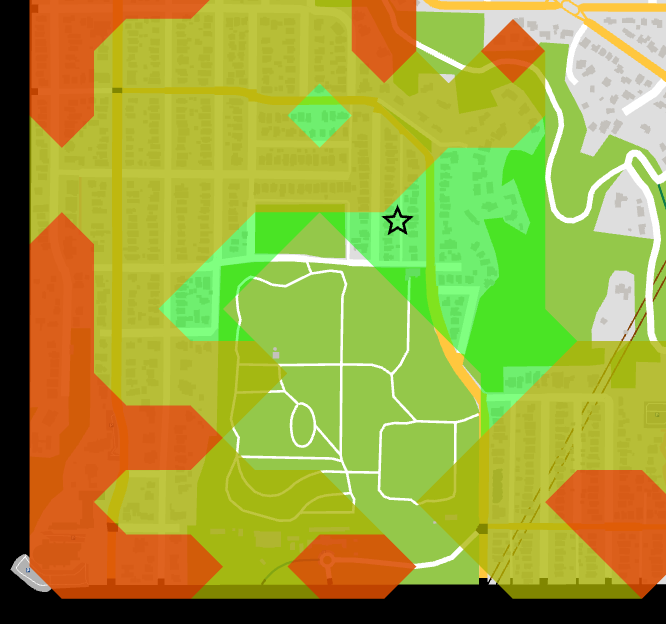
You can see some gaps in the middle of the park. Because there are no buildings in the middle, the grid cell has 0 cost in there. There's probably some better approaches to calculating isochrones.
Finding the perfect home
The tool also has a feature that lets you mark what categories of amenities you care about, then it finds houses within a 15 min walk of all of those. Its implementation is laughably brute-force. For each of the categories, it finds all stores matching that category, then does the Dijkstra's floodfill from each of those buildings. An obvious speedup here would be to perform Dijkstra's just once for each category and insert all of the stores into the priority queue as starting nodes.
15-minute Santa
Created by Dustin Carlino, Yuwen Li, & Michael Kirk
15-minute Santa is a game where you deliver presents across Seattle. You earn more points delivering to high-density housing, and you need to refuel from shops, so you'll have to understand where people live in relation to where they work and shop.
Contact dabreegster@gmail.com with any feedback or file an issue on Github.
Play it
- Play online (slower and no music -- download below if possible)
- Windows
- Mac
- Linux
Unzip, then run santa.exe or santa. No mobile/tablet support, sorry -- you
need a keyboard.
FAQ
Why did y'all make this?
We normally work on A/B Street, a traffic simulation that lets the general public explore a future prioritizing more sustainable modes of transportation. All of the recent talk about 15-minute cities prompted us to explore how Seattle's zoning causes many people to live far from where they get groceries. After experimenting with a more serious tool to understand walk-sheds, we decided to spend a few weeks on something a bit more light-hearted.
Realism
The map of Seattle and location of shops comes from OpenStreetMap. We only consider shops if they sell food or drinks -- let us know if the map seems to be missing your favorite restaurant. The number of housing units is based on Seattle GIS data. Mixed-use buildings with both commercial and residential units aren't represented. The game lets you upzone any house to place a new store; obviously this is a vast simplification of how complex a real conversation about changing zoning codes should be.
We rigorously evaluated the speed and carrying capacity of different cargo bikes and sleighs on the market to tune the vehicles in the game.
Modding the game
Native versions only -- sorry, not easy to do on the web.
You can adjust the difficulty of the levels or give yourself all the upzoning
power you want by editing data/player/santa.json. You first have to set
"enable_modding": true. The format should mostly be self-explanatory; also see
here
as a reference. If you break something, just delete the file to start over. If
you come up with a better gameplay progression, please share -- tuning a game is
hard!
Adding new maps
Missing your slice of Seattle, or want to run somewhere else? If you have a bit of technical experience, follow this guide and then the above instructions for modding the game. Otherwise, draw the map boundaries in http://geojson.io and send it to us along with a time limit, goal, and starting point on the map. If you have a public data source for the number of housing units per building, please include it!
Low-traffic neighborhoods
Launch the tool in your web browser
This free tool lets anybody study existing and proposed low-traffic neighborhoods (LTNs). Experiment with modal filter placement, and examine the impacts on drivers trying to cut through residential areas.
The software runs faster if you install it. No mobile/tablet support. Unzip,
then run ltn.exe or ltn.
Contact dabreegster@gmail.com with any feedback or file an issue on Github.
Use this in your area
A number of individuals and campaign groups have been using this tool around Islington, Brighton, Hyde Park, Nottingham, and Lyon. Bristol City Council has used it in a public consultation to co-design a liveable neighbourhood with residents.
Want to start doing the same in your area? You can use the downloadable version and import an area yourself. If you want help, or if you want to deploy the tool for a consultation or campaign, please email dabreegster@gmail.com. Users will be able to anonymously upload and share their proposals.
Videos
How modal filters affect shortcuts and cells:
How filters affect driving routes:
Credits
Main team:
- Dustin Carlino: project lead
- Madison Wang: UX design
- Cindy Huang: UX design
- Jennifer Ding: training material and outreach
Alumni from A/B Street (the LTN tool is built upon past work):
- Michael Kirk
- Yuwen Li
None of this work would be possible without OpenStreetMap contributors.
Inspiration / early testers giving great feedback:
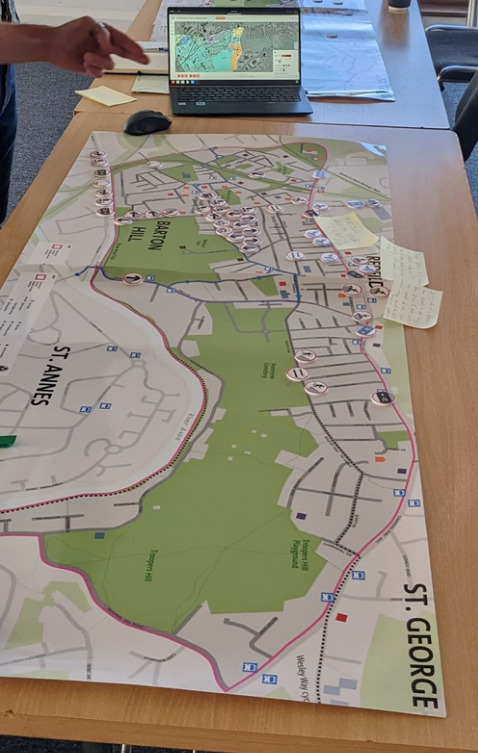
- This tool was initially inspired by Brian Deegan's workshop on LTN planning. We want to involve communities in planning local schemes, and get everybody collaborating to solve the same problems.
- Cyclestreets LTN map using OpenStreetMap
- Will Petty's QGIS tool
- Sustrans LTN guide
- Design help from Duncan Geere and Fernando Benitez
- Robin Lovelace
- Many others...
This work was expanded from an initial prototype while Dustin worked at the Alan Turing Institute, where he's funded by the UKRI grant for the ASG program.
Concept art
Our hope is that this tool makes it easier for communities to come together and collaboratively design neighborhoods that work well for everyone. Special thanks to Scriberia for illustrating this idea:
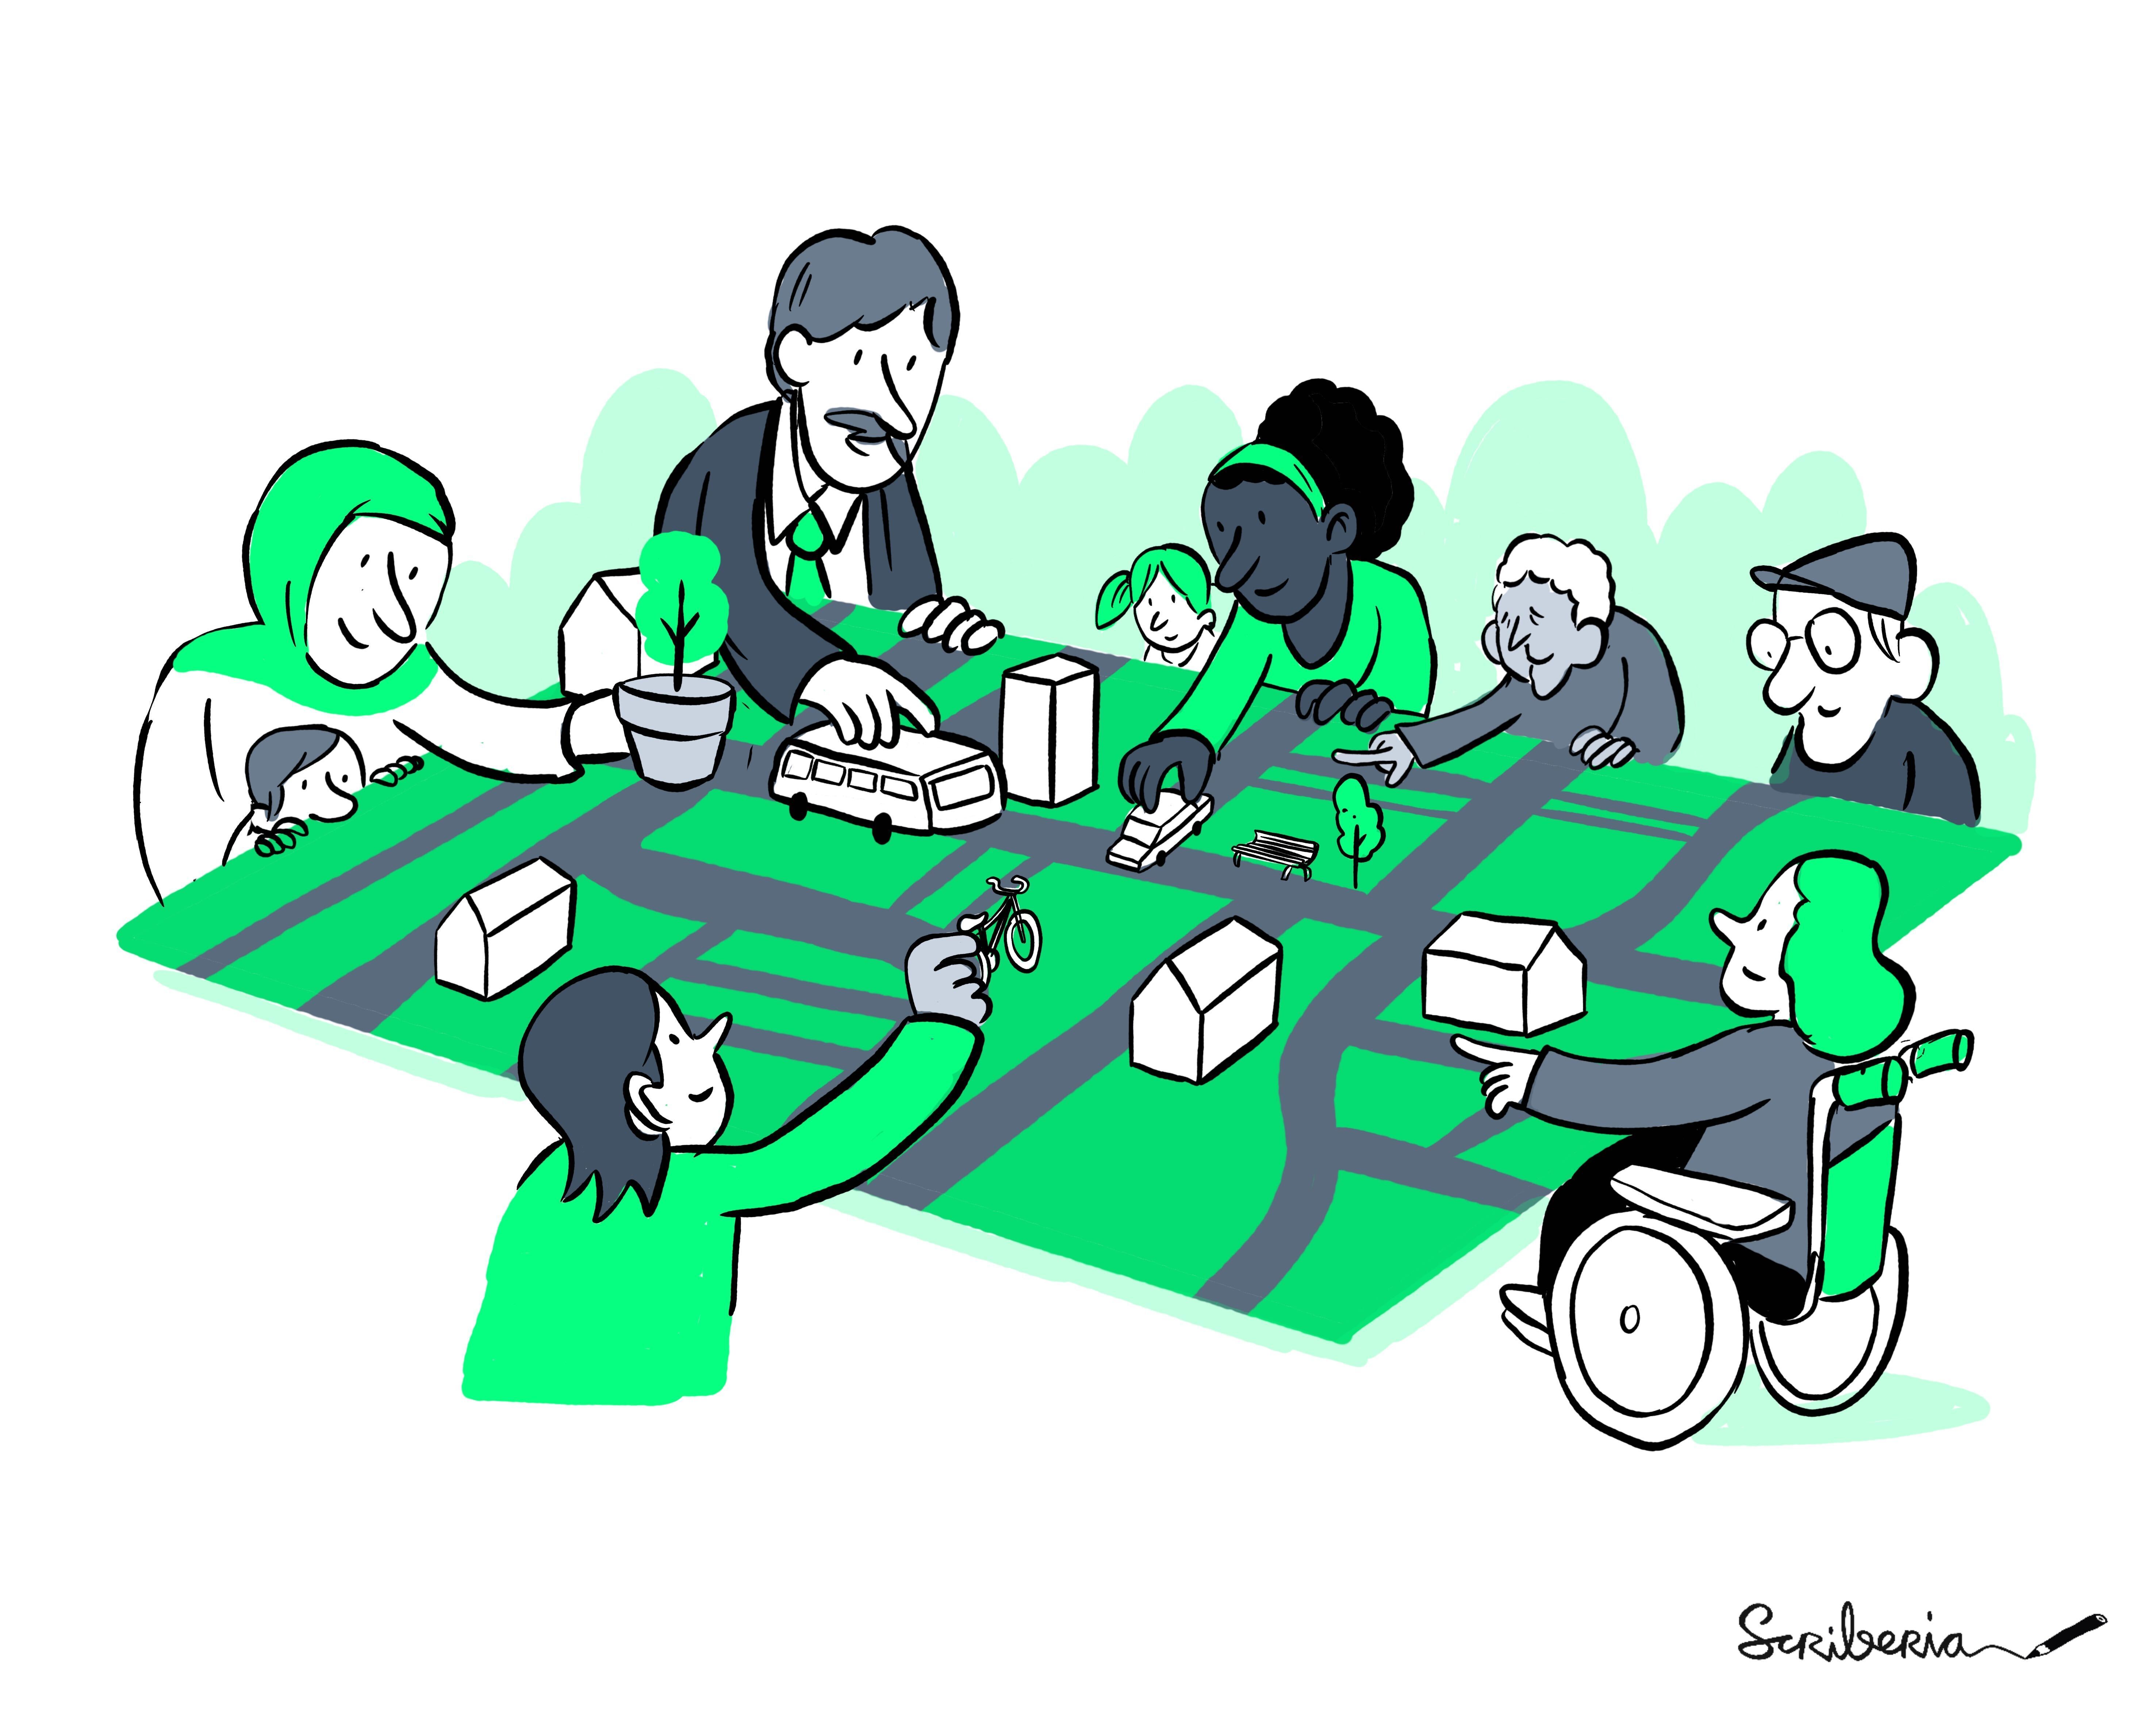
This image was created by Scriberia for The Turing Way community and is used under a CC-BY 4.0 licence for reuse. Zenodo. DOI 10.5281/zenodo.3332807
Documentation
- 2-minute introduction video
- 8-minute tutorial video
- Written user guide
- March 2022 AI:UK presentation
Features
- Editing
- Place new modal filters (including bus gates and diagonal filters)
- Switch the direction of one- and two-way streets
- Specify custom neighbourhood boundaries
- Create new unsignalized or signalized crossings
- Analyze
- Calculate likely shortcuts drivers may take through an area. Visualize individual paths and a heatmap of all traffic.
- Visualize whether filters successfully split an area into smaller cells, making a "water-tight" scheme free from shortcuts
- See how edits affect individual routes
- Based on crossings, see porosity between adjacent neighbourhoods
- Quickly get a sense of where traffic may detour outside the neighbourhood in the short-term, using travel demand models. Browse through individual example trips that change route due to edits.
- Collaborate
- Save proposed edits and quickly swap between multiple options, comparing them
- Upload proposals anonymously and share a URL
LTN technical details
Since the tool is in such an early stage of development, this is a mix of "how things work currently" and ideas for moving forwards.
Neighborhood selection
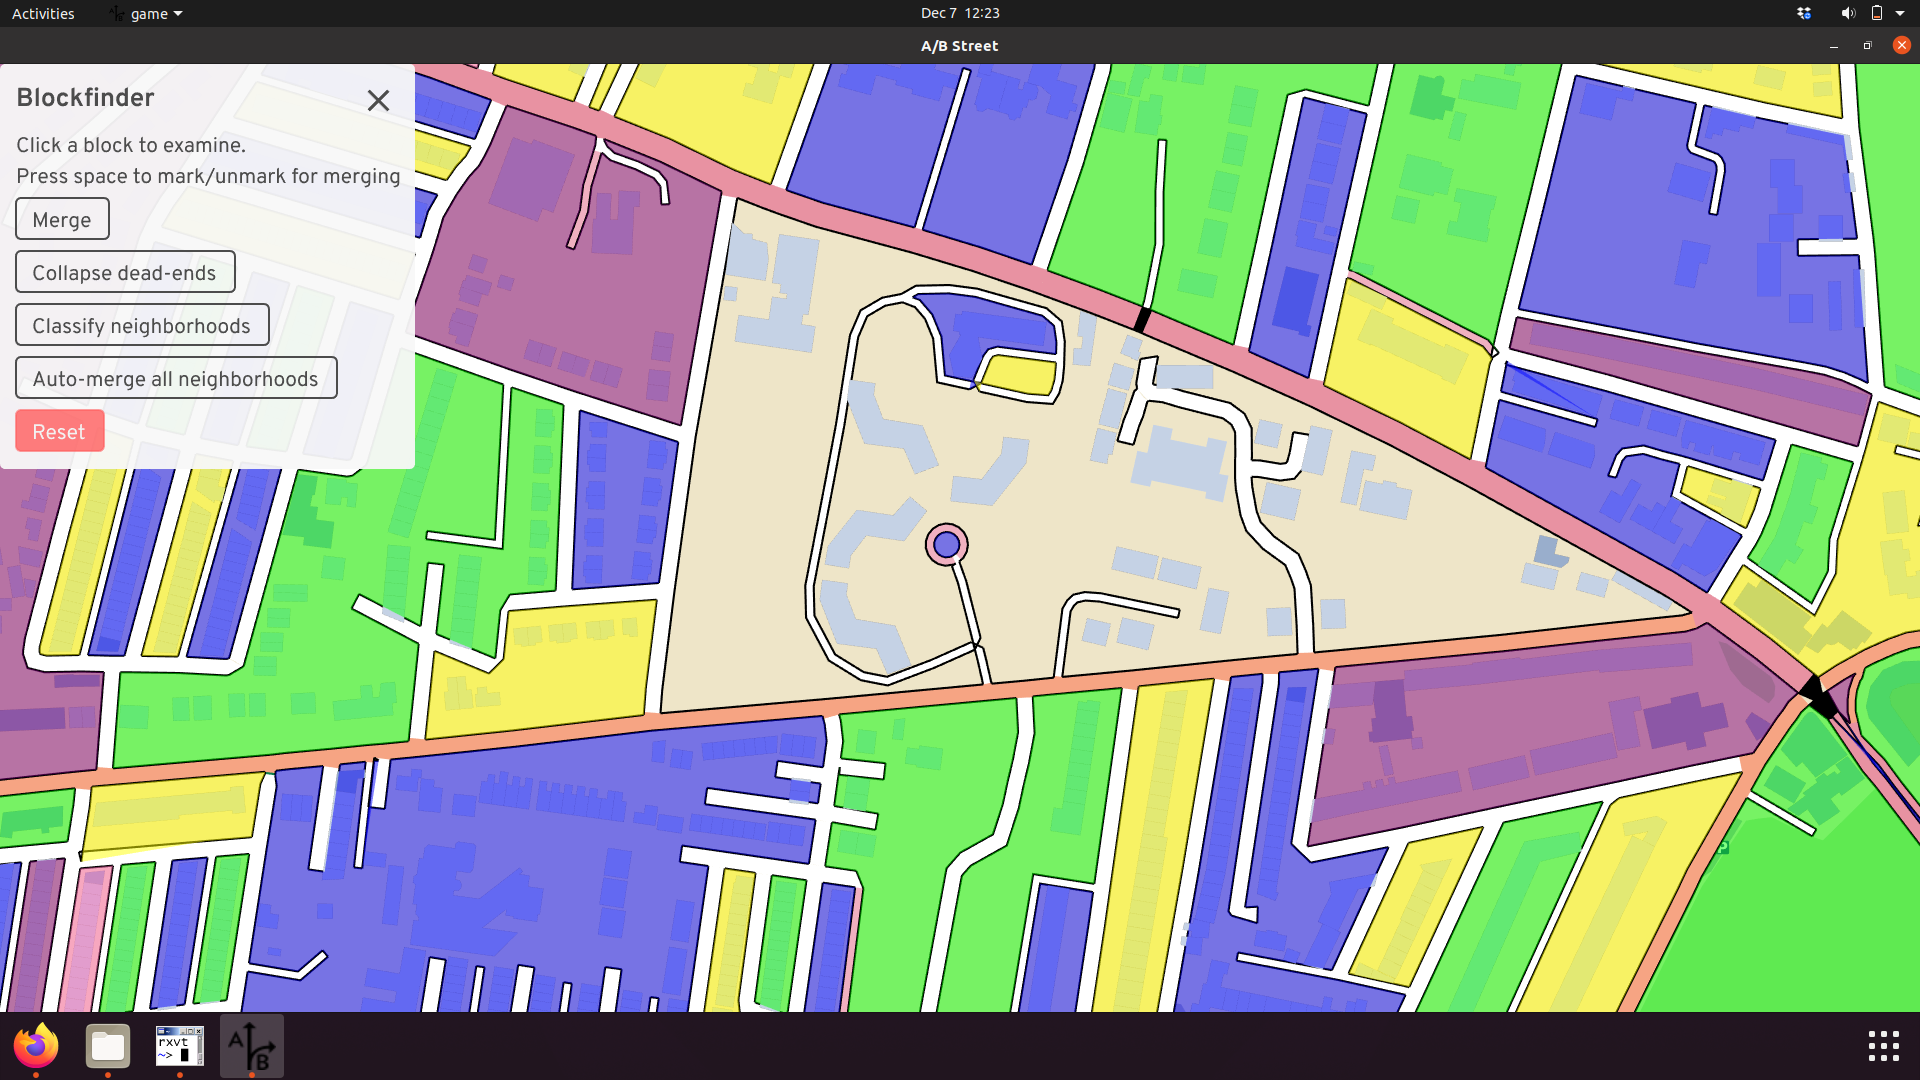
The software operates on a single "neighborhood" at a time. This is defined by a perimeter, which is a contiguous sequence of roads that form a loop, without any gaps in the middle. This separates the map into an "interior" and "exterior," with border intersections connecting the two.
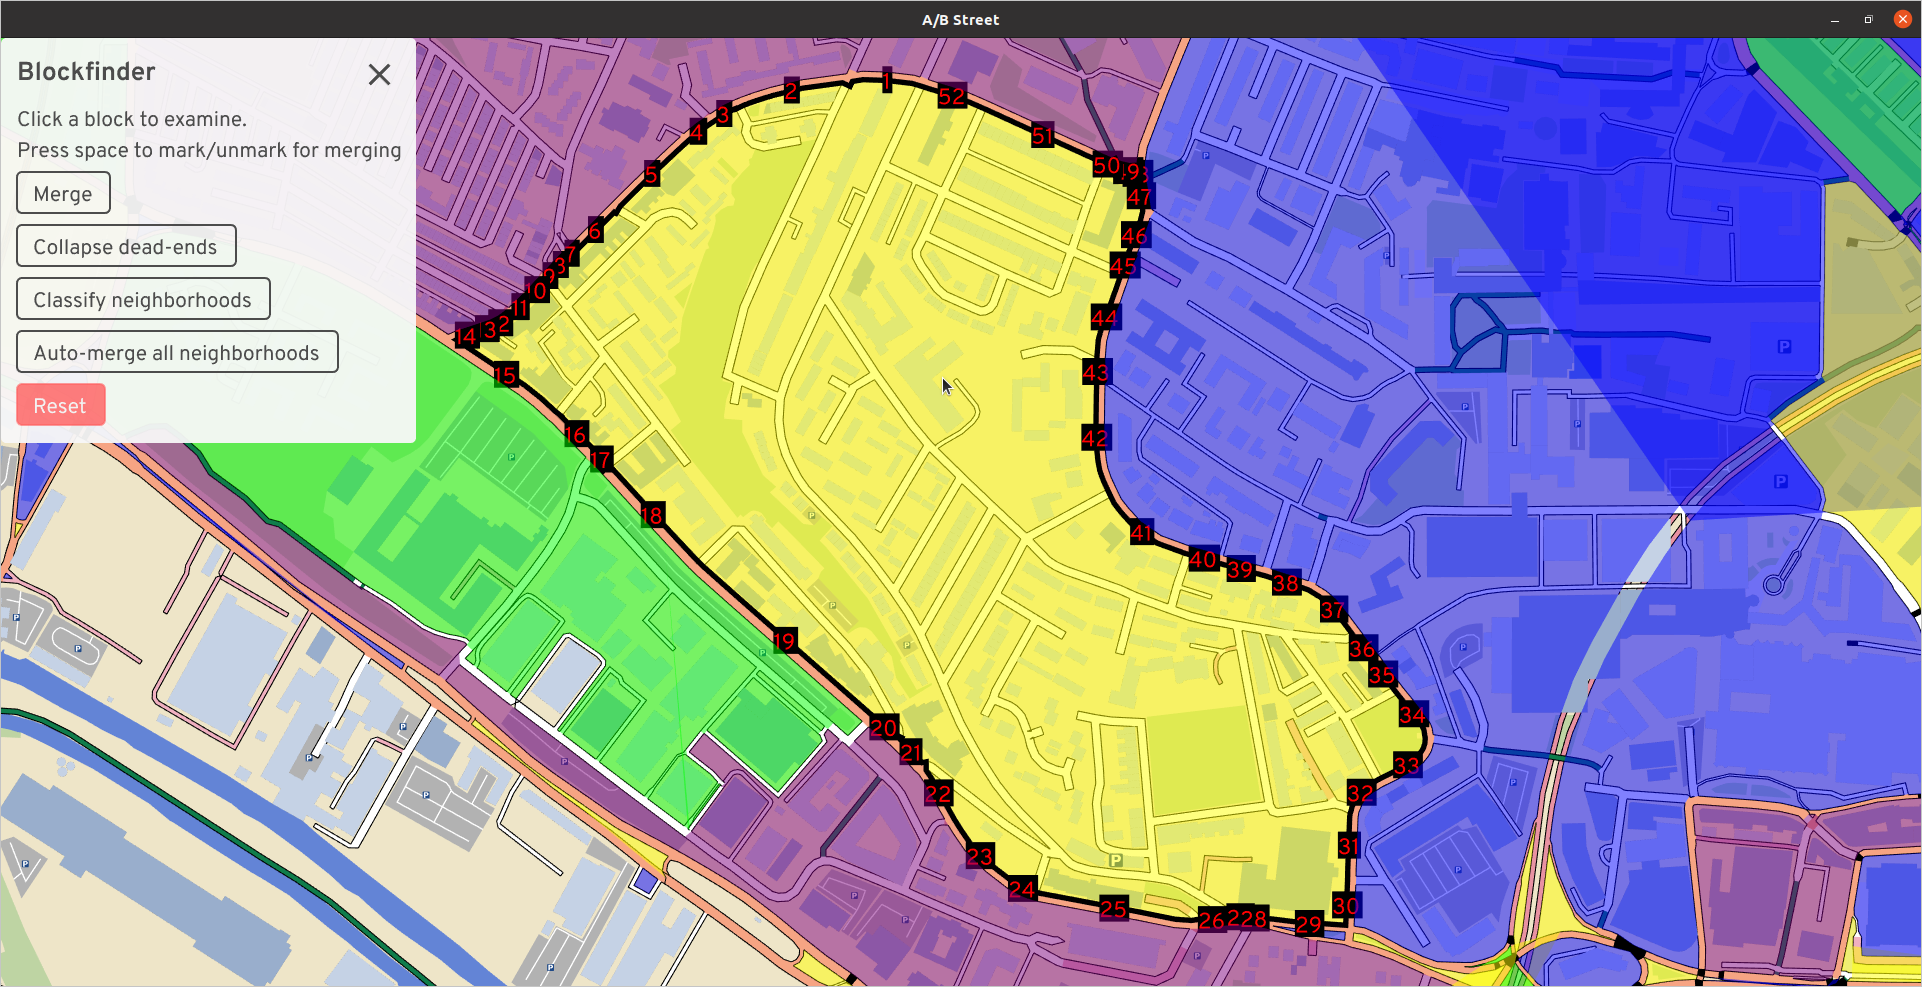
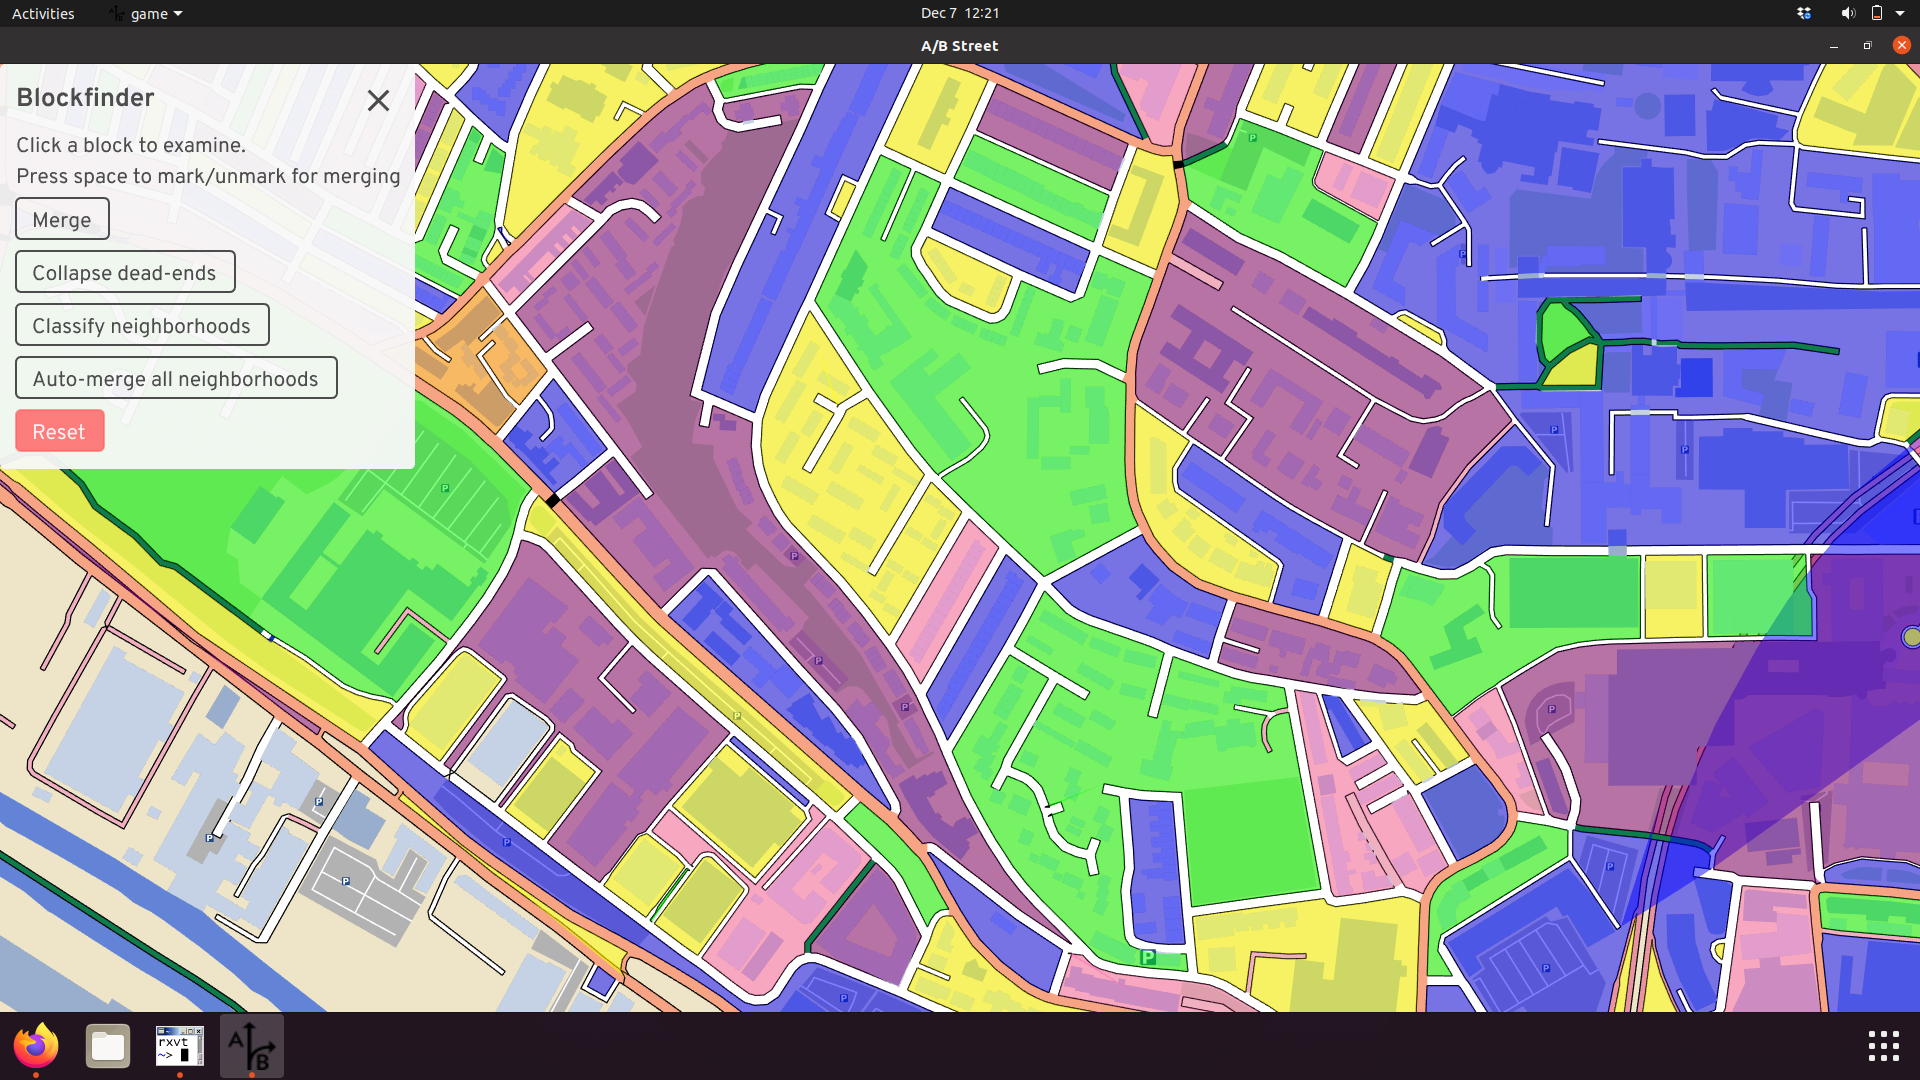
Internally, this is built up from individual "city blocks," that trace around an area without ever crossing the street.
Bugs
These underlying blocks have three major bugs currently. Some blocks are missing entirely, because of internal geometry problems trying to trace:
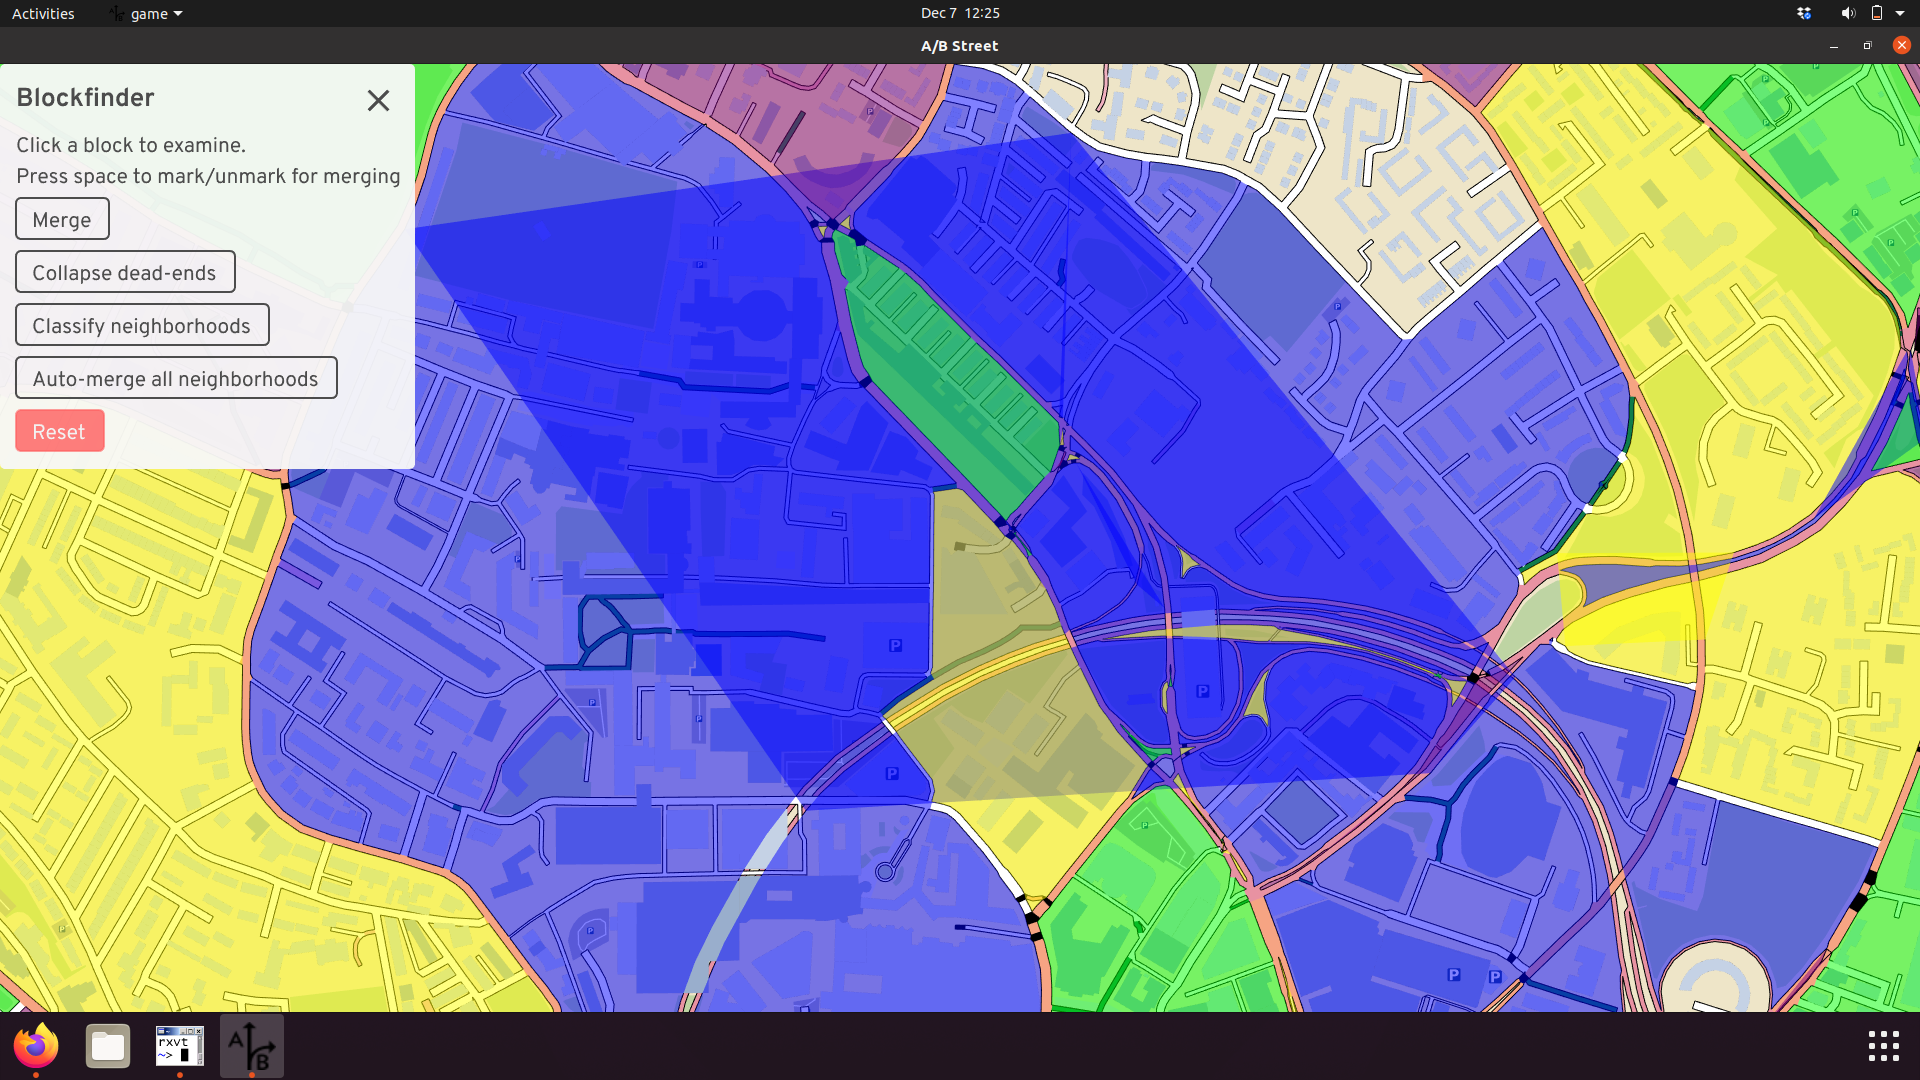
Bridges, tunnels, and train tracks can produce blocks that appear to overlap in 2D space:
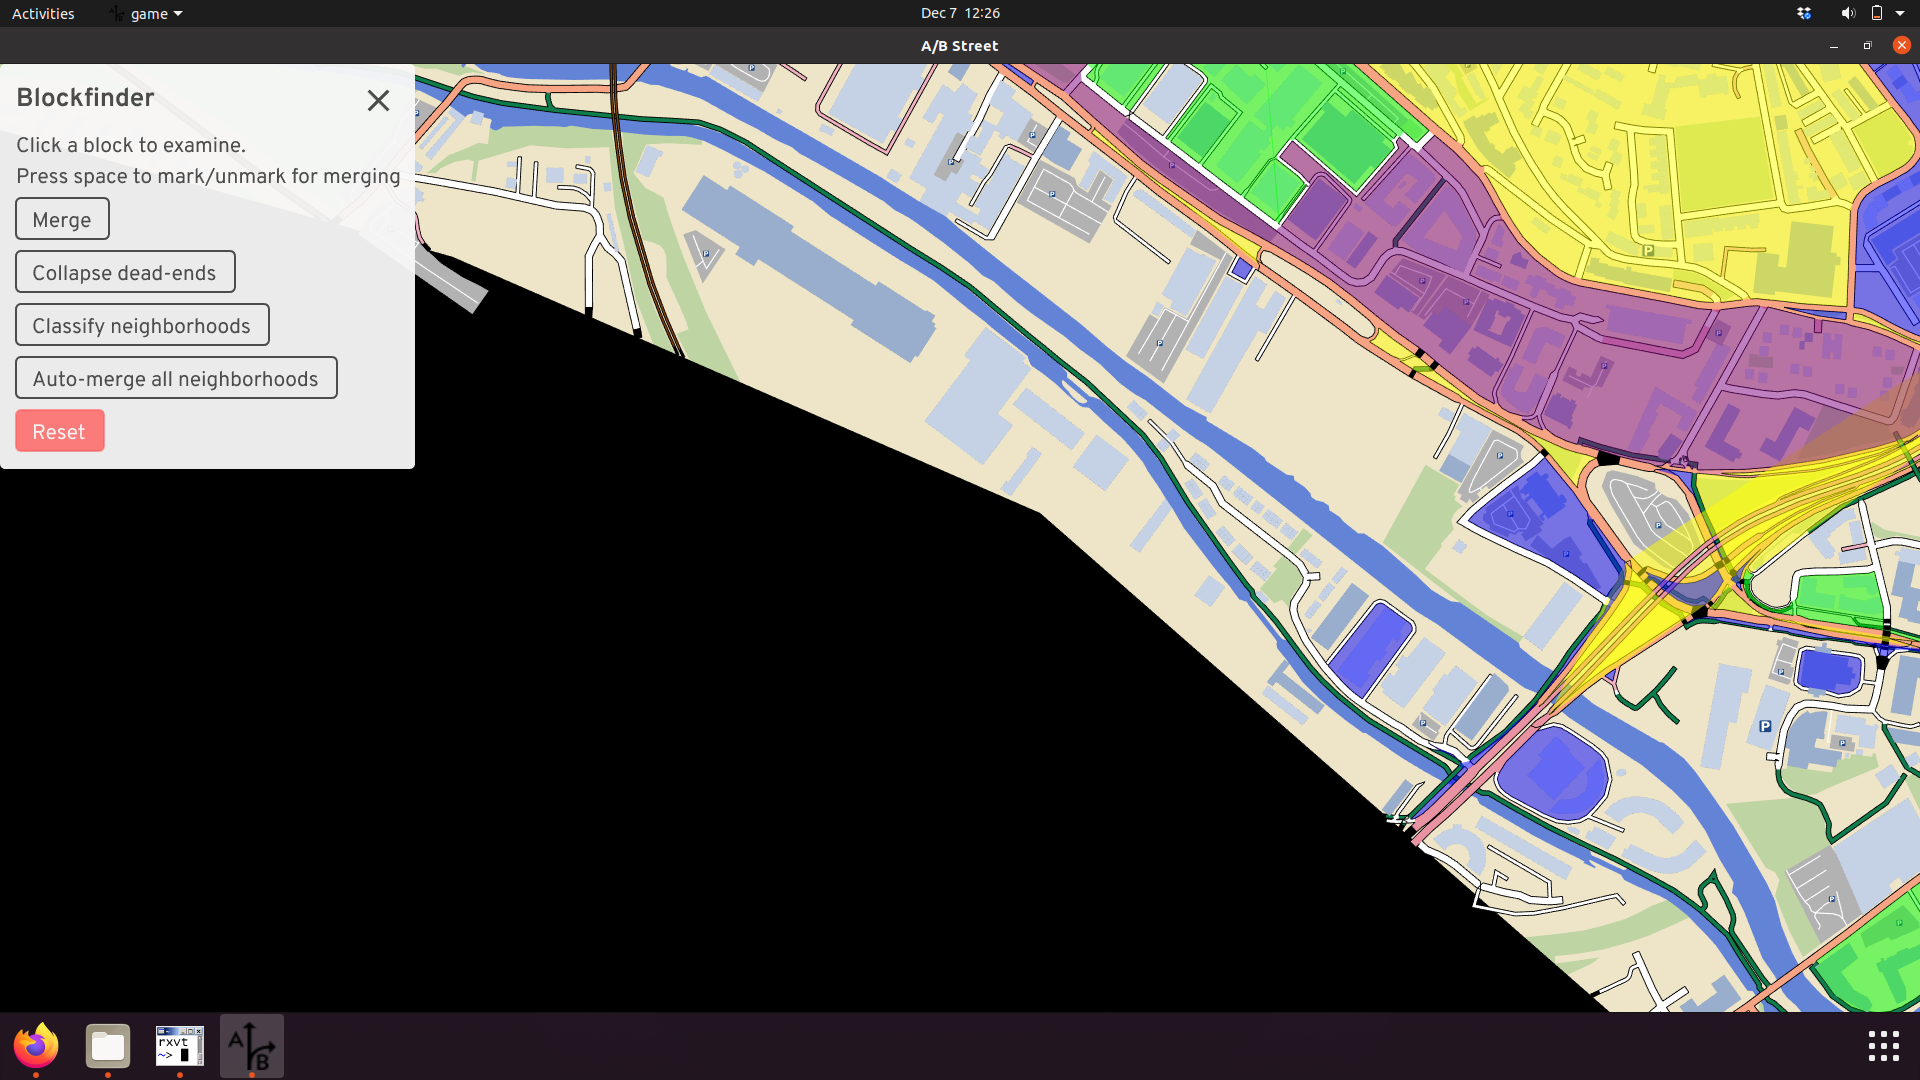
And we don't attempt to build blocks near the boundary of the map. If somebody wants to study that area, they should import a new map covering more of the area. We don't know what roads exist just outside the map, so it's not useful to do any analysis.
Next steps
We've heard overwhelming feedback that choosing the boundary of an LTN needs to be much more flexible. Sometimes the software's guesses are flat-out wrong, due to bugs, or improperly including large parks or lakes. Sometimes the major road classifications in OpenStreetMap are inappropriate. And often, there are parties interested in more ambitious schemes to "merge" two LTNs or create large ones. We don't want the software to be prescriptive at all in this selection of boundary road; people know best. So the plan is to allow for drawing custom boundaries. To speed things up, we can also improve the built-in heuristics for partitioning neighborhoods and let people select which OpenStreetMap highway types should count as a "major" road.
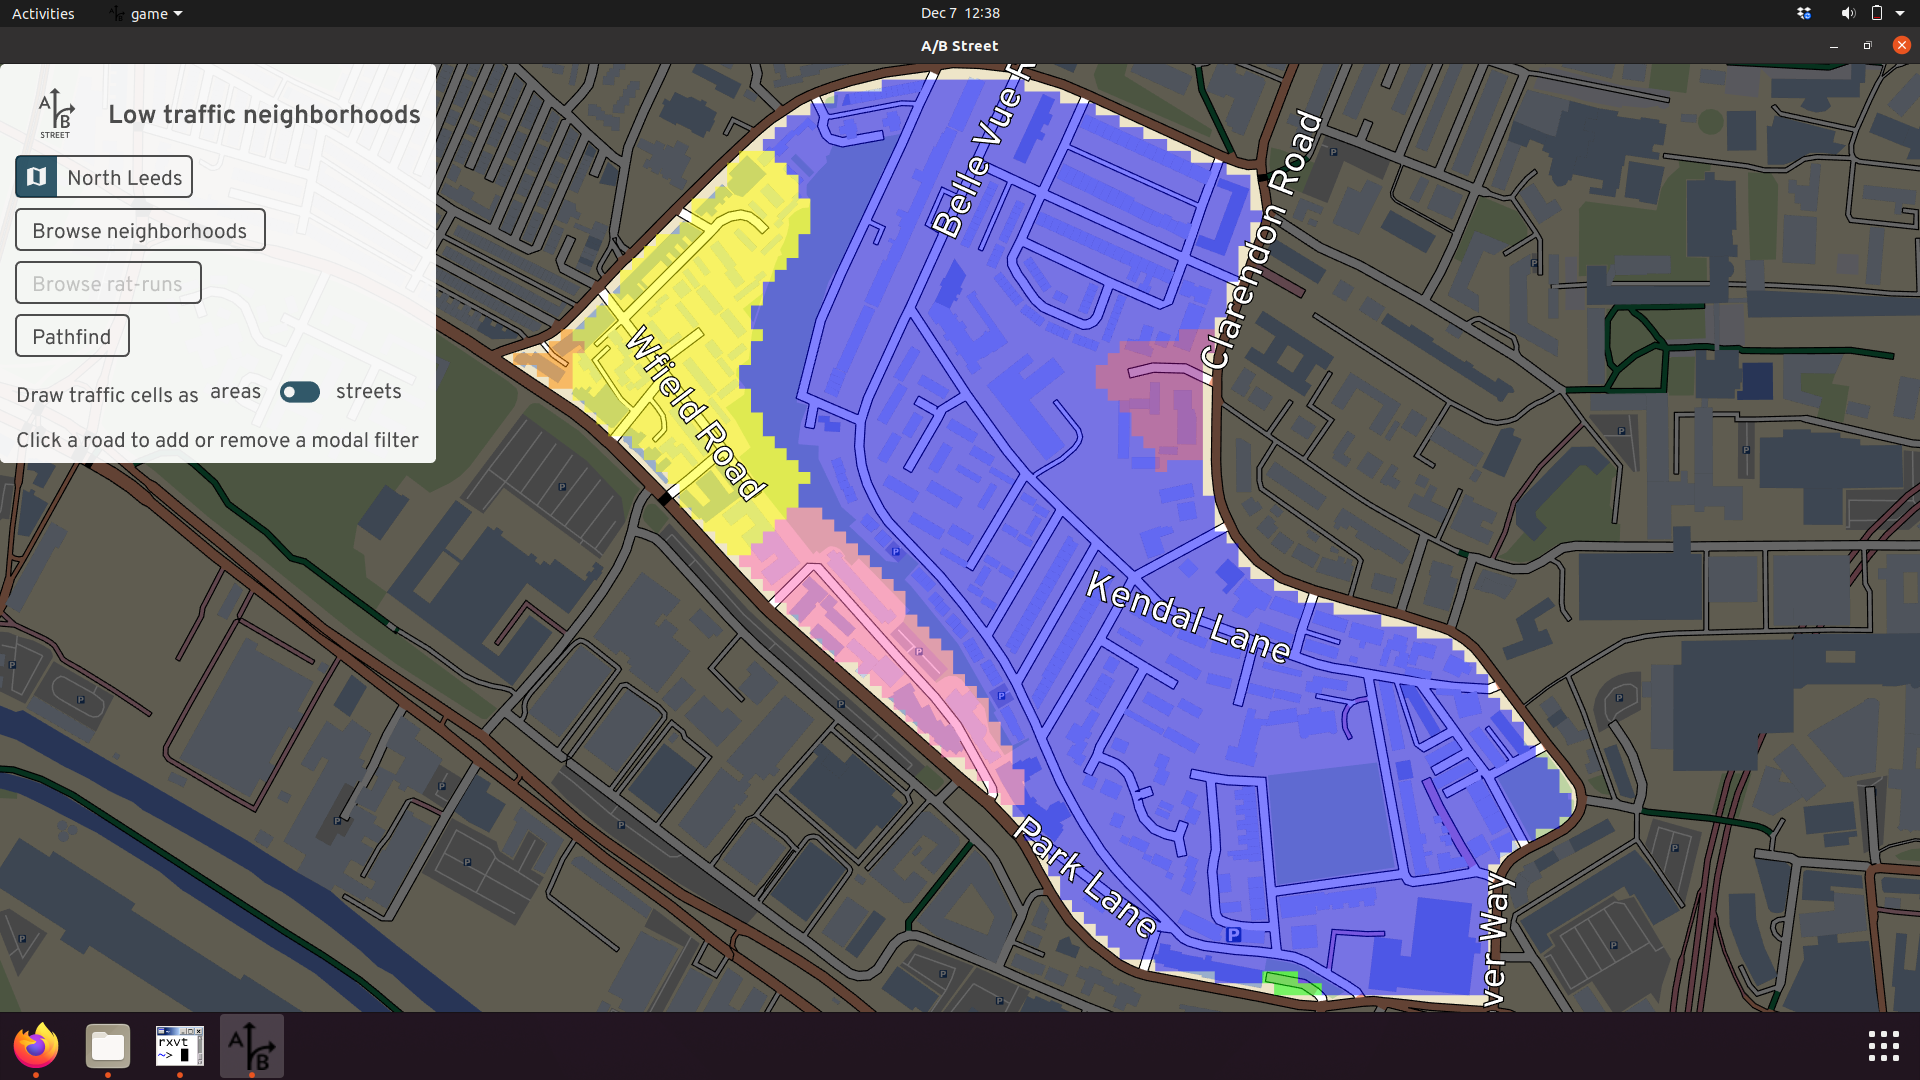
Cell connectivity
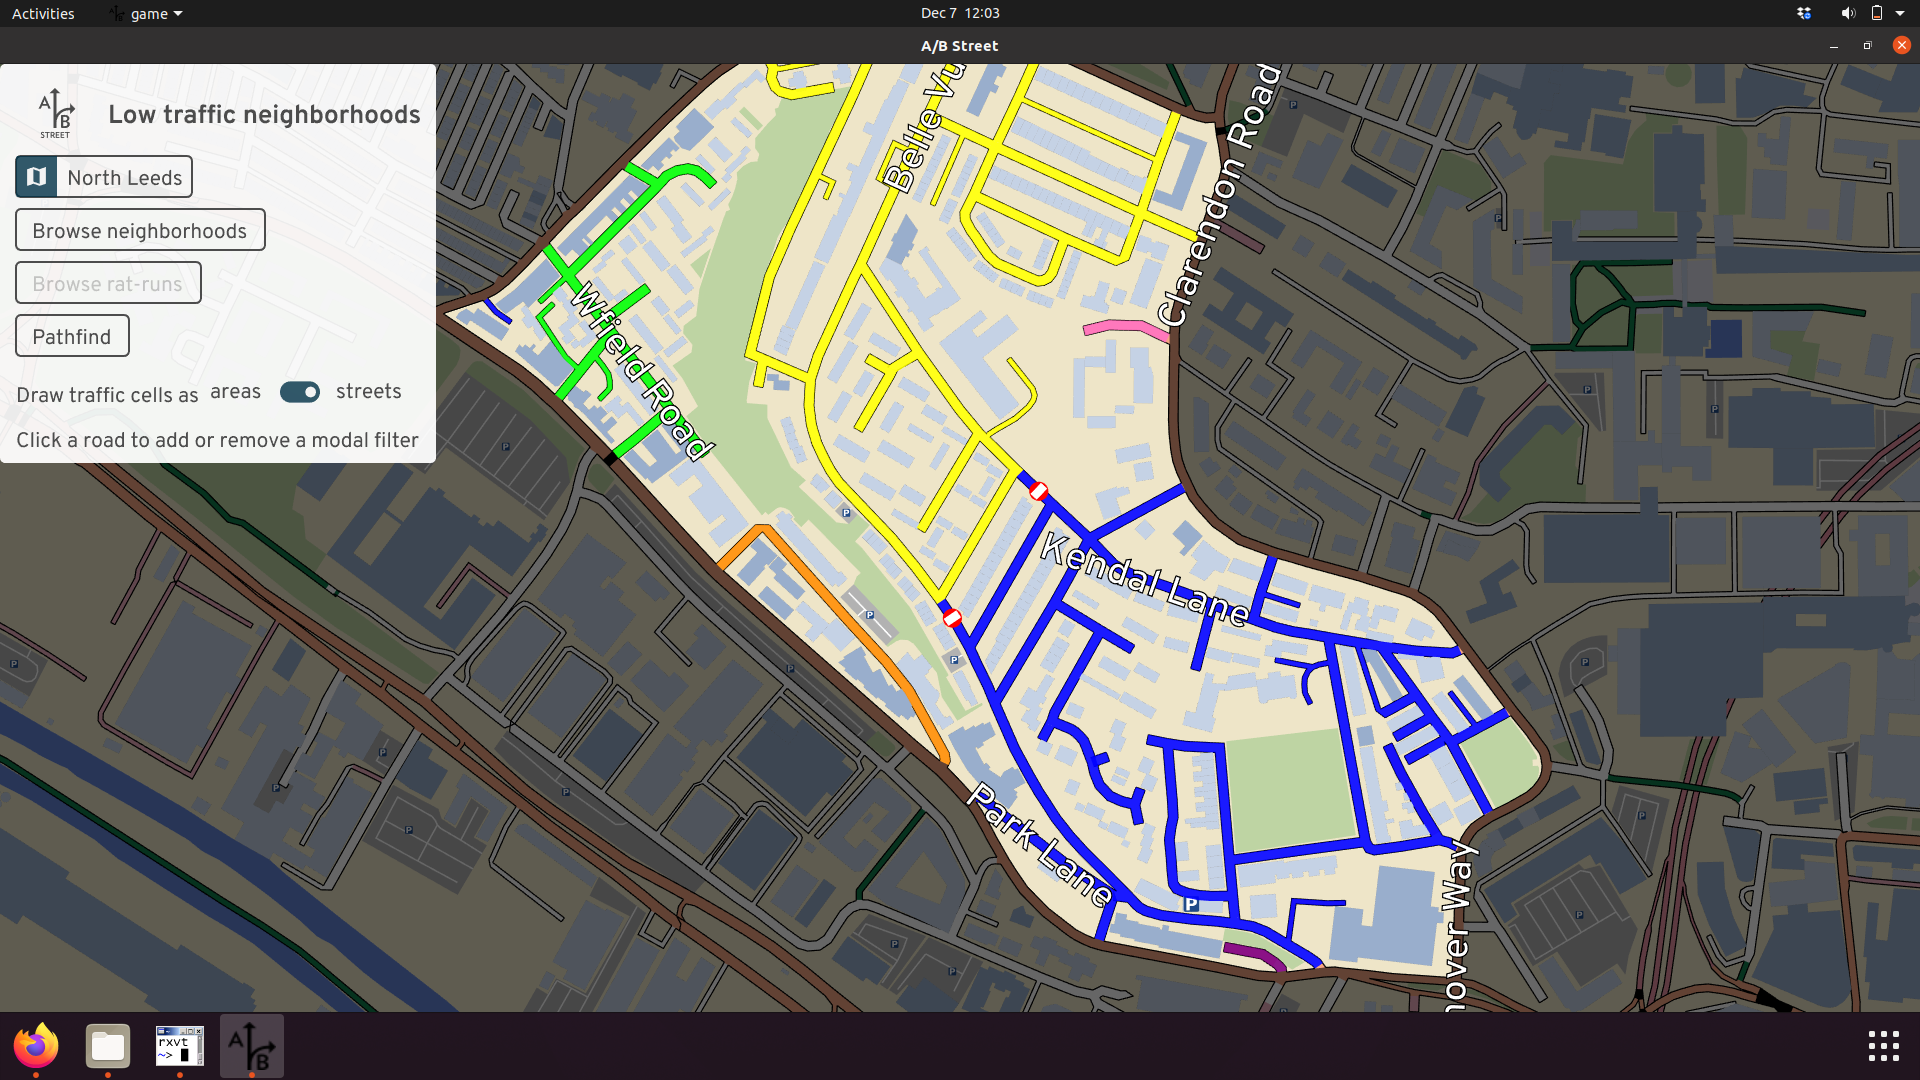
After picking a neighborhood, the tool groups all of the interior streets by connectivity for motor vehicles. Within each "cell," a driver can reach all streets without using a perimeter road. How does this work? Start from any interior street, and "flood" out from that start position to find all reachable streets. Don't search past perimeter roads. That's a cell. Repeat until all interior streets have been visited. The reachability is based on motor vehicle constraints, so streets classified as pedestrian- or bike-only and new modal filters can't be crossed.
Initially, a neighborhood might be split into a few cells:
That blue cell is quite large, so drivers may be tempted to cut through to avoid queues along the perimeter. Let's add a filter to stop them:

The cells didn't change, because there's a parallel street that's still open. Adding a filter to just one street might not work -- drivers can just detour to the other option. Let's fix that.
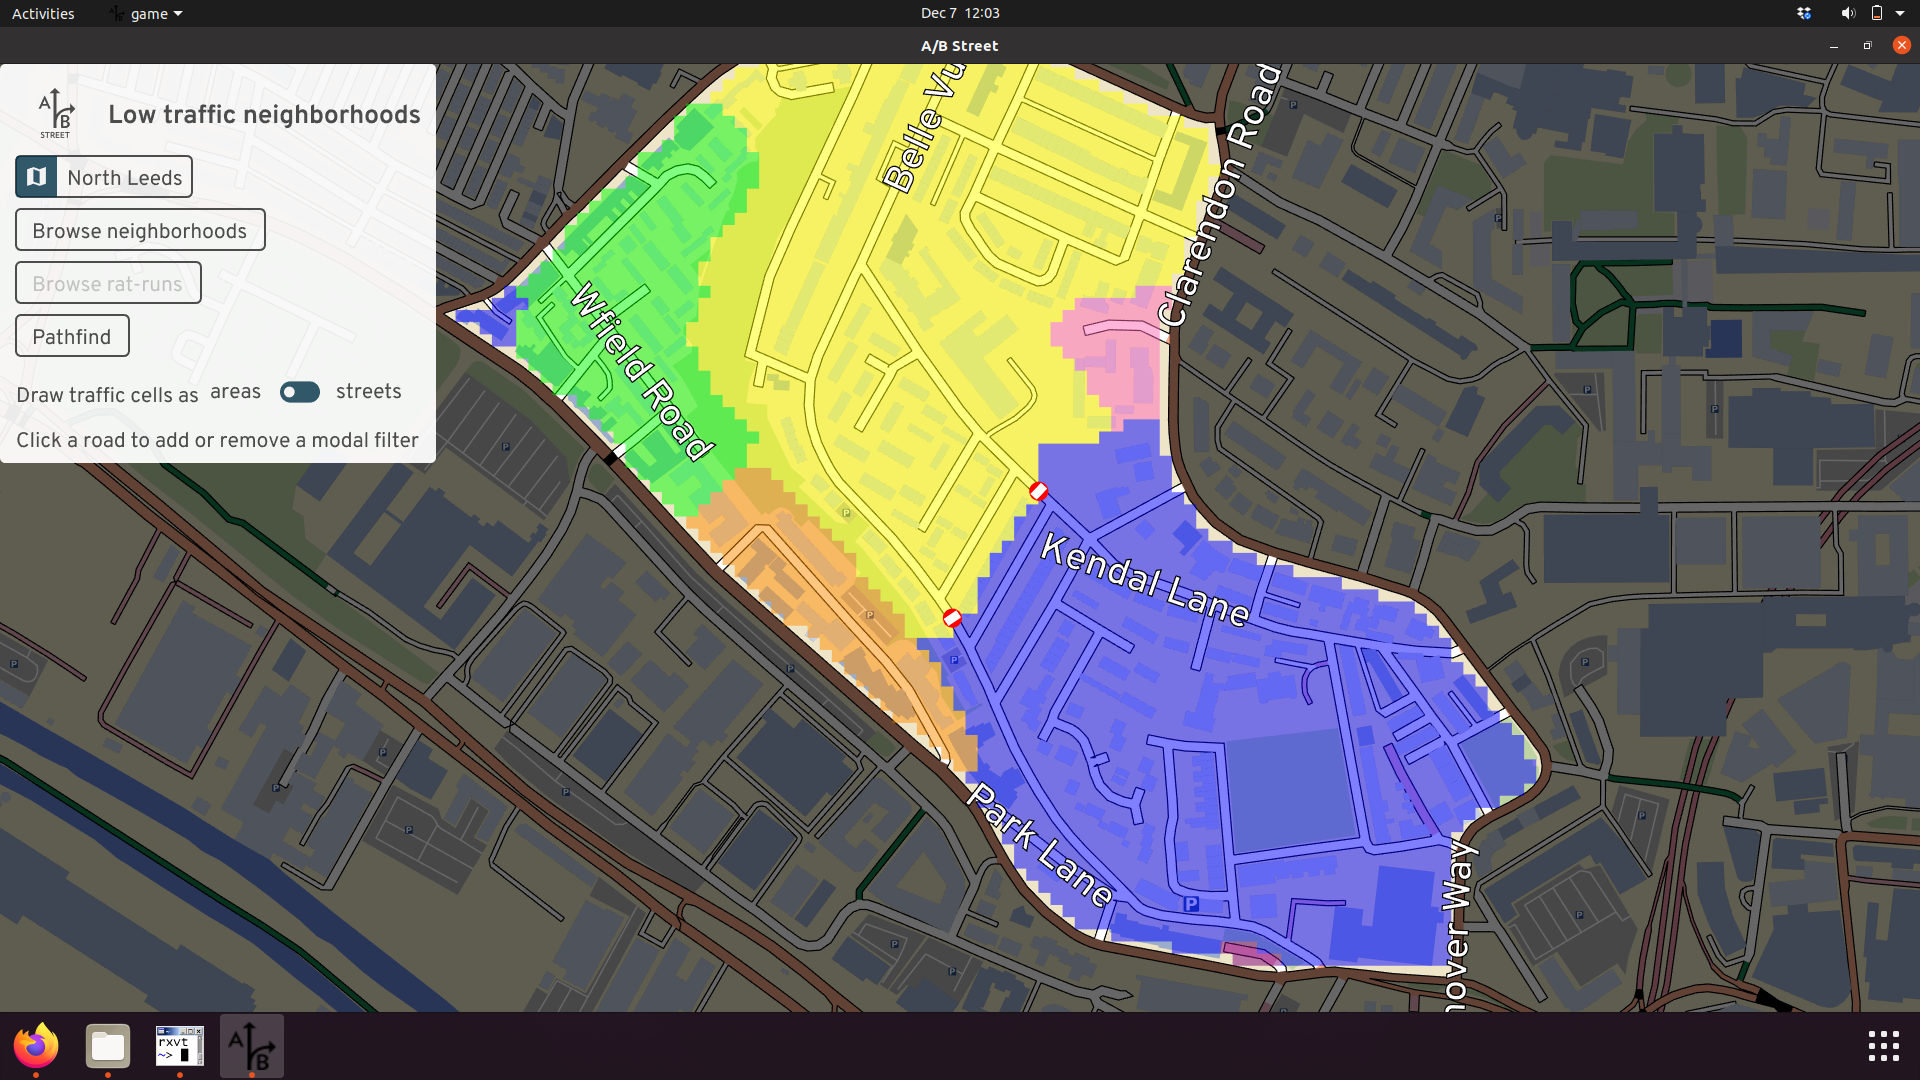
Now the blue cell is split into a yellow piece; the two aren't connected anymore. The scheme is now "water-tight."
The cells are visualized as colored areas, inspired by many example LTN diagrams floating around. But if that's confusing, you can just color the cells by street instead:
The colors aren't meaningful; they're just meant to show different cells. There may be cases when two adjacent cells have the same color, but they're not connected -- that's just a bug we're working on.
Routing
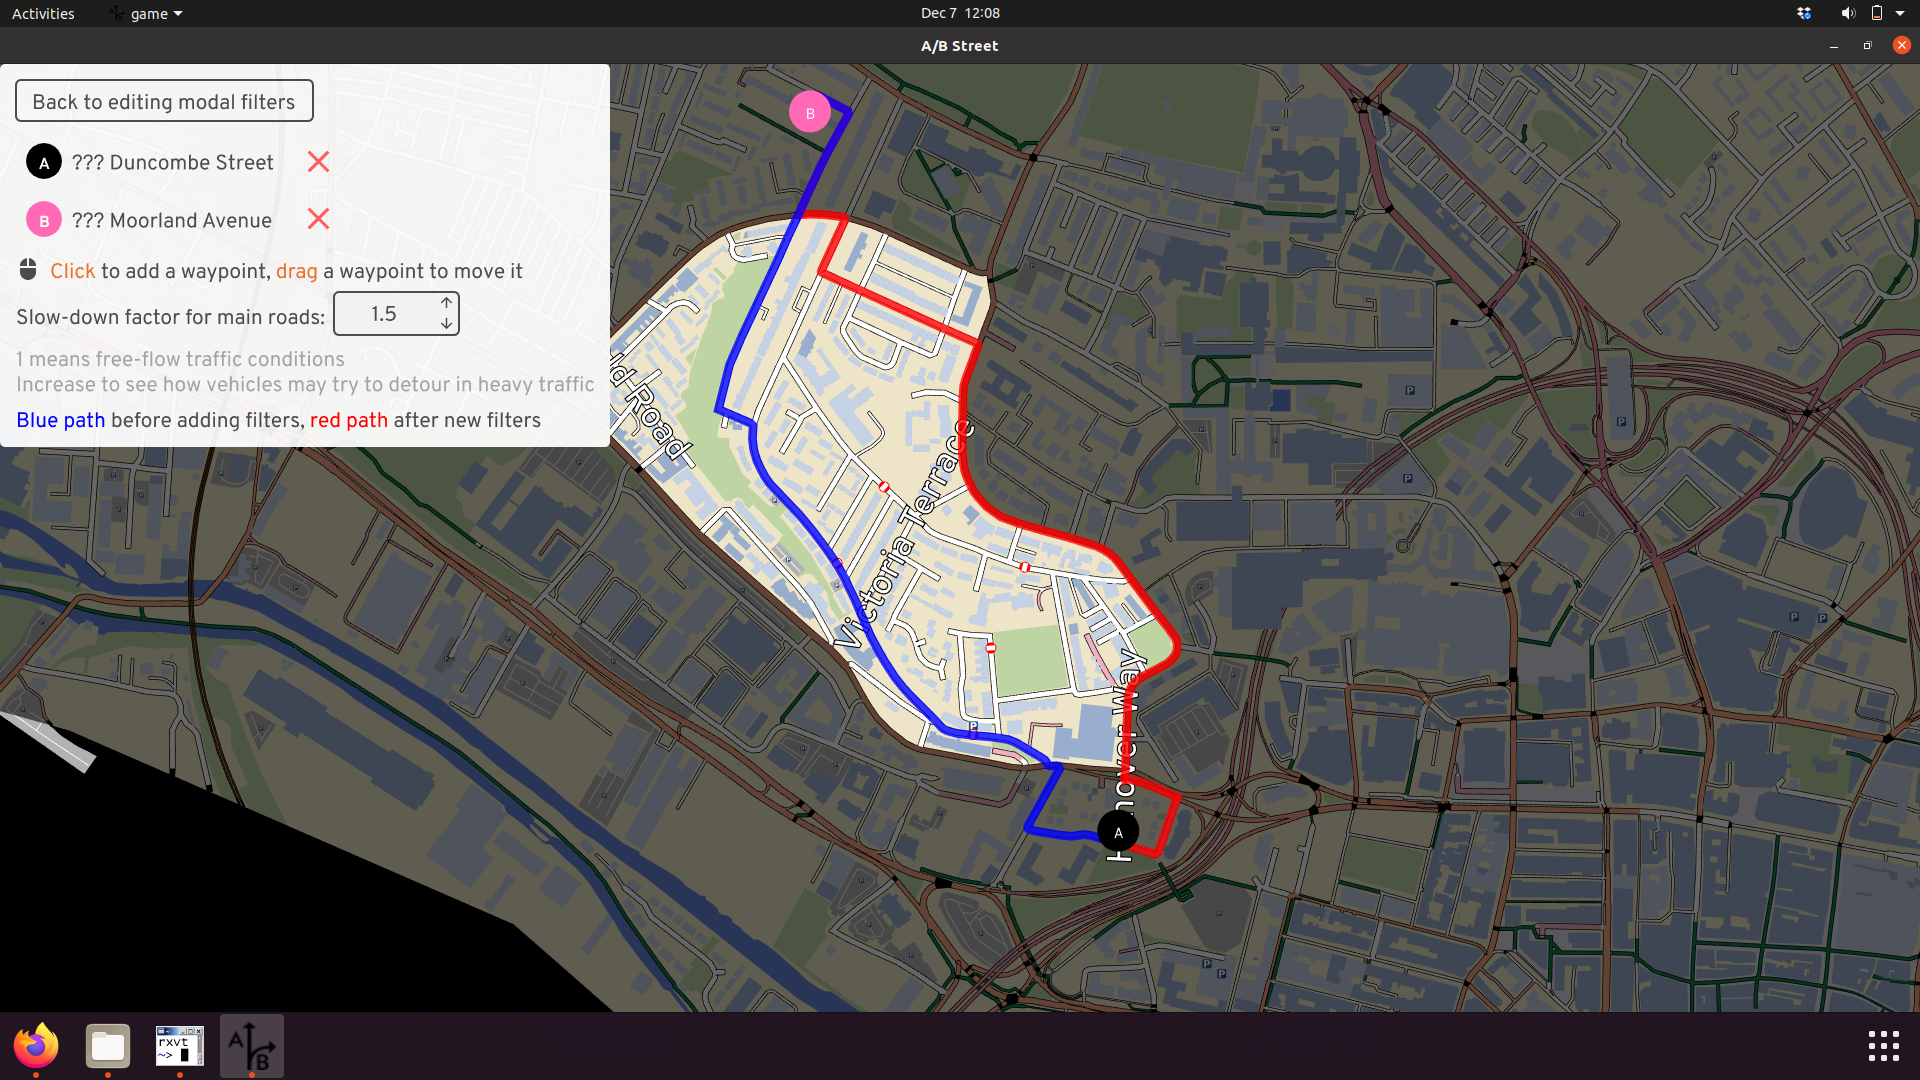
There's a pathfinding tool to see how driving routes will interact with a neighborhood. The pathfinding itself performs a standard graph search, respecting any turn and lane restrictions defined in OpenStreetMap. The cost function, expressed in units of duration, is the distance divided by the speed limit. For drivers, there's just one extra penalty that normally applies -- unprotected right turns (in the UK) from a smaller to a larger road. This penalty is fixed at 30 seconds currently.
According to this cost function, often the optimal route for a driver doesn't even pass through a neighborhood. Major roads tend to have higher speed limits in OpenStreetMap, so their cost is lower. This may not match reality -- during peak hours, main roads might have long queues, and a driver armed with satnav could try to cut through a neighborhood. So there's a toggleable slowdown factor for main roads, which just multiplies the cost.
Here's an example of the results. With a slowdown factor of 1.5x, the blue route shows that drivers might try to cut through this neighborhood. After we add some modal filters, the blue route becomes impossible, and the driver is likely to try the red route instead -- which actually cuts through the neighborhood on the north end, because we haven't added filters there.
OpenStreetMap viewer
- Web version
- To run locally, get the
latest release for Windows,
Mac, or Linux. After unzipping, run
osm_viewer.exeorosm_viewer.
A separate tool that visualizes OpenStreetMap data, with details on lanes, turn restrictions, parking lot capacity, and road width. It's also very convenient to explore the raw attributes on roads. The OSM Connect 2020 talk talks about possible directions for this viewer.
Mapping on-street parking in OpenStreetMap
This guide assumes you've edited OSM before. Contact dabreegster@gmail.com if you have any trouble. Also give me a heads up when you make some edits, so I can regenerate the maps!
- Install A/B Street
- Choose Contribute parking data on the main screen
- Change the map if you'd like to focus somewhere in particular
- Click a road with unknown parking
- Select what kind of on-street parking the road has
- Repeat
- Click Generate OsmChange file
- Upload the diff.osc file by adding a layer in JOSM (or send it to me)
Like all edits to OSM, to figure out ground-truth, you can survey in-person or use Bing Streetside. Do not use data from Google Maps to edit OSM.
FAQ
Why?
I'm trying to build a realistic traffic simulation of Seattle using OSM data, then use it to strengthen proposals for pedestrianized streets, improving the bike network, and mitigating the West Seattle bridge closure. A/B Street is only as good as its data, and parking is one of the biggest gaps. Missing data means unrealistic traffic as vehicles contend for few parking spots, and roads that look much wider than they are in reality.
Why put this data in OSM?
Why can't I just grab parking data from SDOT's map, using the blockface dataset? Well, I'm trying -- when you see a parking lane in the tool, it's coming from blockface, unless that road in OSM is tagged. But the blockface dataset is comically wrong in many places -- for example, the Montlake bridge apparently has unrestricted parking?! King County GIS has confirmed the dataset isn't meant to be used for this level of detail.
Plus, if the data is in OSM, anybody else can make use of it.
How does the tool work?
A/B Street attempts to render individual lanes and intersections from OSM data. This makes it useful to audit the lane tags in OSM, including parking:lane. The tool tracks your edits and when you generate the OsmChange file, it grabs modified ways from the OSM API to generate a diff. You can inspect the diff, load it in JOSM, and upload.
Your changes won't immediately be reflected in A/B Street. Let me know when you've done some amount of mapping, and I'll regenerate the maps from fresh data.
Why use this tool?
You don't have to; this tool or ID or JOSM all work. But the UI is clunky for this specific purpose. (Also, if you find this tool clunky in any way, let me know and I'll fix it.) There's also a proposed StreetComplete quest.
What about parking restrictions?
There are many parking:lane tags to indicate restricted parking zones, time restrictions, etc. Feel free to map that in ID or JOSM, but I'm just looking to make a first pass over a wide area.
What about off-street parking?
Ideally I'd also like to know how many private parking spots are available to residents of each building. But I don't know of an OSM schema for mapping this, or a practical way to collect this data. Let me know if you have ideas.
What about long roads where parking appears and disappears?
The tool won't help. Use your favorite editor to split the way when the lane configuration changes. Also feel free to just skip these areas.
How to coordinate with other mappers?
If somebody wants to set up HOT tasking, that'd be great, but I don't expect so many people to jump on this.
I noticed weird roads in the tool
Welcome to my world. ;) If the number of lanes seems wrong, select the road and check the OSM tags. I'm inferring lanes from that. Feel free to make manual OSM edits to fix any problems you see. (I'd like to extend this tool to make that easier; let me know if you have ideas how to do this.)
I want to map an area, but there's no option for it
To keep the release size small, I'm not including all maps yet. Let me know what you'd like to see included.
Or if you have a .osm file, try the quick start guide.
User guide
Please file a Github issue or email dabreegster@gmail.com if you encounter any problems.
Installing A/B Street
You can run A/B Street directly in your web browser. It's slower and there are some limitations compared to installing locally.
Grab a pre-built binary release:
- Windows
- Unzip the folder, then run
play_abstreet.bat. If you get a warning about compressed files, choose to extract -- you can't run from the .zip directly. - If you get a "Windows protected you" security warning, click "more info", then "run anyway." We don't sign the release yet, so A/B Street shows up as an unknown publisher.
- Unzip the folder, then run
- Mac
- Unzip the directory, then run
play_abstreet.sh. - If you get an error about the developer unverified, follow this. Help needed to start signing the release!
- If that just opens a text file, then instead open terminal,
cdto the directory you just unzipped. Then do:cd game; RUST_BACKTRACE=1 ./game 1> ../output.txt 2>&1 - Help needed to package this as a Mac .app, to make this process simpler
- Unzip the directory, then run
- Linux
- Unzip the directory, then run
play_abstreet.sh, e.g. with the following commands
- Unzip the directory, then run
cd ~/Downloads
wget https://github.com/a-b-street/abstreet/releases/download/v0.3.49/abstreet_linux_v0_3_49.zip
unzip abstreet_linux_v0_3_49.zip
cd abstreet_linux_v0_3_49
./play_abstreet.sh
- For a video illustrating this and more detailed instructions on installing the tool on Linux, see here.
- FreeBSD, thanks to Yuri
Or you can compile from source.
Common issues
If the size of text and panels
seems very strange, you can
try editing play_abstreet.sh or play_abstreet.bat and passing
--scale_factor=1 on the command line. This value is detected from your monitor
settings, so if you have a Retina or other HiDPI display, things may be too big
or small.
Data source licensing
A/B Street binary releases contain pre-built maps that combine data from:
- OpenStreetMap (https://www.openstreetmap.org/copyright)
- King County metro (https://www.kingcounty.gov/depts/transportation/metro/travel-options/bus/app-center/terms-of-use.aspx)
- City of Seattle GIS program (https://www.opendatacommons.org/licenses/pddl/1.0/)
- https://github.com/seattleio/seattle-boundaries-data (https://creativecommons.org/publicdomain/zero/1.0/)
- Puget Sound Regional Council (https://www.psrc.org/activity-based-travel-model-soundcast)
- USGS SRTM
- Office of National Statistics, under the Open Government License v3.0
Other binary data bundled in:
- Overpass font (https://fonts.google.com/specimen/Overpass, Open Font License)
- Bungee fonts (https://fonts.google.com/specimen/Bungee, Open Font License)
- Material Design icons (https://material.io/resources/icons, Apache license)
- Some Graphics textures (https://www.kenney.nl/, CC0 1.0 Universal)
- Snowflake SVG (https://www.svgrepo.com/page/licensing, CC0)
- Music from various sources with Creative Commons licenses
- Country flags (https://github.com/hampusborgos/country-flags, public domain)
- Transport for London and National Rail icons from Wikimedia, under public domain
Importing a new city into A/B Street
If you get stuck, please email dabreegster@gmail.com or file a Github issue. I promise quick turnaround time. All you need to do is send the boundary of the area you want, drawn with geojson.io.
The easy method
This only works in the downloaded version, not on web.
- Click the map name in sandbox mode to change your location.
- Click "import a new city"
- Follow the instructions. That's it!
This may take a few minutes, depending on download speed. Be sure to use the polygon tool to draw an area, not the polyline tool.
If the city has already been imported
A/B Street includes many cities already. Once you're running the game (natively or on the web), click on the Sandbox option, then check the top for a button to change the map:
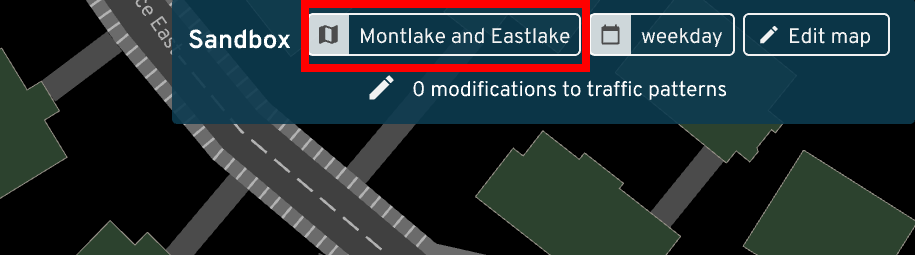
You can browse through a list of cities per country, or use a text search:
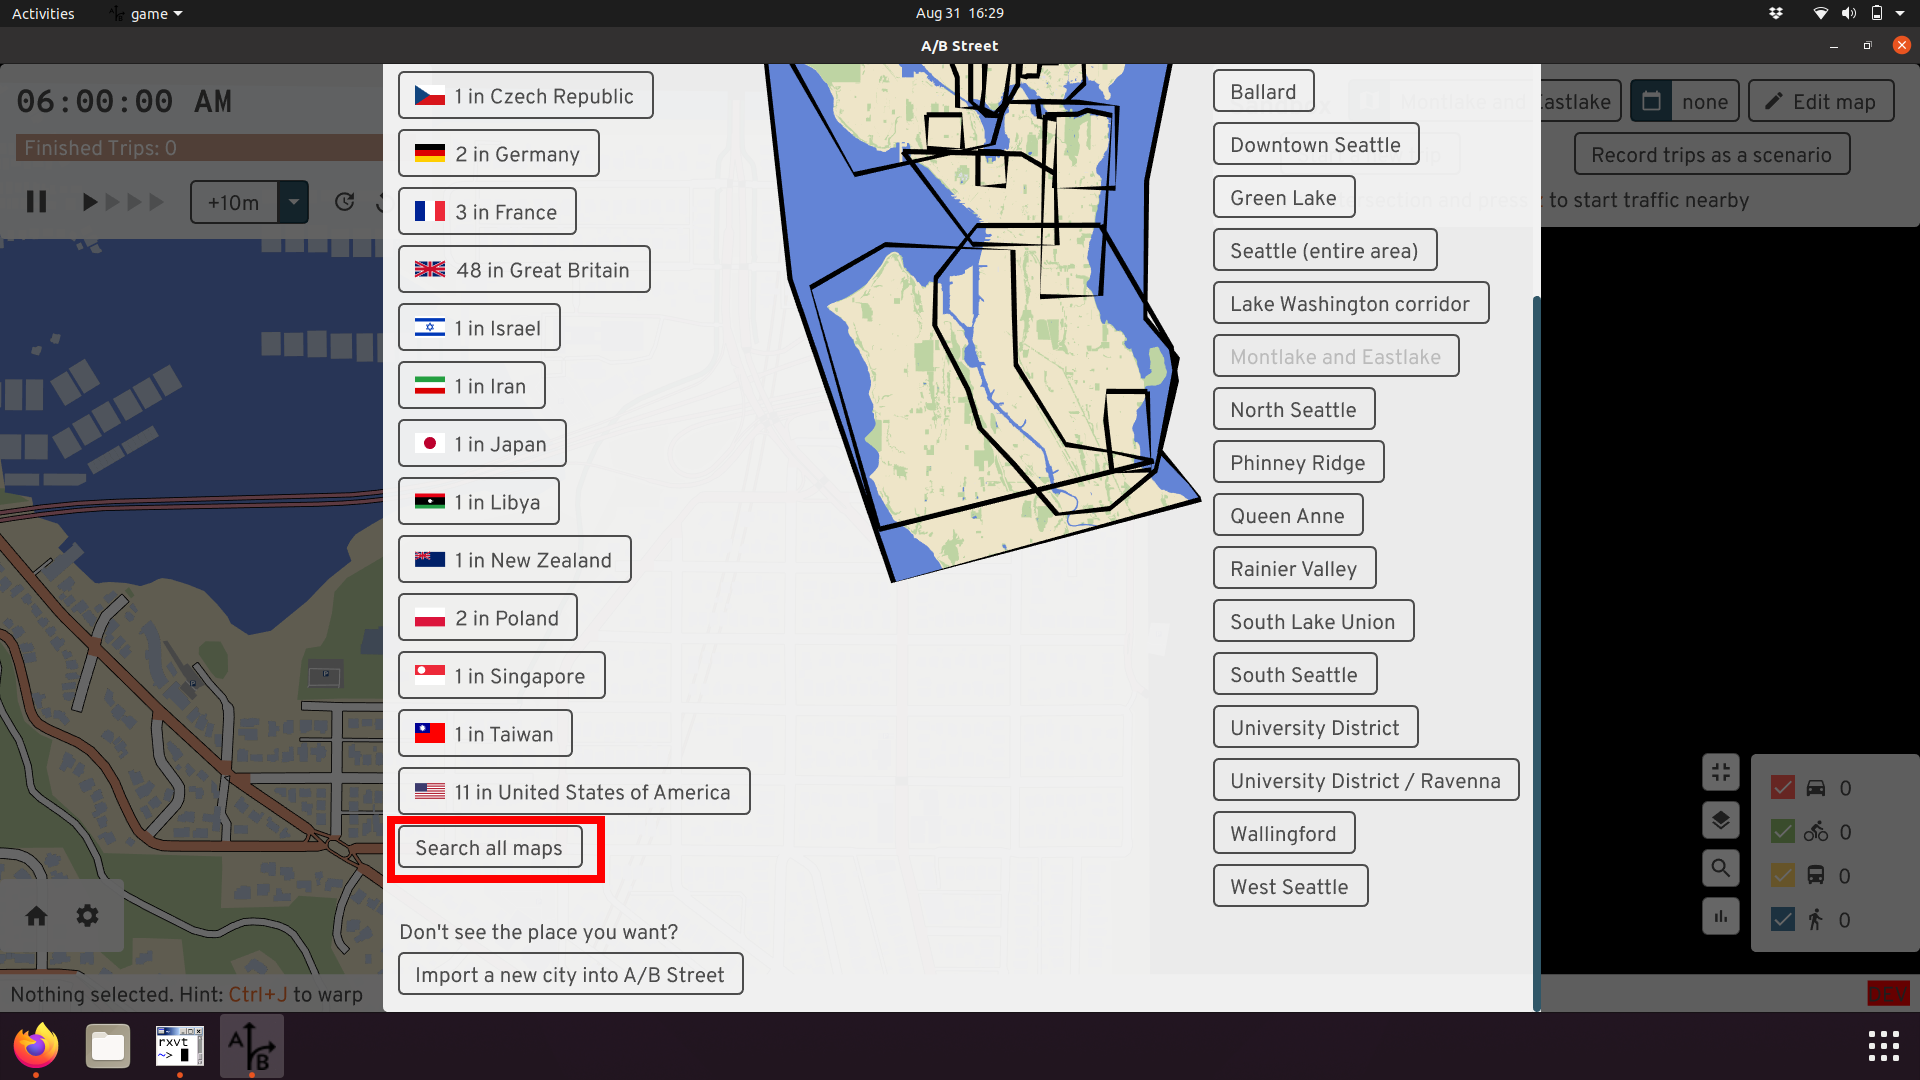
You may need to download data for that city:
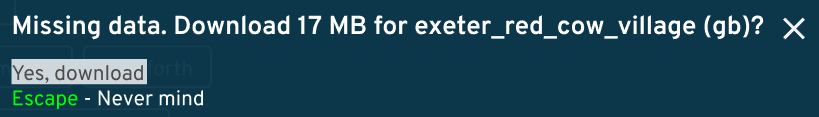
You should be able to open the map. In this case above, the map data was saved
as data/system/gb/exeter_red_cow_village/maps/center.bin.
How to pick boundaries
How do you decide what part of a city to import? It can be tempting to use pre-existing administrative boundaries. There are a few problems:
- Official boundaries might exclude something relevant to transportation in the area. For example, London boroughs don't cover the River Thames or its bridges! Or if you're studying low-traffic neighborhoods, an area near the border of two boroughs might not include enough surrounding context.
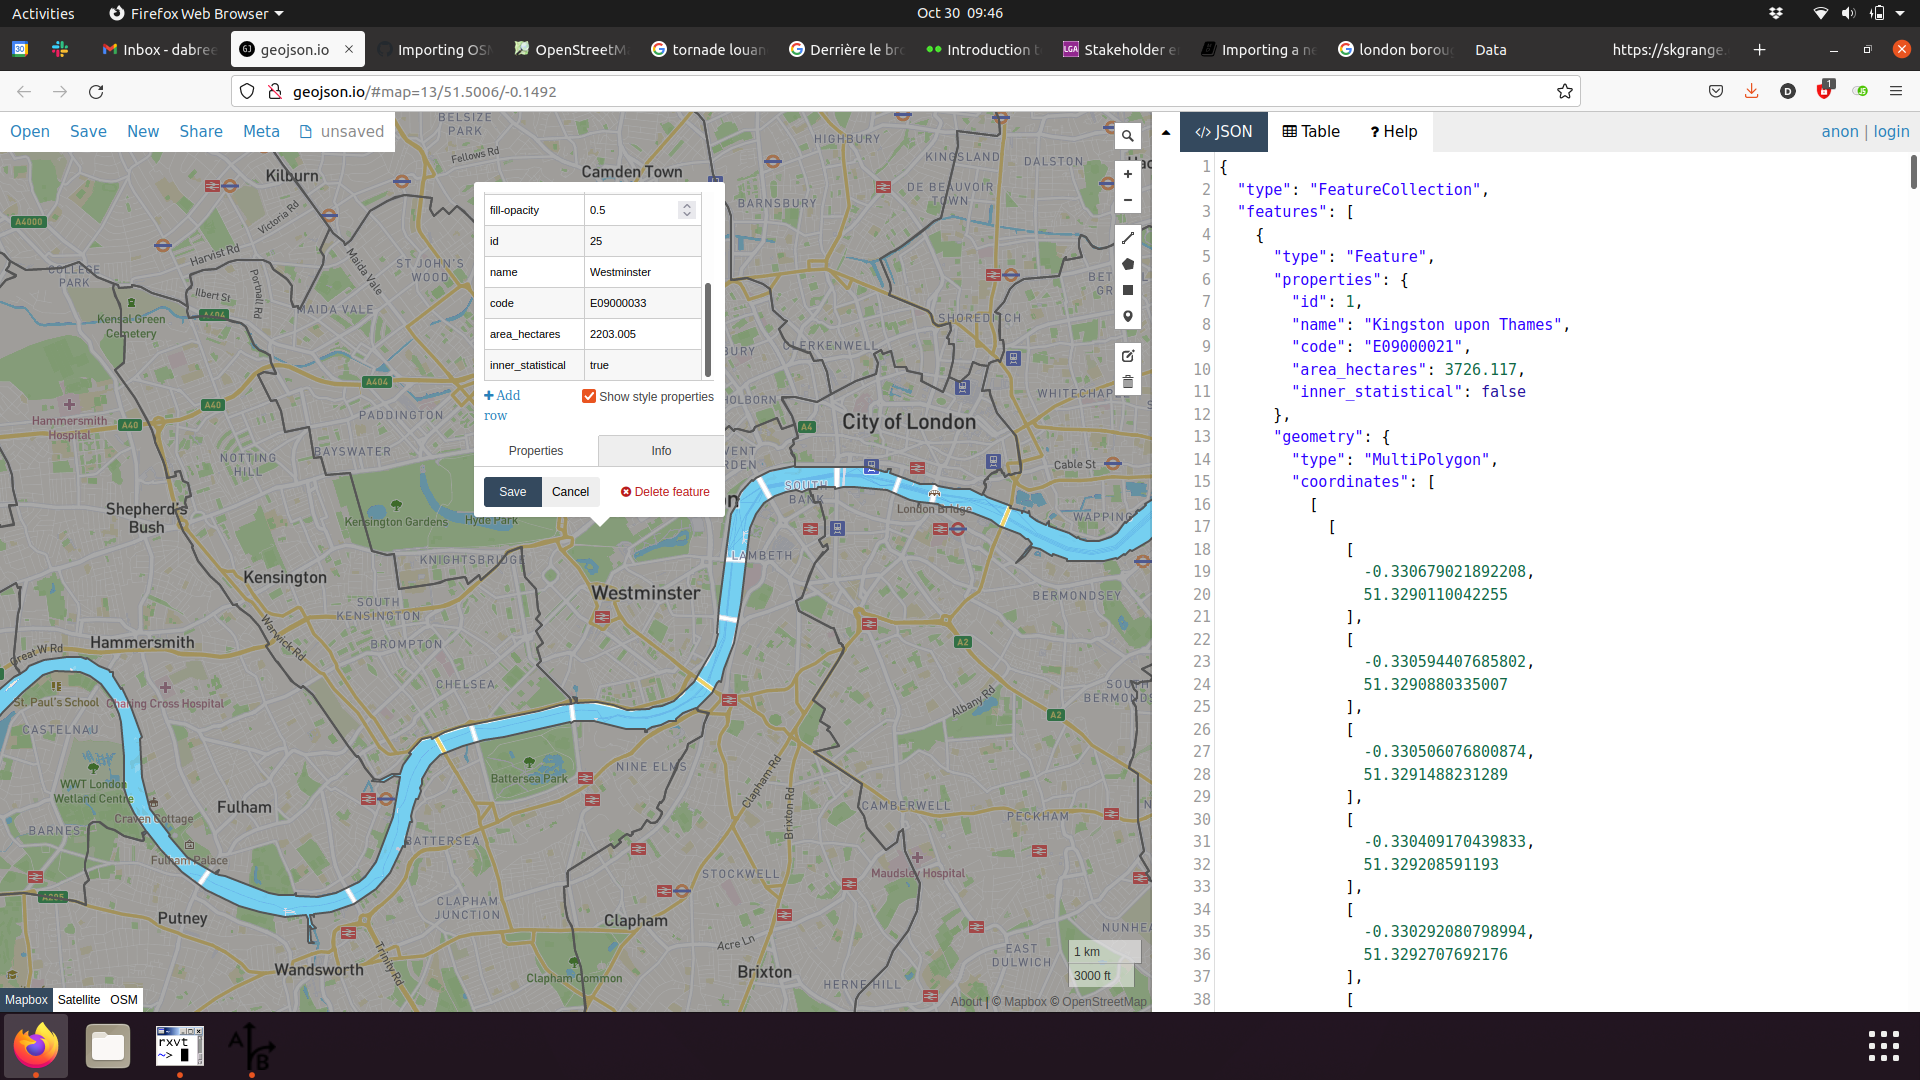
-
File size is hard to tune. You have to play around with this to make the resulting area large enough to be useful, but the map file small enough to comfortably load. About 50MB uncompressed (usually 20MB gzipped) is a good target.
-
You might have to adjust the boundary to exclude the coastline and ocean, due to a bug.
You can create multiple districts covering a city. The districts can partially overlap, and you don't have to cover everything. It's totally dependent on what you want to study. The current Seattle boundaries are just based on different projects we've worked on:
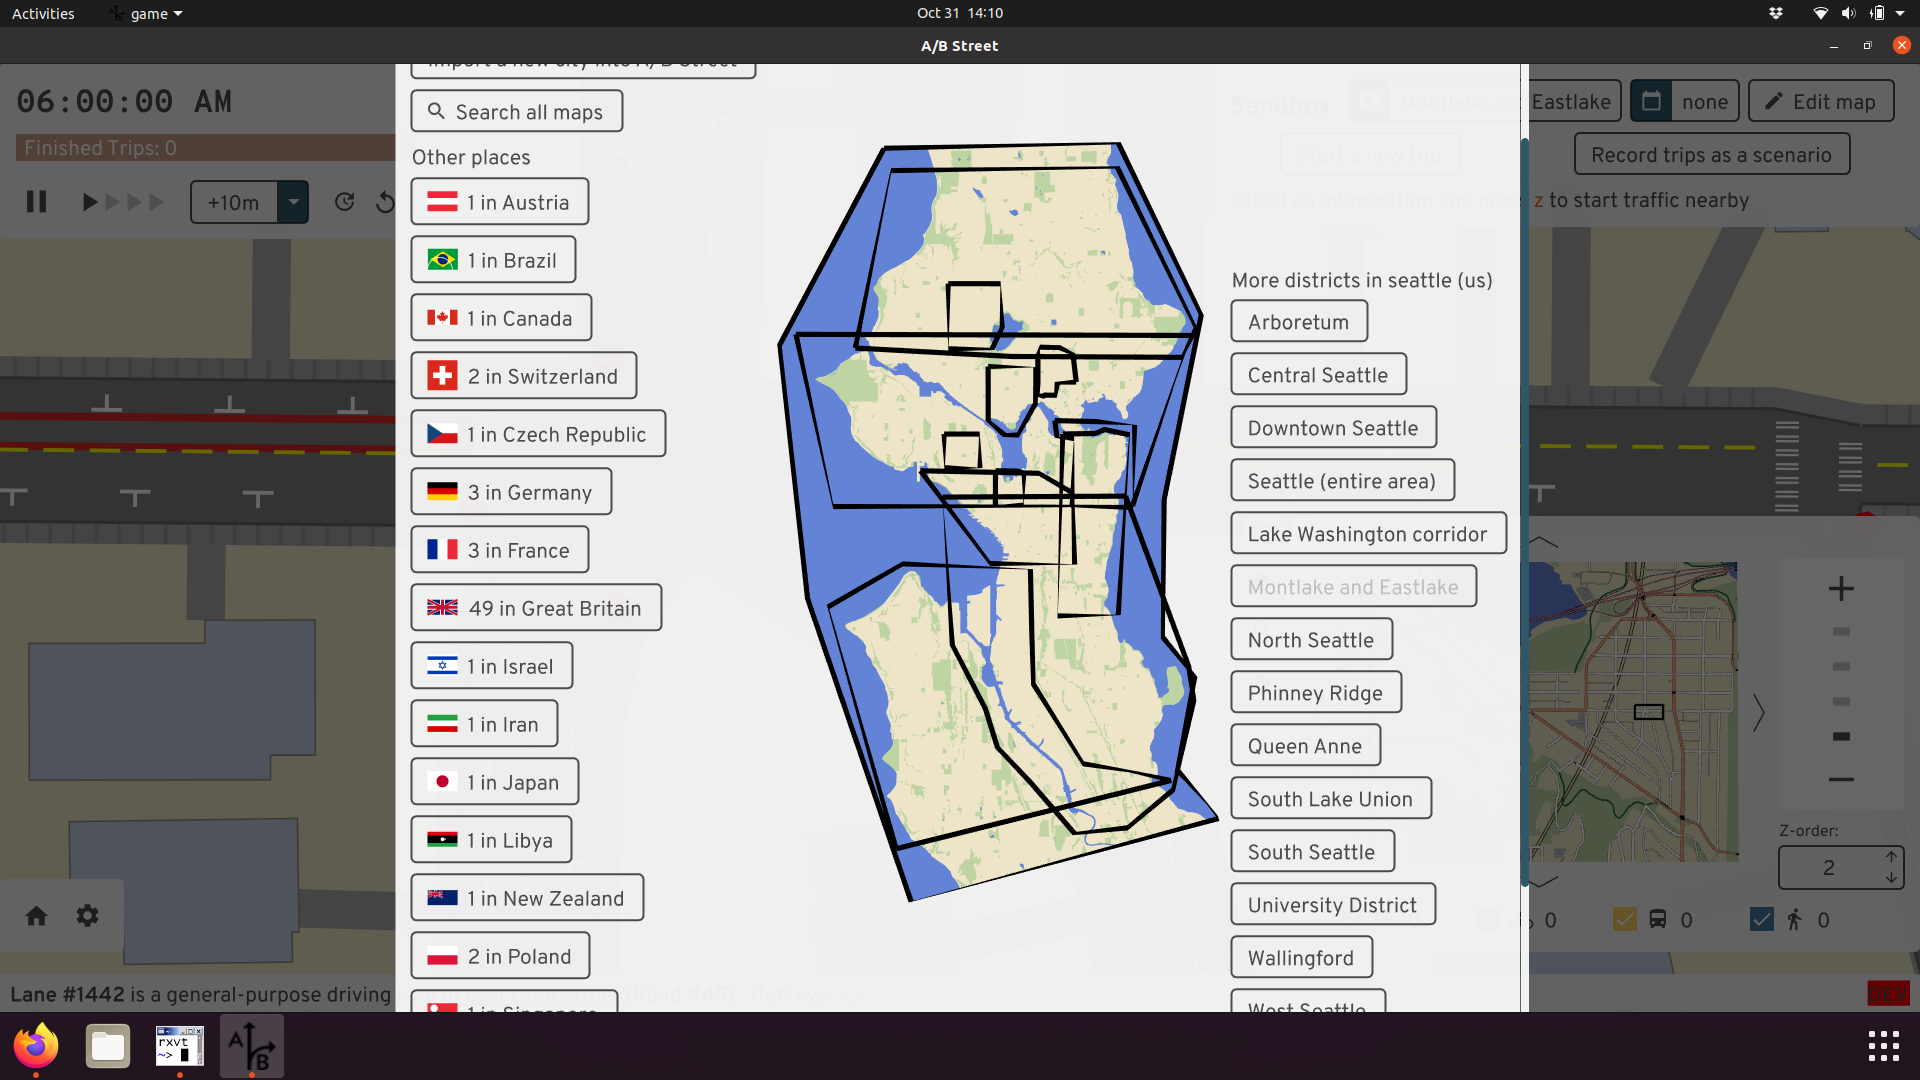
You can also just make best geographic guesses like in Paris:
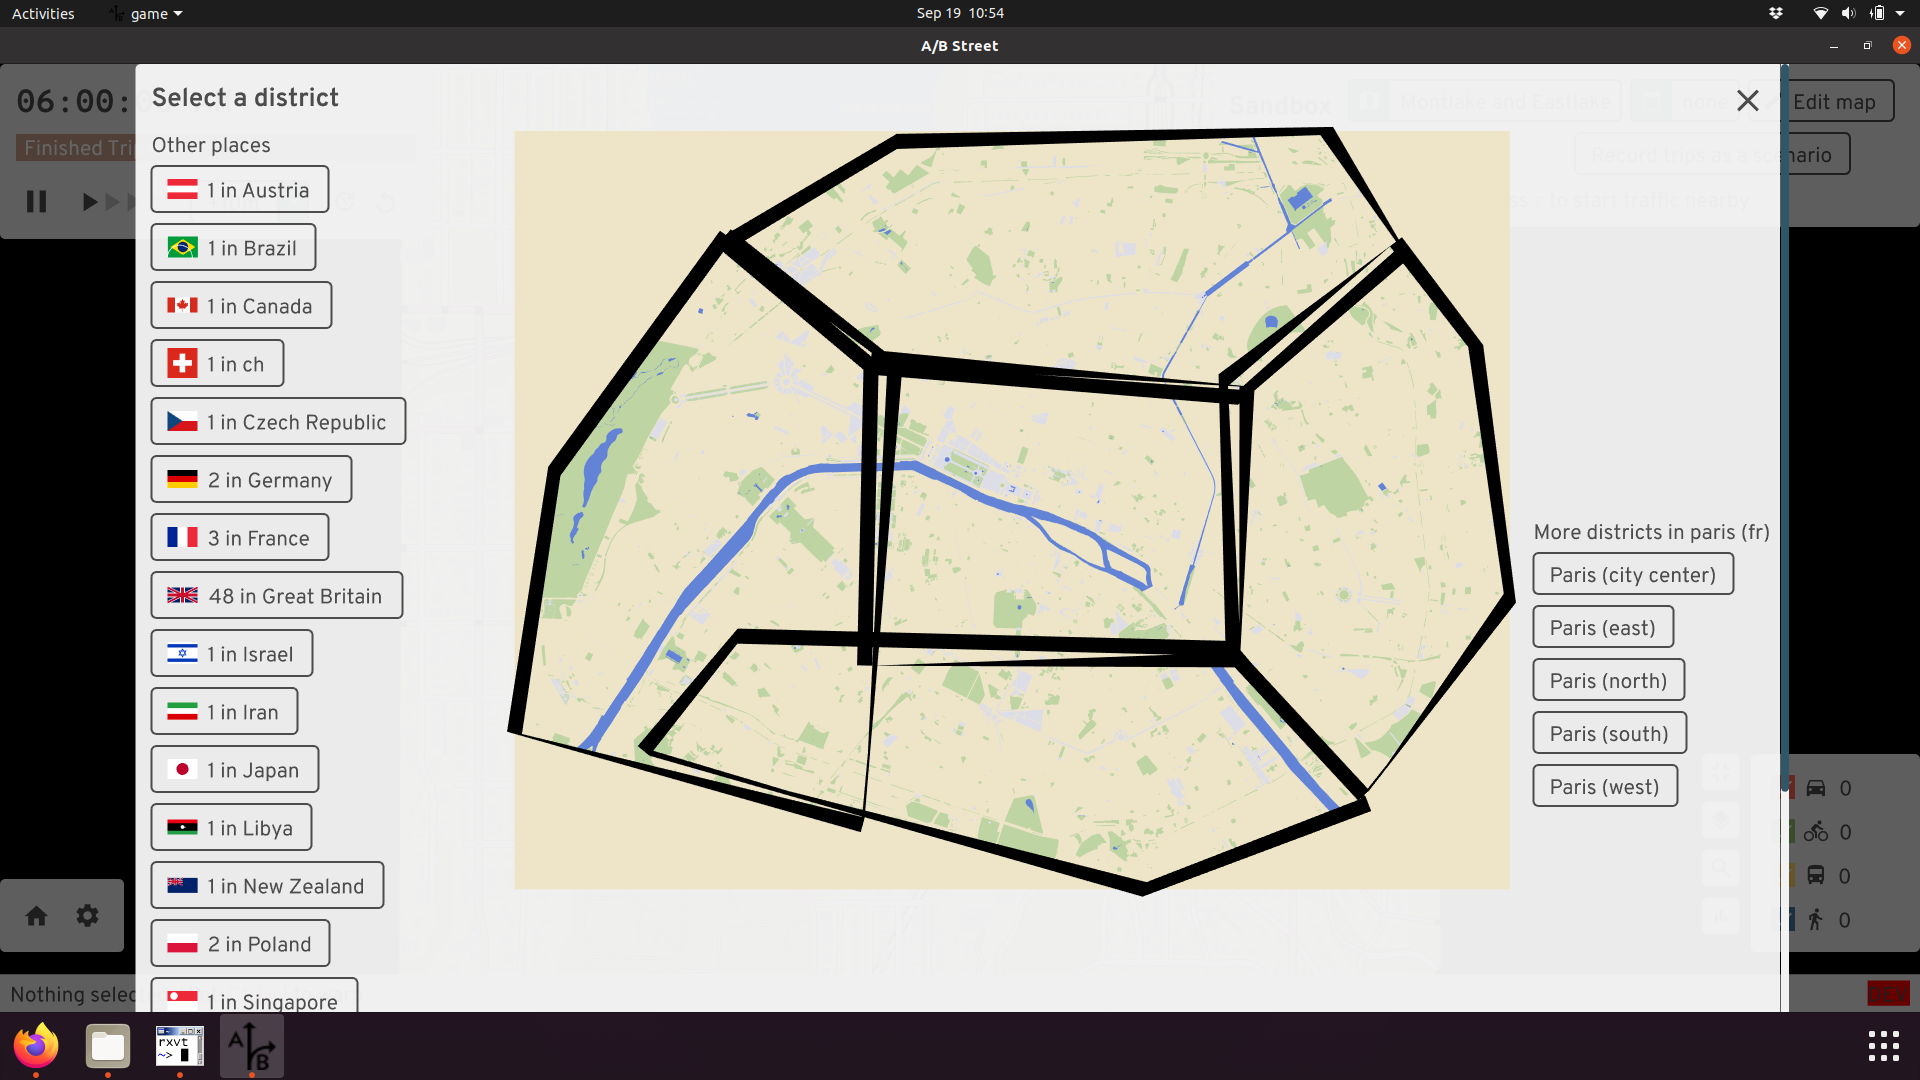
The more maps configured to always be imported, the slower my development workflow gets when working on map importer code. So I'd also request you don't go overboard and ask for lots of areas, unless you're going to actively work on some advocacy or research across multiple A/B Street releases. You can always import an area yourself in the UI.
Advanced: Using the command-line
The process above using the UI just calls a tool to do all of the work. If you want, you can just call that tool from the command line. First save a GeoJSON file with your boundary. Then...
Using a .zip release:
./cli one-step-import --geojson-path=boundary.geojson --map-name=prague
Building from source:
cargo run --release --bin cli -- one-step-import --geojson-path=boundary.geojson --map-name=prague
The new map is located in the country with code "zz" (this isn't a real
country), in the "oneshot" city. This is stored in
data/system/zz/oneshot/maps.
Advanced: Adding the city to A/B street permanently
The easiest method is to just ask Dustin to do this. The full process:
-
Make sure you can run
import.sh-- see the instructions. You'll need Rust, osmium, gdal, etc. -
Create a new directory:
mkdir importer/config/xy/your_city, wherexyis a lowercase two letter country code from https://en.wikipedia.org/wiki/ISO_3166-1_alpha-2 -
Use geojson.io or geoman.io to draw a boundary around the region you want to simulate and save the geojson locally as
importer/config/xy/your_city/region_name.geojson. -
Edit
importer/src/map_config.rsif needed. -
Run the import:
./import.sh --city=xy/your_city --raw --map -
Update
.gitignore, followingtel_avivas an example. Keep sorted! -
Fill out
nice_map_nameinmap_gui/src/tools/mod.rs.
Send a PR with your changes! I'll generate everything and make it work with
updater, so most people don't have to build everything from scratch.
Also, you can divide the city into multiple regions, repeating step 4 and declaring more polygon boundaries. The boundaries may overlap each other, and they don't have to cover all of the space. Picking good boundaries may take trial-and-error; the goal is to keep the resulting map file size small, so that it loads quickly, while capturing all of the area needed to simulate something interesting. This is easiest when you have some local knowledge of the area, and at least a vague goal in mind for what you want to study.
Advanced: Importing a .osm file directly
This section assumes you're comfortable working on a command line. If you have a
.osm XML file, you can import it directly by running
cargo run --release --bin cli -- oneshot-import /path/to/extract.osm. If
you're running from a .zip release and not building from source, replace the
first part with ./cli oneshot-import.
Assuming this succeeds, it'll create a file in the
data/system/zz/oneshot/maps/ directory. In the UI, you can open the "zz"
country to find it.
If you save a .osm file from JOSM, you might get an error importing related to
convert_osm/src/clip.rs. If so, delete the <bounds> element from the top of
the .osm file and try again.
If you follow this process, the resulting map won't have any border intersections, which will break parts of the simulation:
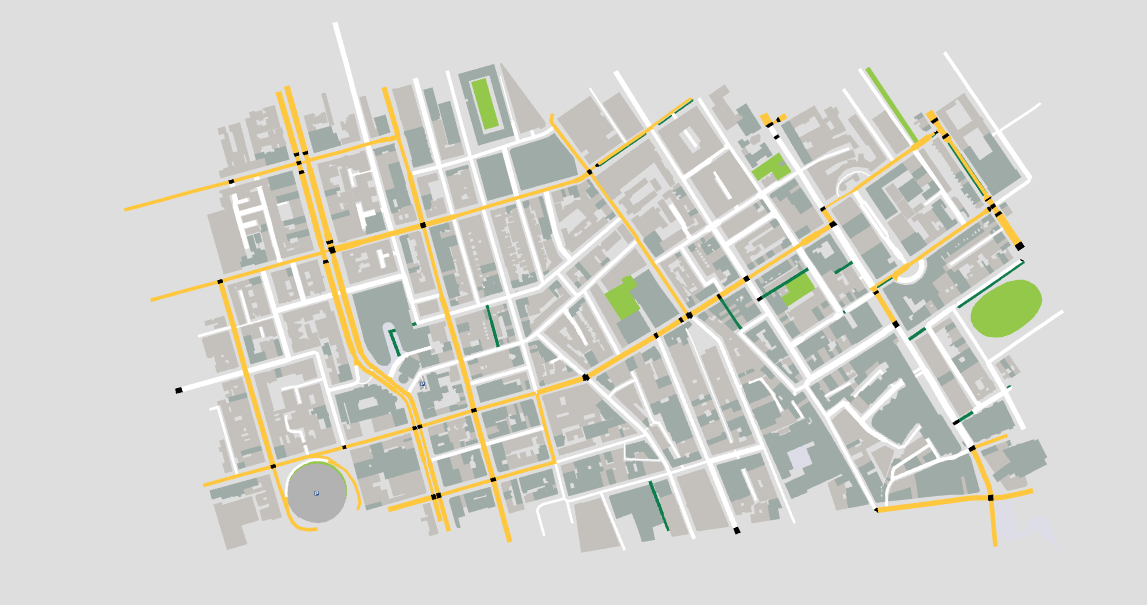
You can fix this by creating the Osmosis .poly file and passing
--clip-path=/path/to/clip.poly to the import command.
One use case for following this section is to temporarily work around broken intersection geometry. The process is:
- Edit the problematic area in JOSM, recreating a complicated intersection in a simpler way.
- Save the .osm file locally
- Run the importer
- Try in A/B Street
You probably don't want to upload the changeset to OSM, unless it's actually mis-tagged. Usually the problem is how A/B Street tries to interpret what's in OSM. Ideally we could also follow this process using the ID editor, but it can't currently manage changeset files fully.
Next steps
OpenStreetMap isn't the only data source we need. If you look at the import pipeline for Seattle, you'll see many more sources for parking, GTFS bus schedules, person/trip demand data for scenarios, etc. Most of these aren't standard between cities. If you want to make your city more realistic, we'll have to import more data. Get in touch.
You may notice issues with OSM data while using A/B Street. Some of these are bugs in A/B Street itself, but others are incorrectly tagged lanes. Some resources for fixing OSM:
Instructions for ASU collaborators
These instructions are tailored to the ASU Transportation AI Lab.
The most important tip: ask questions! File an issue, email dabreegster@gmail.com, or ask for a Slack invite.
Installing
A new version is released every Sunday, but you probably don't need to update every week.
- Go to https://github.com/a-b-street/abstreet/releases and download the
latest
.zipfile for Windows, Mac, or Linux.
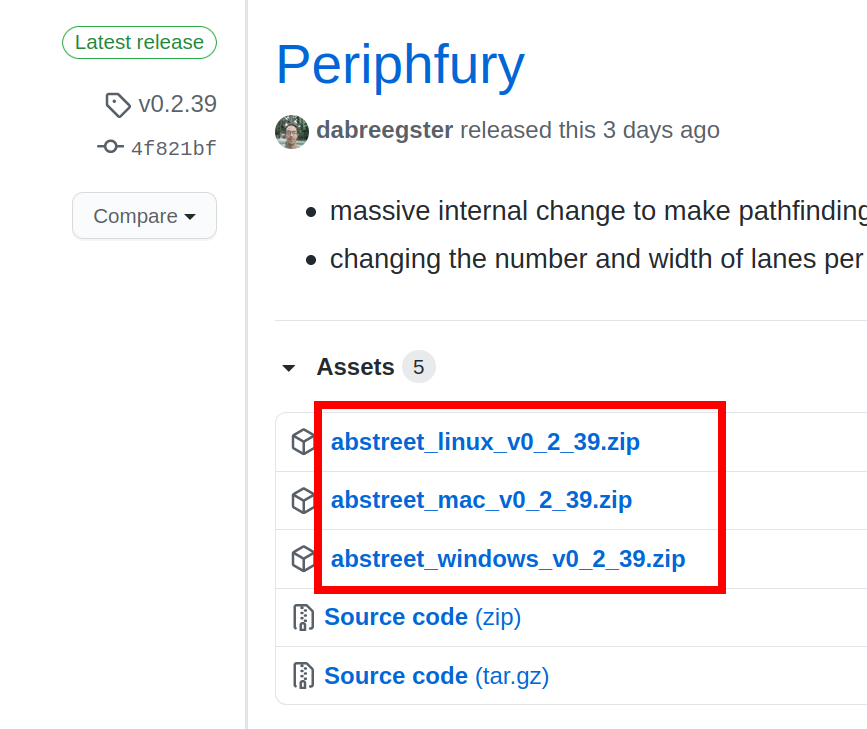
- Unzip the folder and run
play_abstreet.shorplay_abstreet.bat. If you get security warnings, see here.
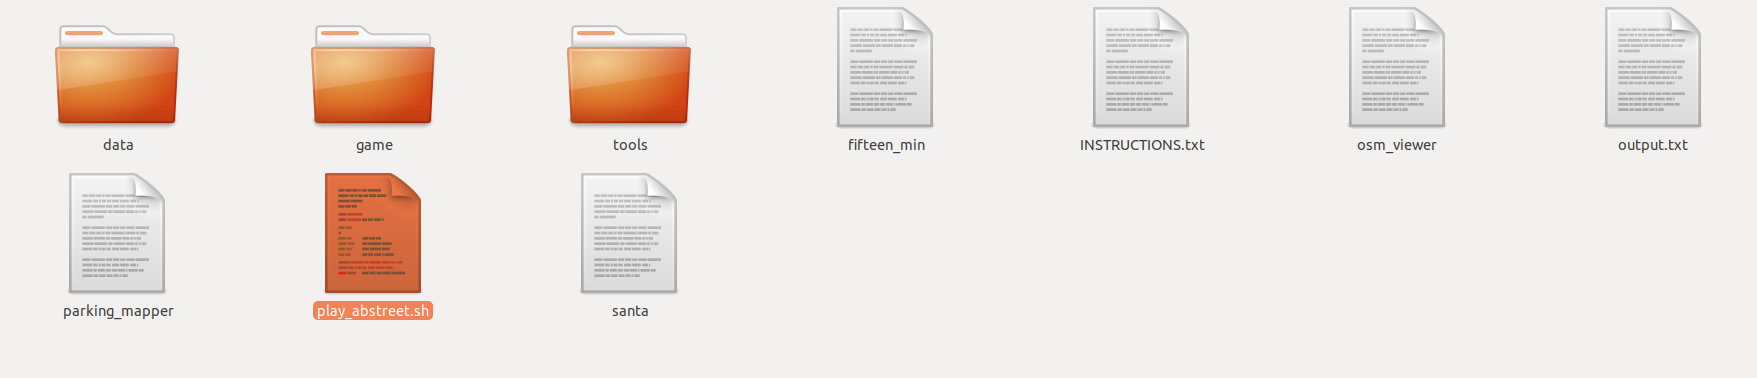
- On the main title screen, click
Sandbox. This starts in Seattle by default, so change the map at the top.
- Choose USA, then Phoenix.
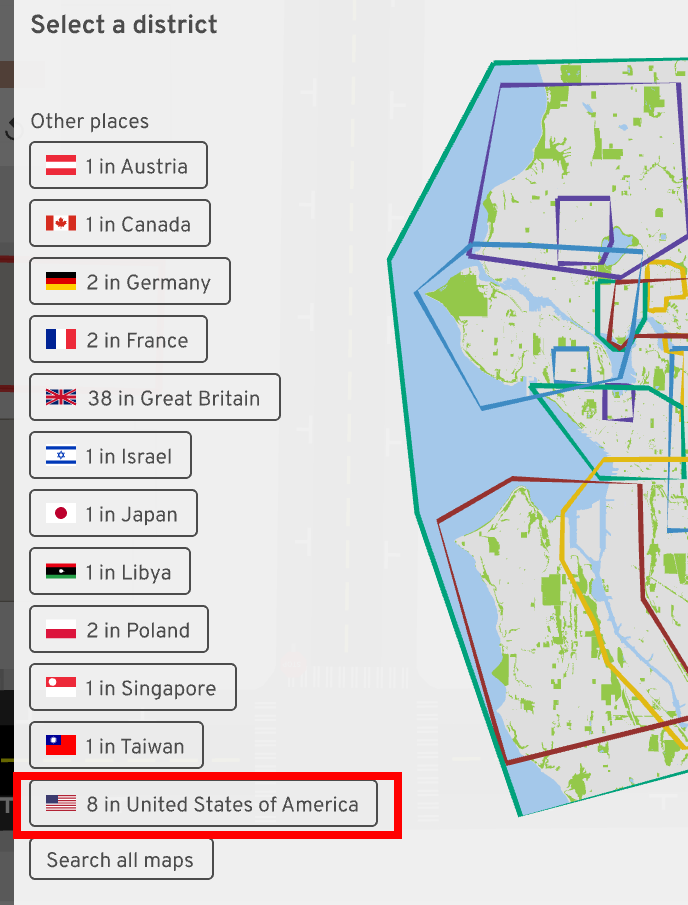
- You'll be prompted to download some files. It should be quick. After it's done, click Phoenix again.
You've now opened up the Tempe map!
A shortcut and improving the simulation in Tempe
On Windows, edit run_abstreet.bat and change the last line to:
game.exe --dev data/system/us/phoenix/maps/tempe.bin --infinite_parking 1> ..\\output.txt 2>&1
On Mac, edit run_abstreet.sh and change the last line to:
RUST_BACKTRACE=1 ./game --dev data/system/us/phoenix/maps/tempe.bin --infinite_parking 1> ../output.txt 2>&1
--dev data/system/us/phoenix/maps/tempe.bin will skip the title screen and
start on the Tempe map by default; this will save you lots of time.
--infinite_parking disables the parking simulation. By default, there's an
unrealistic amount of people walking around Tempe just to reach the spot where
their car is parked. We don't have good data yet about on- and off-street
parking, so it's best to just make driving trips begin and end at buildings or
off the map, without a step to search for parking.
There are a bunch of other startup parameters you can pass here too.
Importing a Grid2Demand scenario
When you run https://github.com/asu-trans-ai-lab/grid2demand, you get an
input_agents.csv file. You can import this into A/B Street as a scenario.
- Change the traffic from
none
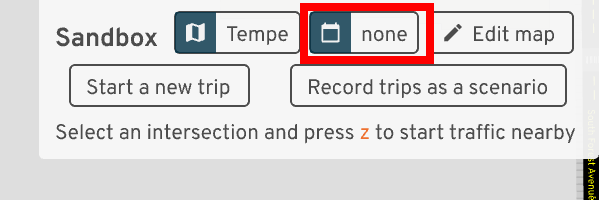
- Click
import Grid2Demand data
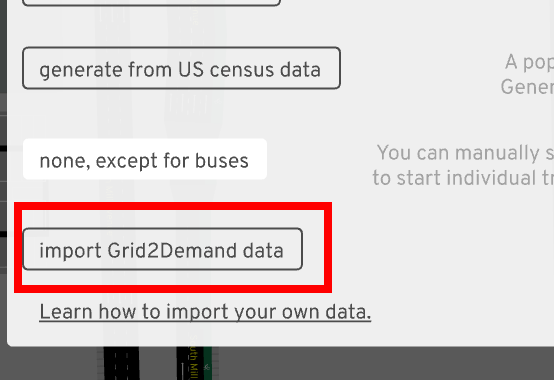
-
Choose your
input_agents.csvfile -
A new scenario will be imported. Later you can launch this from the same menu; the scenario will be called
grid2demand
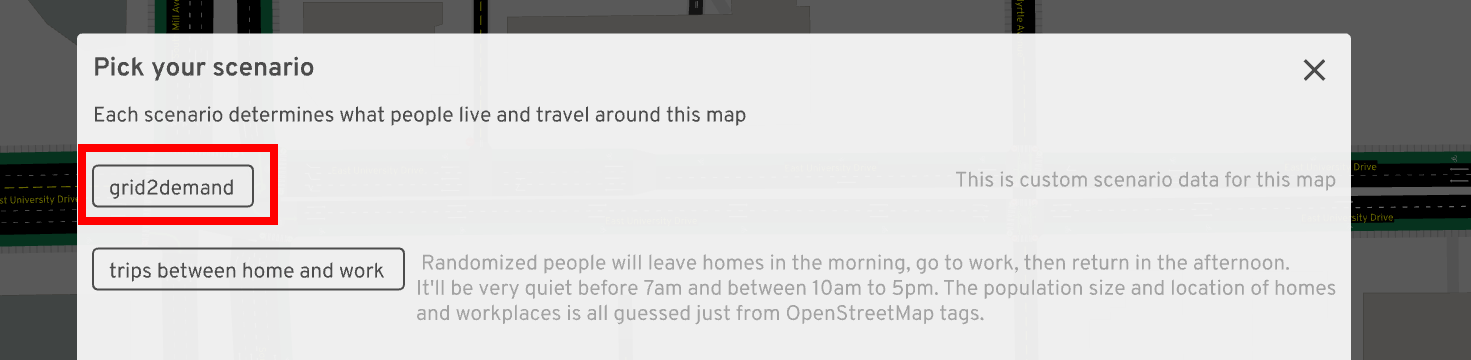
Grid2Demand needs a .osm file as input. The extract of Tempe that A/B Street uses is at https://abstreet.s3.us-east-2.amazonaws.com/dev/data/input/us/phoenix/osm/tempe.osm.gz. Note the file is compressed.
Modifying a scenario
You can transform a scenario before simulating it. This example will cancel all walking and biking trips from the scenario, only leaving driving and public transit.
- After loading a scenario, click
0 modifications to traffic patterns
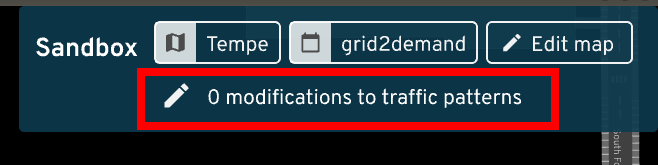
-
Click
Change trip mode -
Select the types of trips that you want to transform, and change them to cancel. Click
Apply.
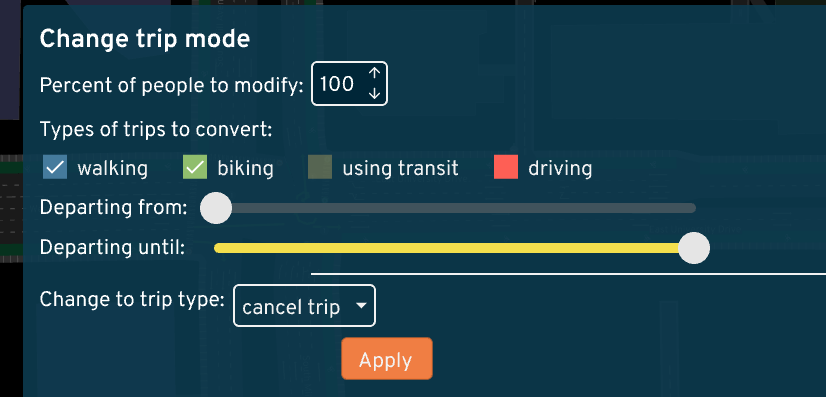
Importing Vol2Timing data
https://github.com/asu-trans-ai-lab/Vol2Timing/ produces timing.csv files
that you can import into A/B Street.
-
Open the traffic signal editor for an intersection in A/B Street.
-
Click
Edit entire signal -
Choose
import from a new GMNS timing.csv, then pick your file.
The import process isn't finished yet; some movements aren't matched properly,
some movements are incorrectly marked as protected, and no crosswalks are
imported yet. When you import, some error messages may be displayed, and others
might wind up printed to STDOUT (captured in output.txt on Windows).
If you want to import timing for more intersections in the same map, after
Edit entire signal, you should also have n option like
import from GMNS C:\path\to\timing.csv.
Debugging timing.csv
Along with QGIS, you can also visualize timing.csv in A/B Street directly.
-
From the title screen, choose
Internal dev tools. -
Change the map if necessary.
-
Click
view KML. -
Click
load KML file, then choose yourtiming.csv. -
Each movement is drawn in red. You can hover over a line-string to see its attributes, and click to open all details.
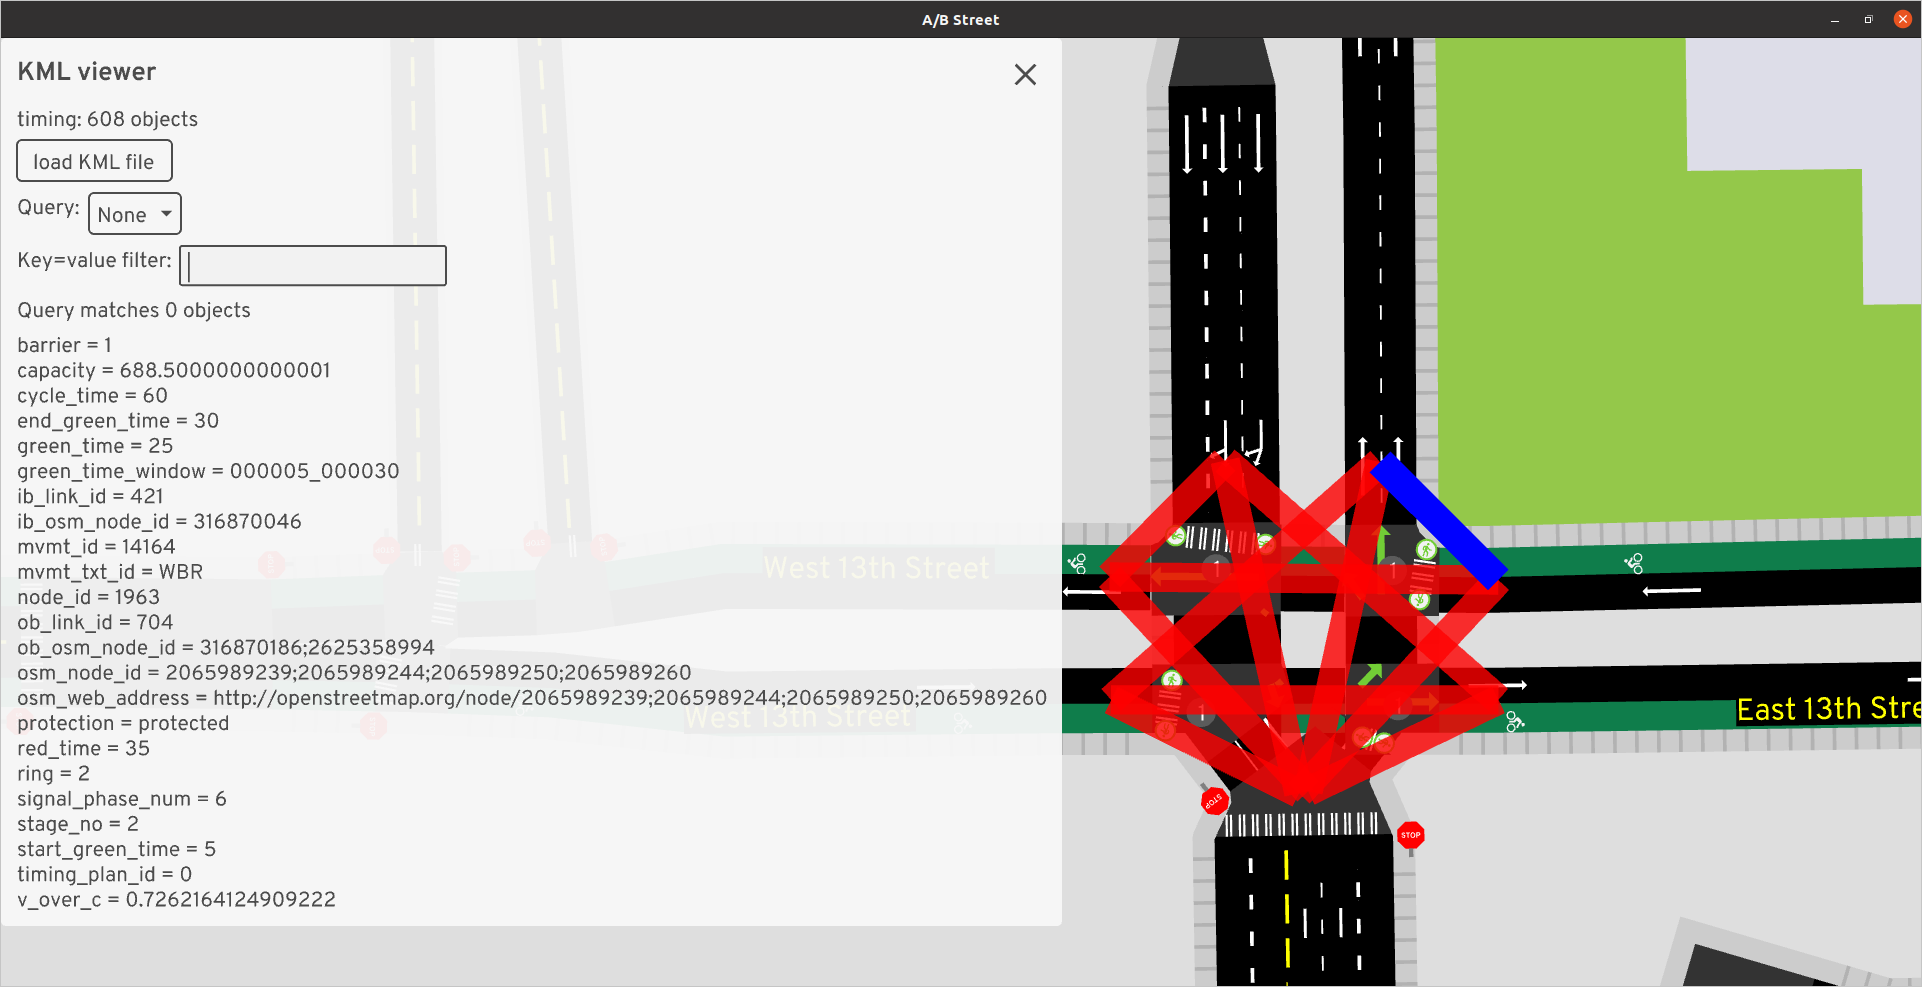
- Using the key=value filter on the left, you can type in
no=3to matchstage_no=3and easily check what movements belong to each stage.
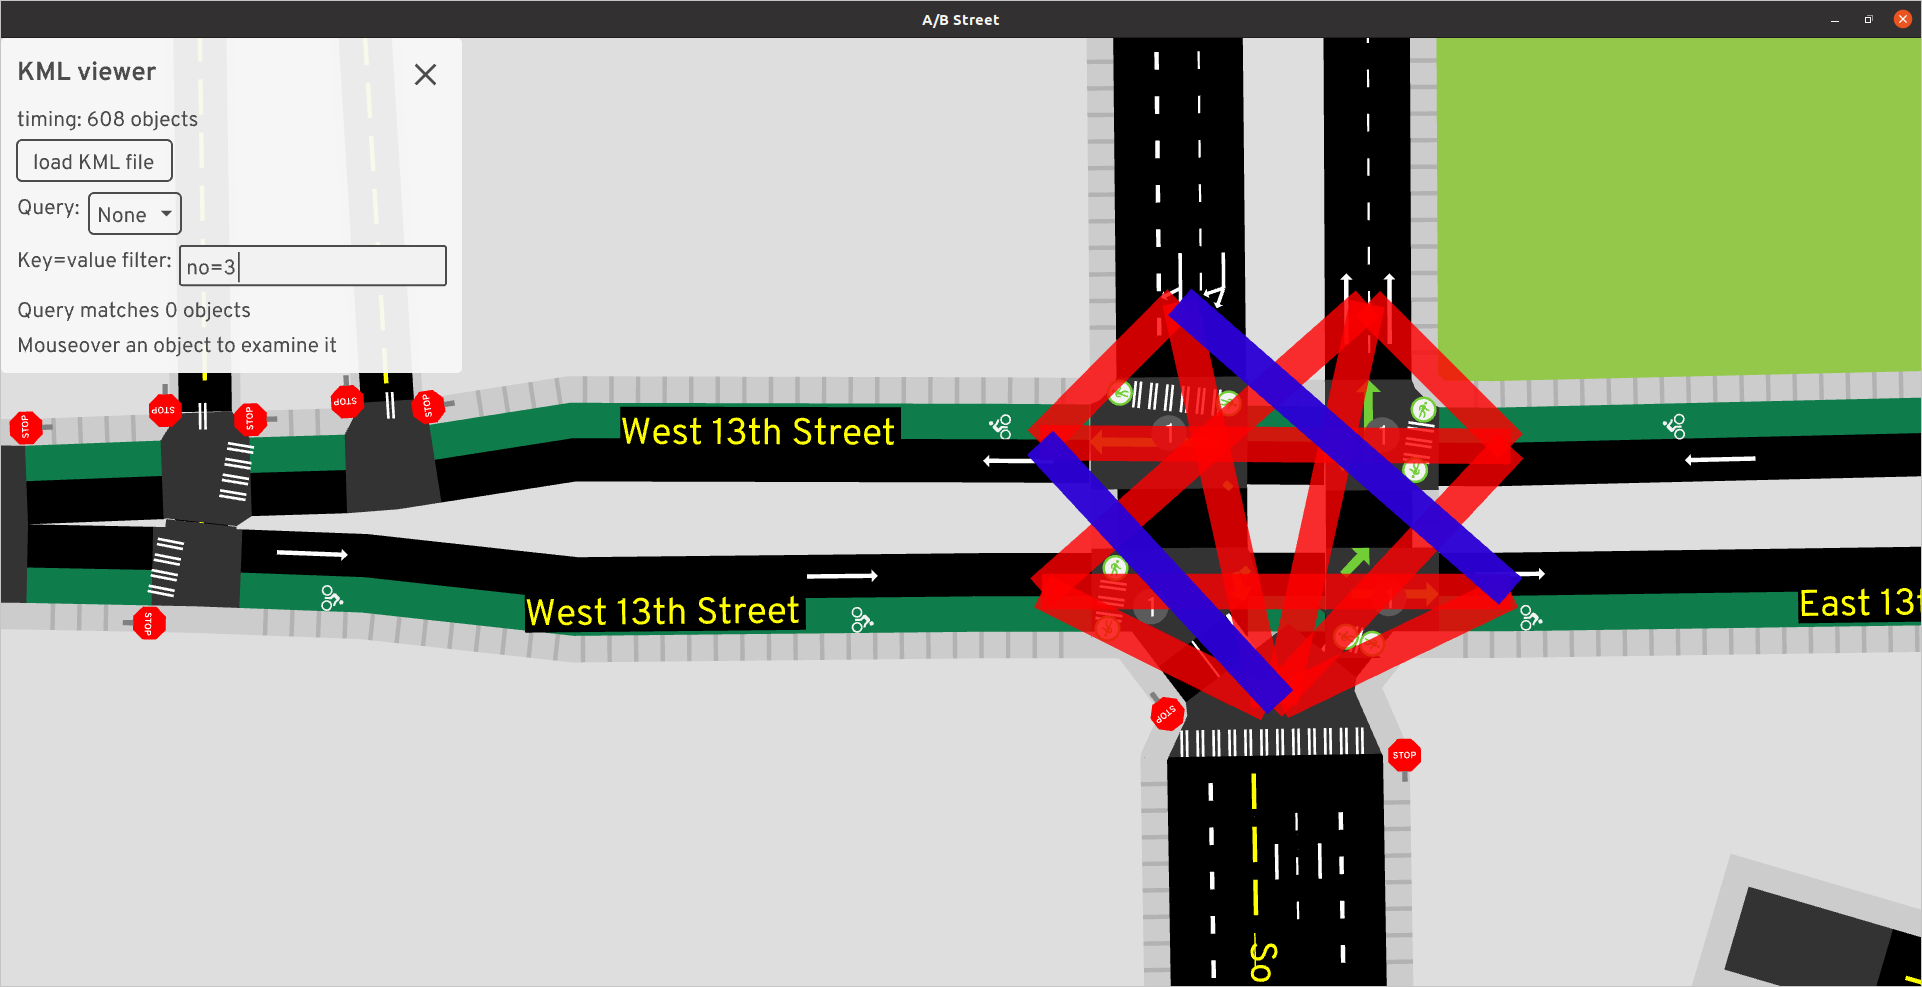
Proposals
The whole point of A/B Street is for people to suggest real fixes to their city, so here's the list. In most cases, we're not yet able to use A/B Street itself to illustrate the problem or solution -- but that shouldn't stop this list from starting.
If you want to add anything here, contact us!
Seattle
Disclaimer: currently this is just one person's (Dustin) list, so it reflects my experiences and biases. South Seattle is conspicuously missing -- I need to go explore more.
Safety problems biking:
- Airport Way southbound from ID to Georgetown. The right lane has a huge shoulder; at least paint a bike lane
- Broadway bike lanes missing between Highland and John
- Partitioning off a lane of Aurora at Green Lake west, proposed by Seattle Greenways
- Bike lanes vanishing halfway up Harvard to Roanoke
- The massive intersection where the Burke Gilman meets Corliss
- No passing room on Fuhrman/Boyer
Antagonistic traffic signal timing:
(Why are these important: they're hopefully a cheap change, and problems here add up, making driving the most convenient option.)
- Northbound on 11th after the University Bridge
- Turning left from 11th Ave NE to Ravenna
- The double crosswalk at Montlake / Husky Stadium
- Cherry and 12th; long cycle time for people crossing near Seattle University
- Yesler and Broadway slow beg buttons
- Unmarked beg buttons around Beacon Hill, and no bike actuators
- Beg buttons along Interurban near Bitter Lake
Larger changes:
- Cafe/bus street along University Ave
- Eastlake cycle lanes
- Madison Safety Corridor
London
There's some idea related to a cycle-path on the A5
Template
Over time, each idea will link to a full write-up. That page can have any format, but I imagine this basic structure is useful:
- Describe the problem
- A clear map showing the scope of the issue
- Include pictures and videos from a physical survey, or maybe annotated satellite imagery
- Use A/B Street to demonstrate the problem for individual people or in aggregate
- Describe the proposed solution
- Ideally A/B Street is useful for visualizing the change, and measuring quantitative results.
- Explain any limits with the modelling
- Give context on the problem
- Is this being discussed anywhere -- often on Twitter?
- Are there other proposals or write-ups?
- Give arguments against the proposed solution
- Unintended consequences, prohibitive costs, alternate routes available
Dustin's vision for Seattle's bike network
I've been commuting almost exclusively by bike here since 2014. I've had too many close calls and plenty of frustrating moments when it feels like the design is trying to discourage this mode of transport as much as possible. I want to see a network tht encourages as many people as possible to choose biking over driving, for these reasons.
So many times, I wish I had a magic wand that could just fix things. I don't, and it takes years of concentrated effort to campaign and push for redesigned streets, and I'm impatient -- so I (along with my team) built that magic wand: software to sketch out my vision for biking in Seattle. My hope is that if people can more easily imagine and visualize things like the bike master plan, they'll debate more effectively about them, proposals will be funded more easily and with greater participation from more people.
The vision here will just be limited to adding bike lanes, protected by planter boxes or just paint, to existing road-space, usually by sacrificing street parking or an extra driving lane. There are plenty of other changes I want to see involving light rail, bus frequencies, Stay Healthy Streets, and zoning changes... but that's not the focus here.
Disclaimer
This is what I personally want to see, based on where I live and commute. I'm very much bringing all of my biases into the proposal. You'll notice much less focus in South and West Seattle, because I don't happen to spend much time there. Of course I think they also deserve great bike infrastructure, but I'm not experienced enough to talk about it.
Because of this, I'm not very attached to this specific proposal. What I really want is for you to try out this software yourself and share your own vision. This write-up just serves as an example use of the tool. Please give it a spin and blog or tweet about it, so I can go back to writing code, not English!
The network
Follow along in your web browser. Most of the changes are around Central Seattle and South Seattle. If you have trouble using the tool, check the user guide or send feedback.
Boyer / Fuhrman
This is practically the origin story of A/B Street; it only takes one truck passing super close and almost pancaking me into the line of parked cars...
Swapping parking for some dedicated lanes is a really tough sell between the university bridge and 520 underpass, though. Having lived in the area for a few years (when I still had a jeep to park), I can confirm how low the area is on street parking. Although the area's strategically close to UW and downtown for biking, nearby transit connections are a bit of a walk. Also, Fuhrman has a bunch of curb bulbs and traffic islands that would force bikes to merge back into the main lane every few blocks, so this would probably be a bigger paving project.
The alternative route is to cross the University or Montlake bridge and take the Burke, or take the scenic route through south campus. But depending which way you're going, this is a long detour, and probably forces you over the Montlake bridge, meaning navigating the absolute mess of Montlake/520. It's possible the the lid will make this area less terrible, but... not sure how. (There are some tricks like the Bill Dawson trail that slightly ease the pain, depending where you're going.)
It's possible there's some plan for Fuhrman with RapidRide J?
NE 45th St
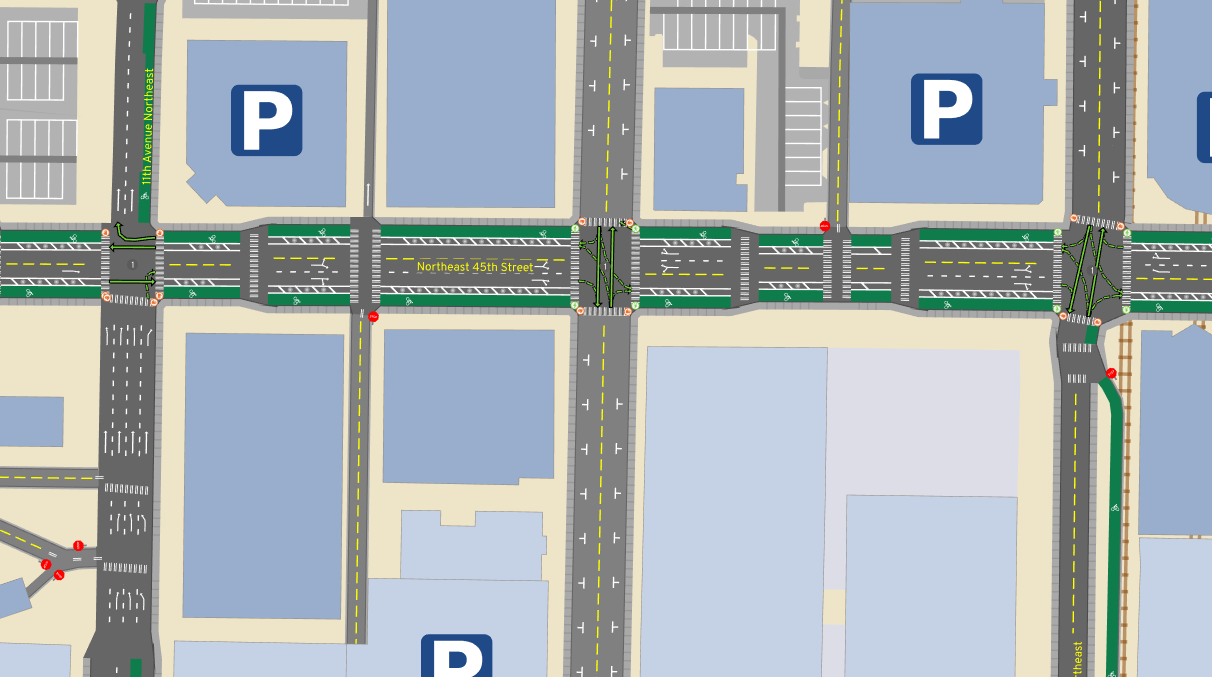
Joe Mangan presents this vision way more eloquently than I could. Another organization has called for better facilities on the I5 bridge, but I'd personally like to make the connection all the way from the U-district to Wallingfjord, patronizing all the shops along the way without hustling to keep up with traffic.
I thought about 50th as an alternative, but it's farther from the action in the U-district (including the brand new Link station!) and would skip the Wallingford business district.
Aurora Ave
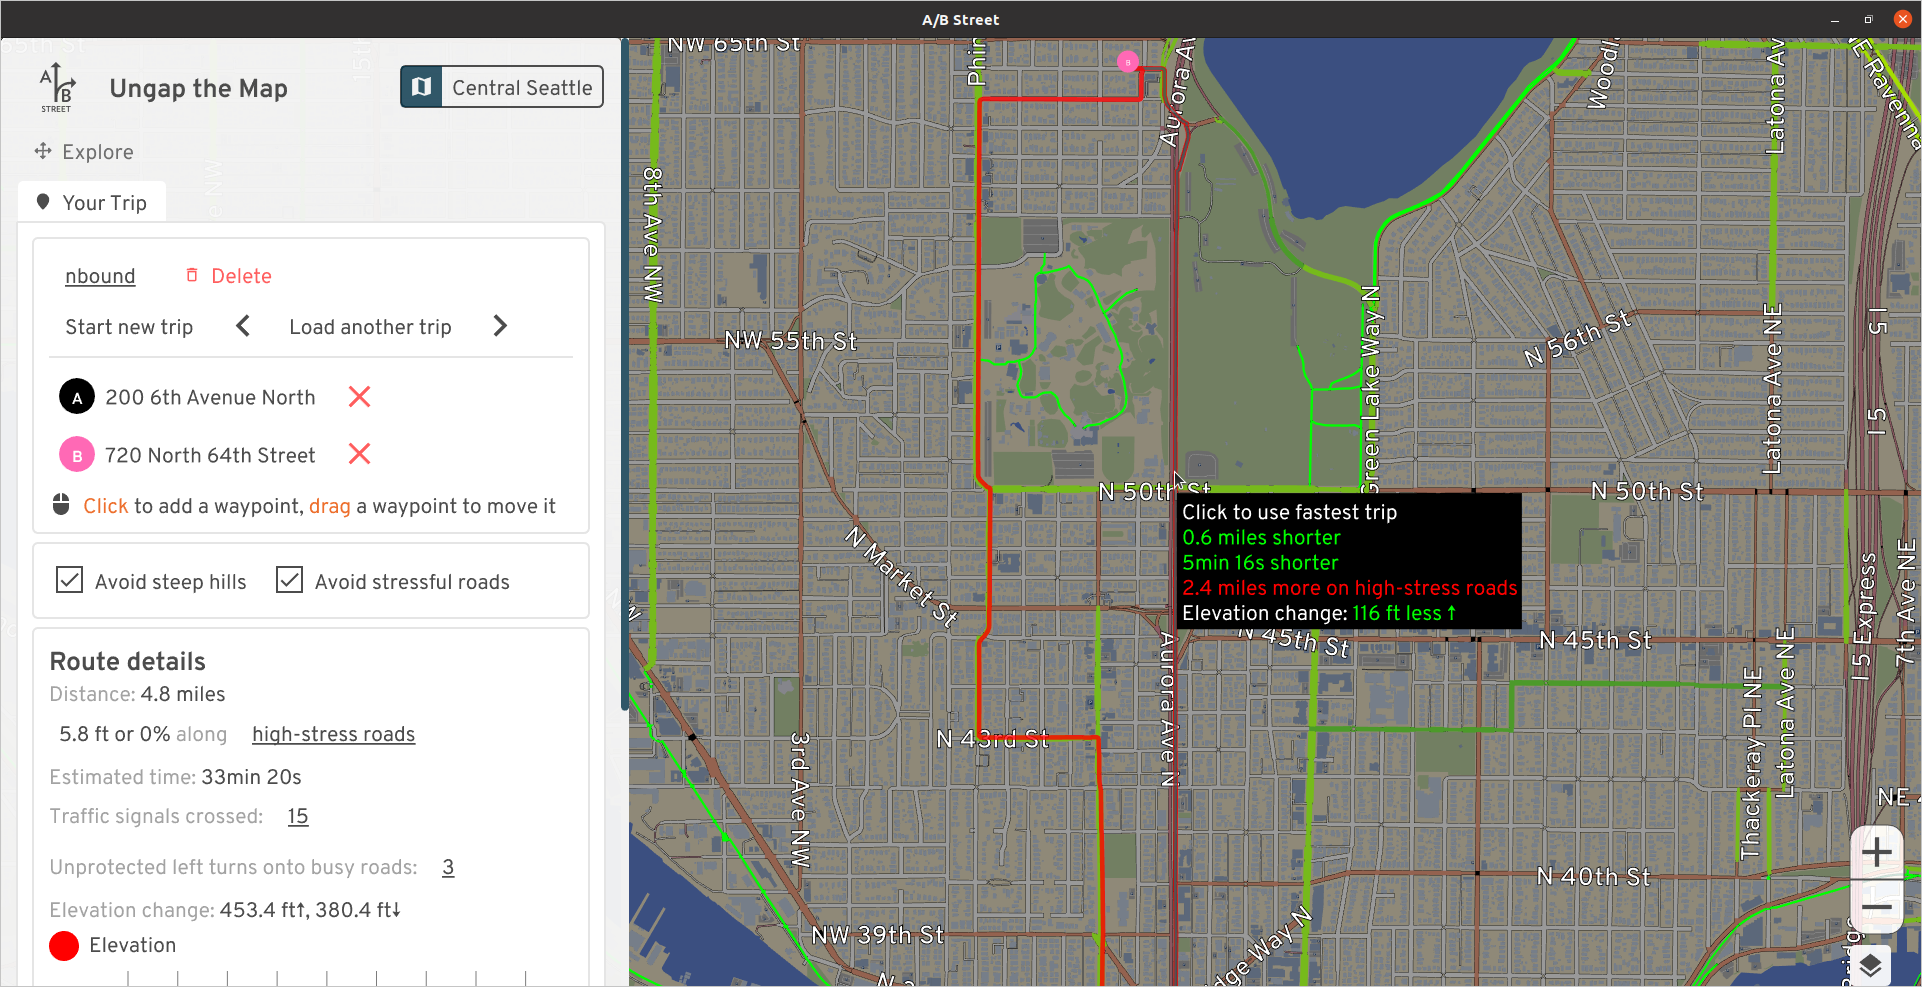
This is a trivial argument by checking elevation. If you're going north from Fremont, climbing Fremont Ave, then Phinney and Greenwood Ave at least has some paint. But just look at how gentle the elevation using Aurora would be! Looking the other direction, it could be a straight shot -- a bicycle superhighway -- from all of north Seattle right to downtown.
I would sometimes brave biking the bus lane when I lived in Lichton Springs. If you've got your wits about you and don't mind cars flying by at 50mph, it's, uh, fine, until somebody wants to use the bus lane to accelerate or turn right quickly. The right-of-way is utterly massive; there's many ways to squeeze in a cycletrack of some sort.
See Aurora Reimagined Coalition and Complete the Loop for some ongoing advocacy efforts in the area.
Rainier Ave
The most direct connection between the International District and Colombia City is straight down Rainier, a nearly flat route:
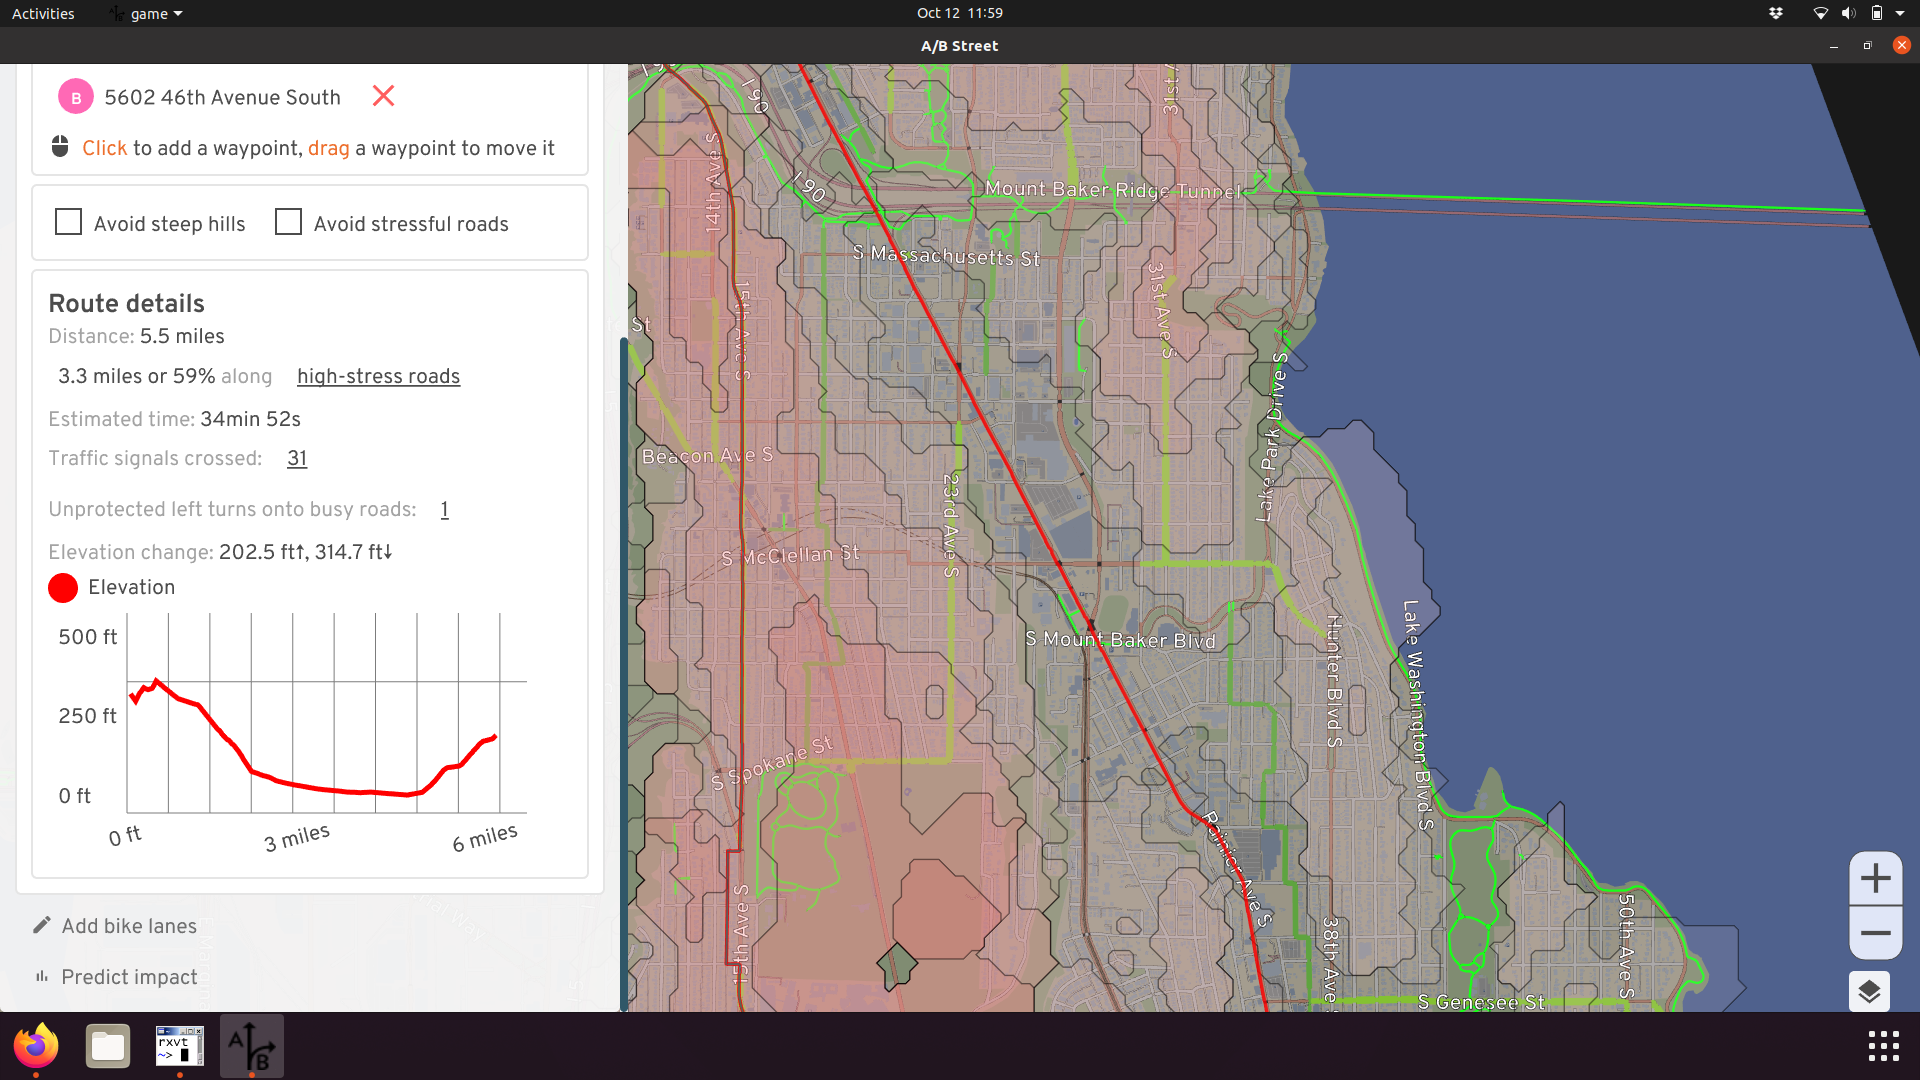
The quiet route takes longer, is steeper, and doesn't bring you past any businesses:
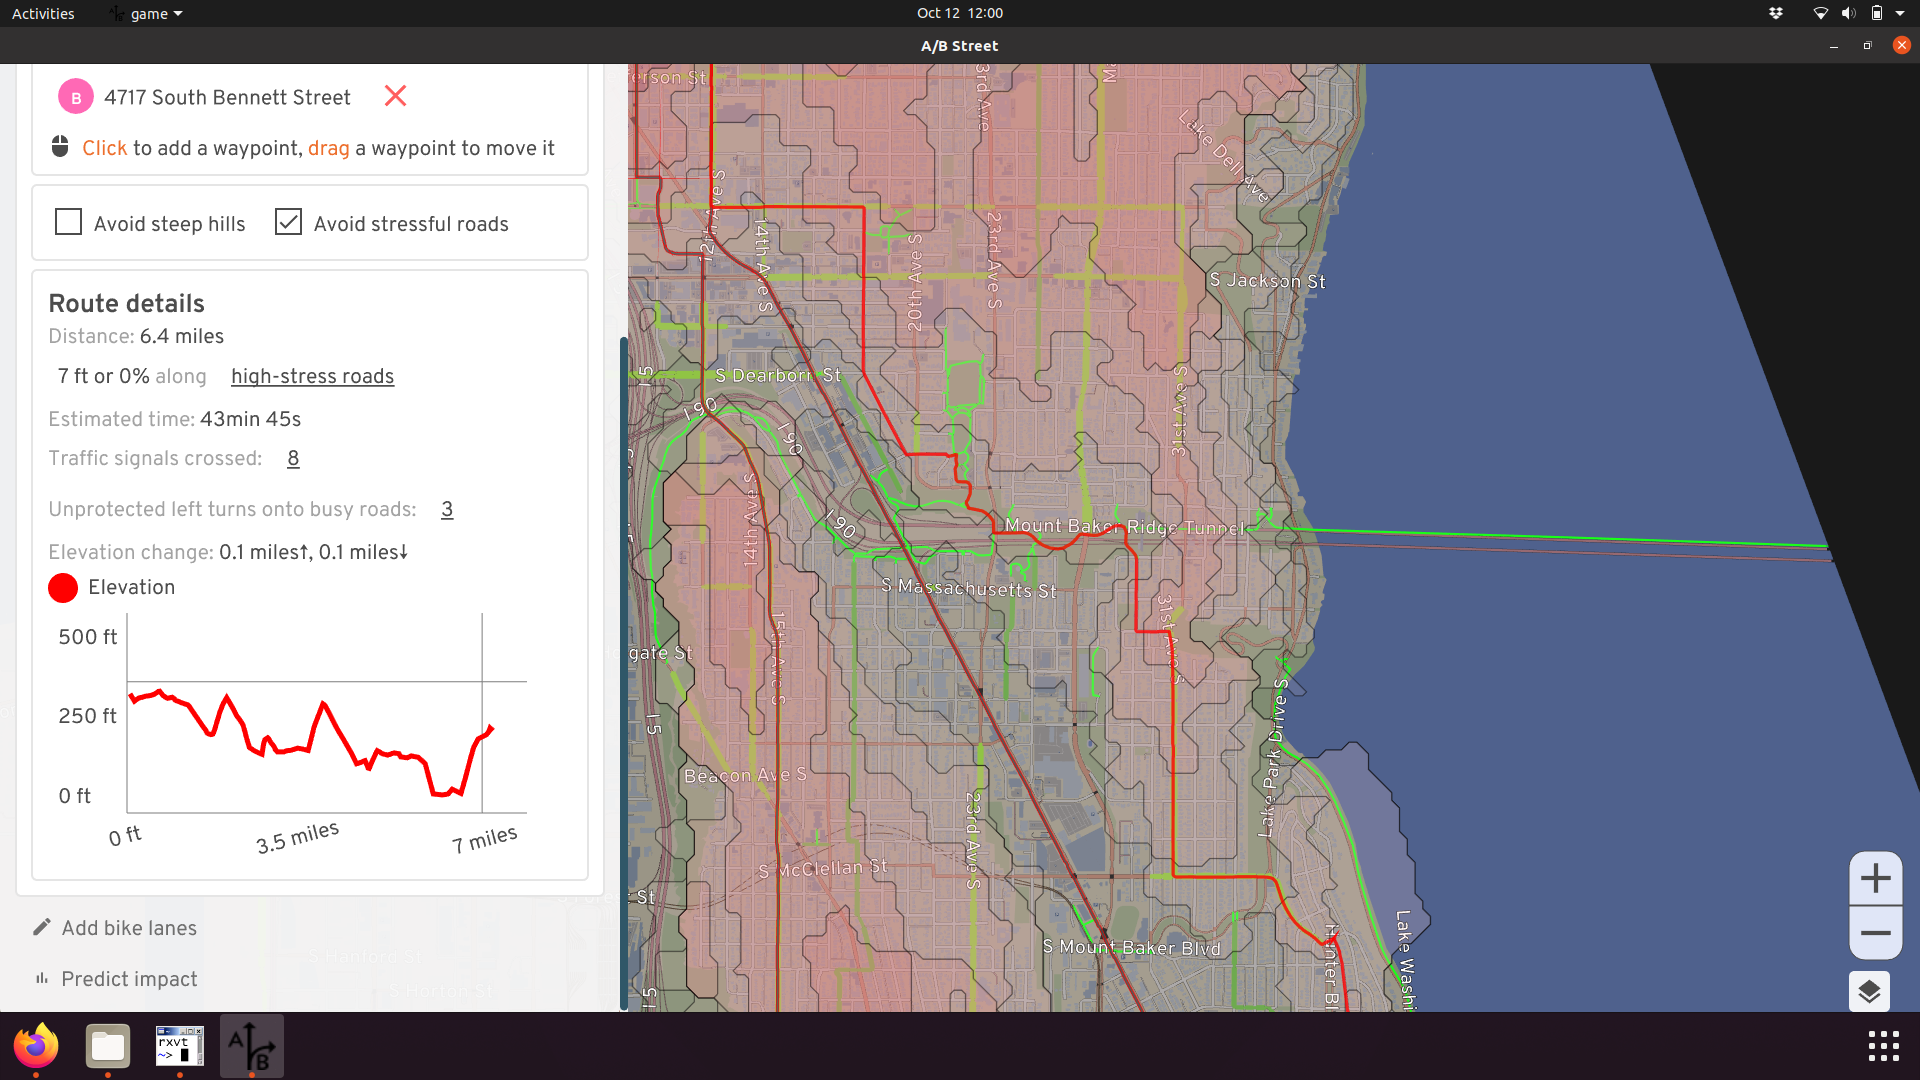
I've biked on Rainier before, fully aware it's called Seattle's most dangerous road for a reason. In most places, it's a massive 5 lanes, meaning there's plenty of room to add some protected lanes, giving more people easy access to the many businesses along the corridor:
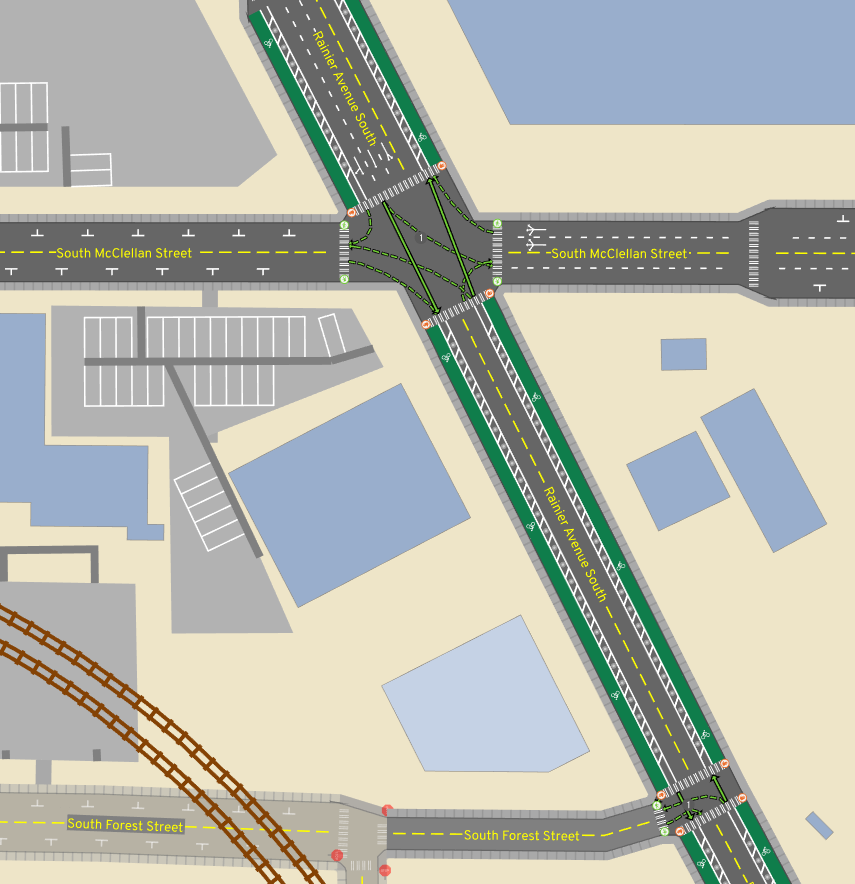
I've ended the changes at Orcas, since I'm not familiar with what's south of that and might be a useful connection.
For more ideas about the current gaps in South Seattle, see this list.
Eastlake Ave
Eastlake would be the de facto route between the university district and downtown, if it weren't for the intermittent mess of parked cars currently. Shoulder space to avoid traffic appears and disappears, and some of the parking is even supposed to be banned during rush hour. I believe as part of the RapidRide J plan, Eastlake is supposed to get some dedicated lanes! Until then, we can imagine how awesome it'll be:
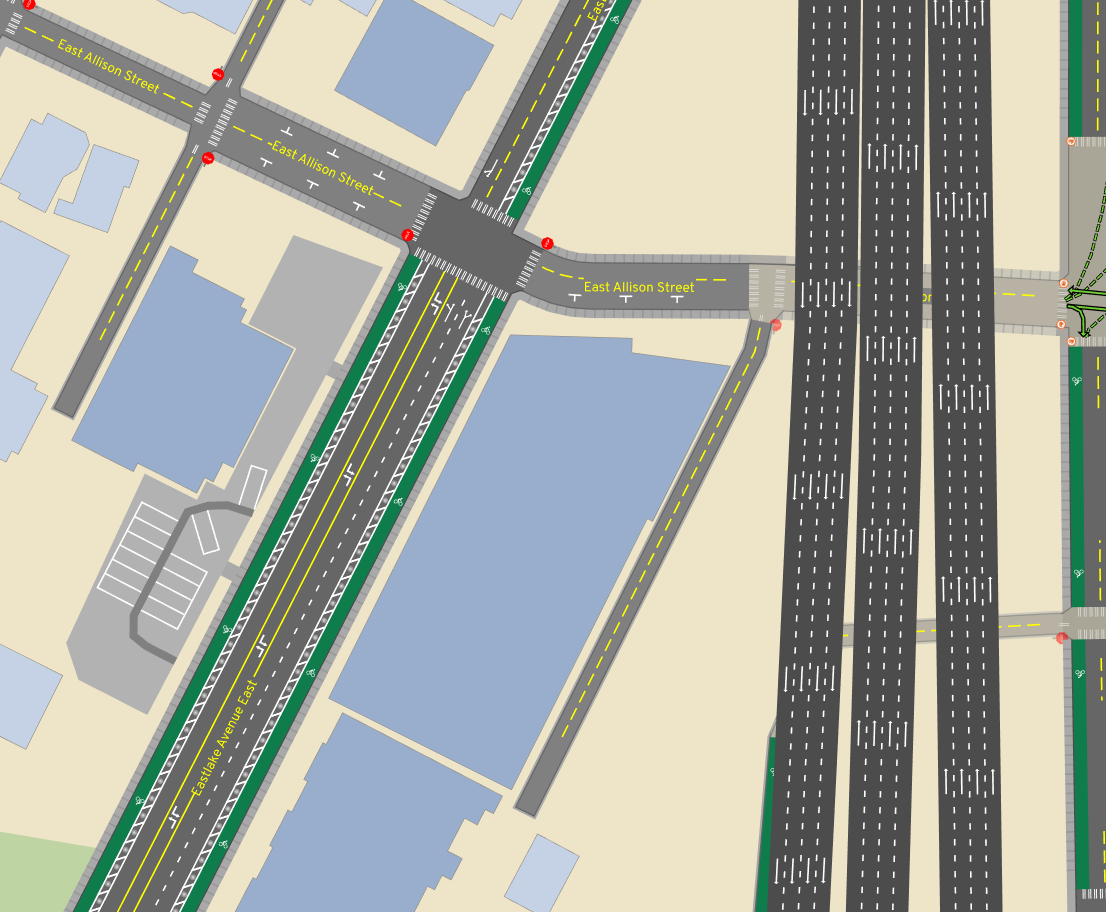
Of course, RapidRide J will bring bus lanes, here's a more accurate future.
The alternative today is following the Cheshiahud Loop loop through neighborhoods. It's nice and scenic, but weaves through steep alleyways -- not a commuter route.
Lakeview
One reasonable way to access lower Capitol Hill or downtown from the university district area is along Lakeview. This makes use of a nice bike-only connection near Melrose, and pops you out right into the heart of a commercial area. The gap is near the I5 colonnade. Currently this is one lane each direction, with parking usually on both sides. There's an I5 exit in the middle. So in practice, this nonsense happens:
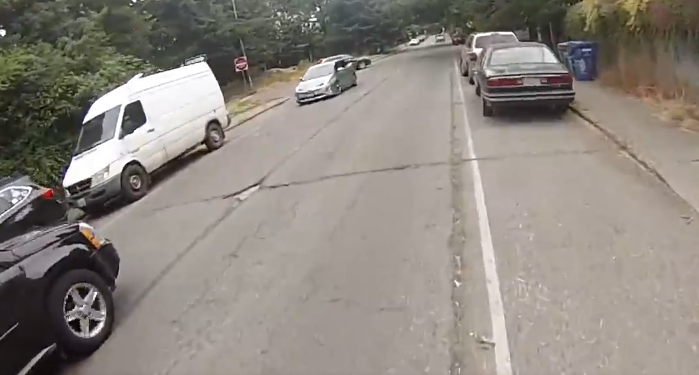
Just nuke the parking and add bike lanes. I'm not sure what to do with the Boylston Ave portion. There's a physical median there today, making the lane pretty narrow, and I've heard stories about really aggressive cars squeezing past at high speed. There is parking on the west side of that street, so potentially that could be sacrificed and the median shifted over, to dedicate shoulder space for biking on both sides.
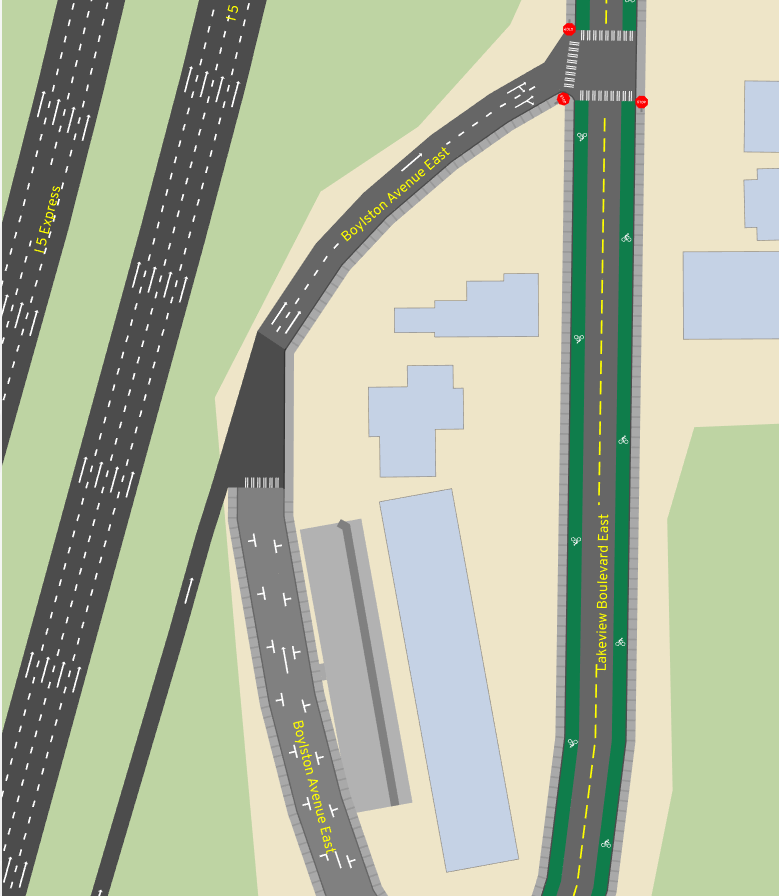
Harvard from Shelby to Roanoke
If you're crossing the university bridge and want to go to Capitol Hill, you're probably taking Harvard to Roanoke to Broadway:
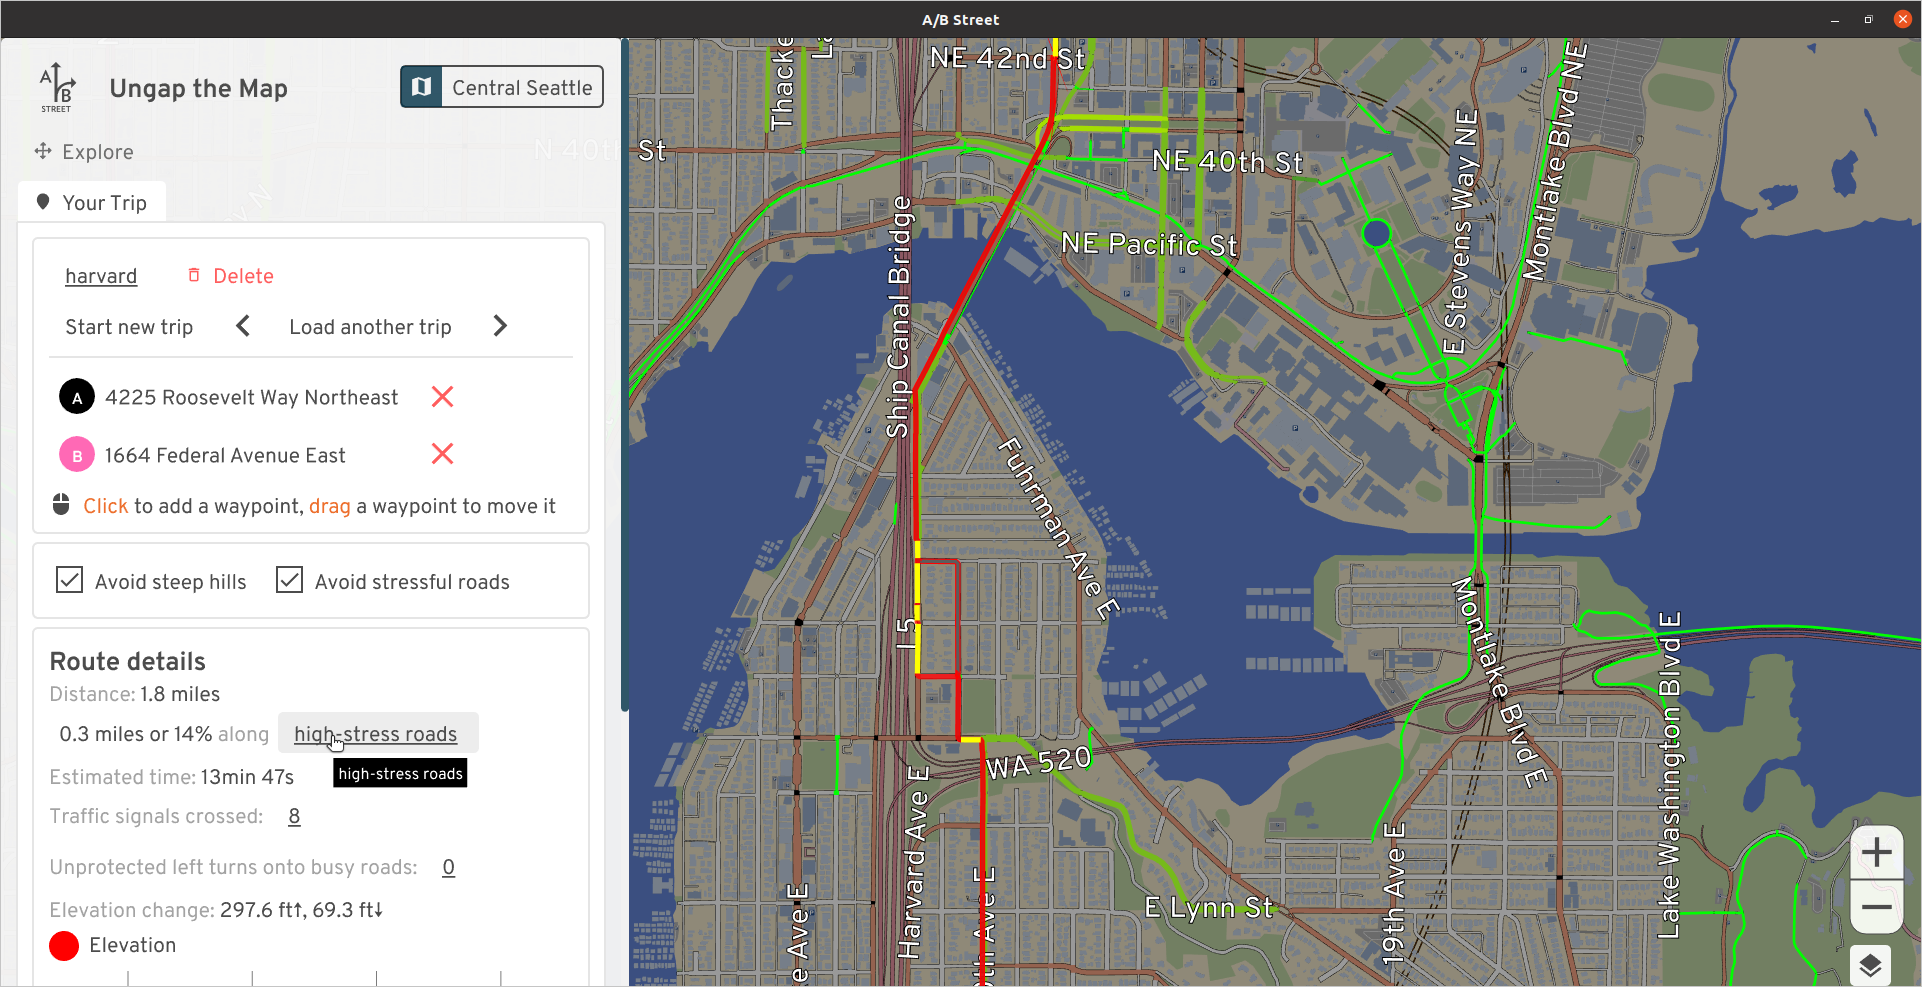
There's a climbing lane up Harvard, but it just gives up at Shelby. There are two full lanes at this point and is usually OK, but I've had a few stressful experiences with aggressive vehicles. There's just one driving lane uphill before Shelby, so why not just keep it that way, or make it a bus/bike lane for Route 49?
The quieter route is to cut into the neighborhood and make use of the diagonal diverter at Broadway and Edgar. You'll have to press the beg button at the south end of Roanoke Park to continue up the hill.
Broadway between Highland and Denny
South of the light rail, Broadway has a protected two-way cycletrack and north of Highland, there are painted lanes. But inexplicably they vanish between Highland and Denny. If you want to dodge less cars, you can cut onto Harvard, a much bumpier street without any businesses along it. Why not take out the center lane and extend the cycletrack or the painted lanes on both sides?
The street parking along this stretch is usually pretty full, and often trucks use the center lane as a makeshift loading zone. This is a commercial hub and should still have a way to drive and park here, but given how well-connected the area is by public transit, I don't think prioritizing parking makes sense.
The Missing Link
The Burke Gilman trail, which is probably the highest-traffic walking/biking path in Seattle, has had a missing link literally since the 90's. I'm not going to weigh in on the debate on exactly how this should be fixed; I've just put it on Shilshole. Maybe we'll see it completed in another 30 years.
Airport Way S
Once upon a time, I made the mistake of biking to Fedex in SODO during afternoon rush hour (the narrow window when you can retrieve packages). I took Airport because it's flat and direct, and there was plenty of room for cars to pass -- there's a pretty generous shoulder. But even though I was gunning it and keeping pace with the stop-and-go traffic, there were still some vehicles that insisted on flying across the 15-foot lane and almost swerving into me. So, I'd like to add a protected lane here:
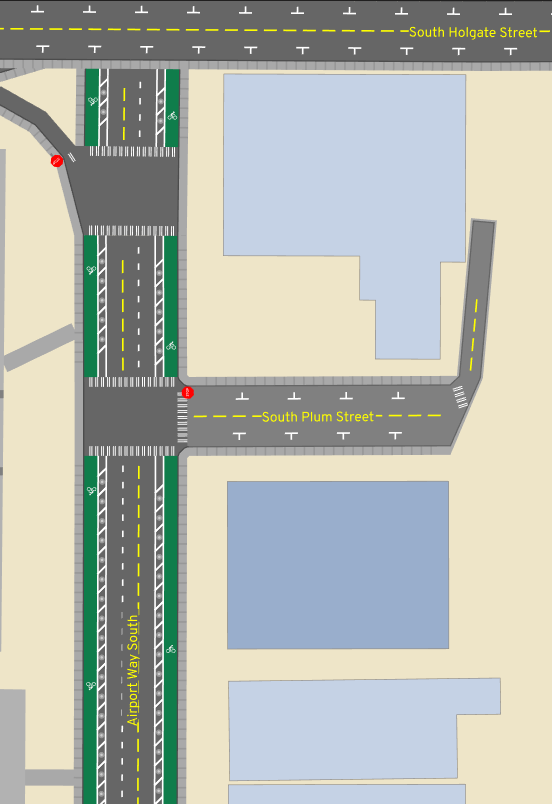
Note the edits show a driving lane taken away, but that's just because we don't have accurate road width data. There's enough room to keep all the lanes, and add some paint and barriers to the shoulder.
Why didn't I take the SODO trail and 6th Ave S? (Well, I certainly did on the way back!) Honestly, I was just following Google Maps routing (which doesn't have an option to avoid high-stress roads), and getting to the SODO trail from the international district is more confusing than following the natural path onto Airport. Maybe some wayfinding could help.
Others
This has been a very modest "vision" map. Part of me wants to just add lanes on every arterial, but then I'd have to write about the nuances of each of these cases. Nonetheless, a few other areas I considered:
How're you supposed to comfortably go east/west in north Seattle? After living in Lichton Springs for a while, I probably cut through different sequences of residential streets every single ride. Looking at a contour map, 75th looks like a candidate, but I'll have to go try it out.
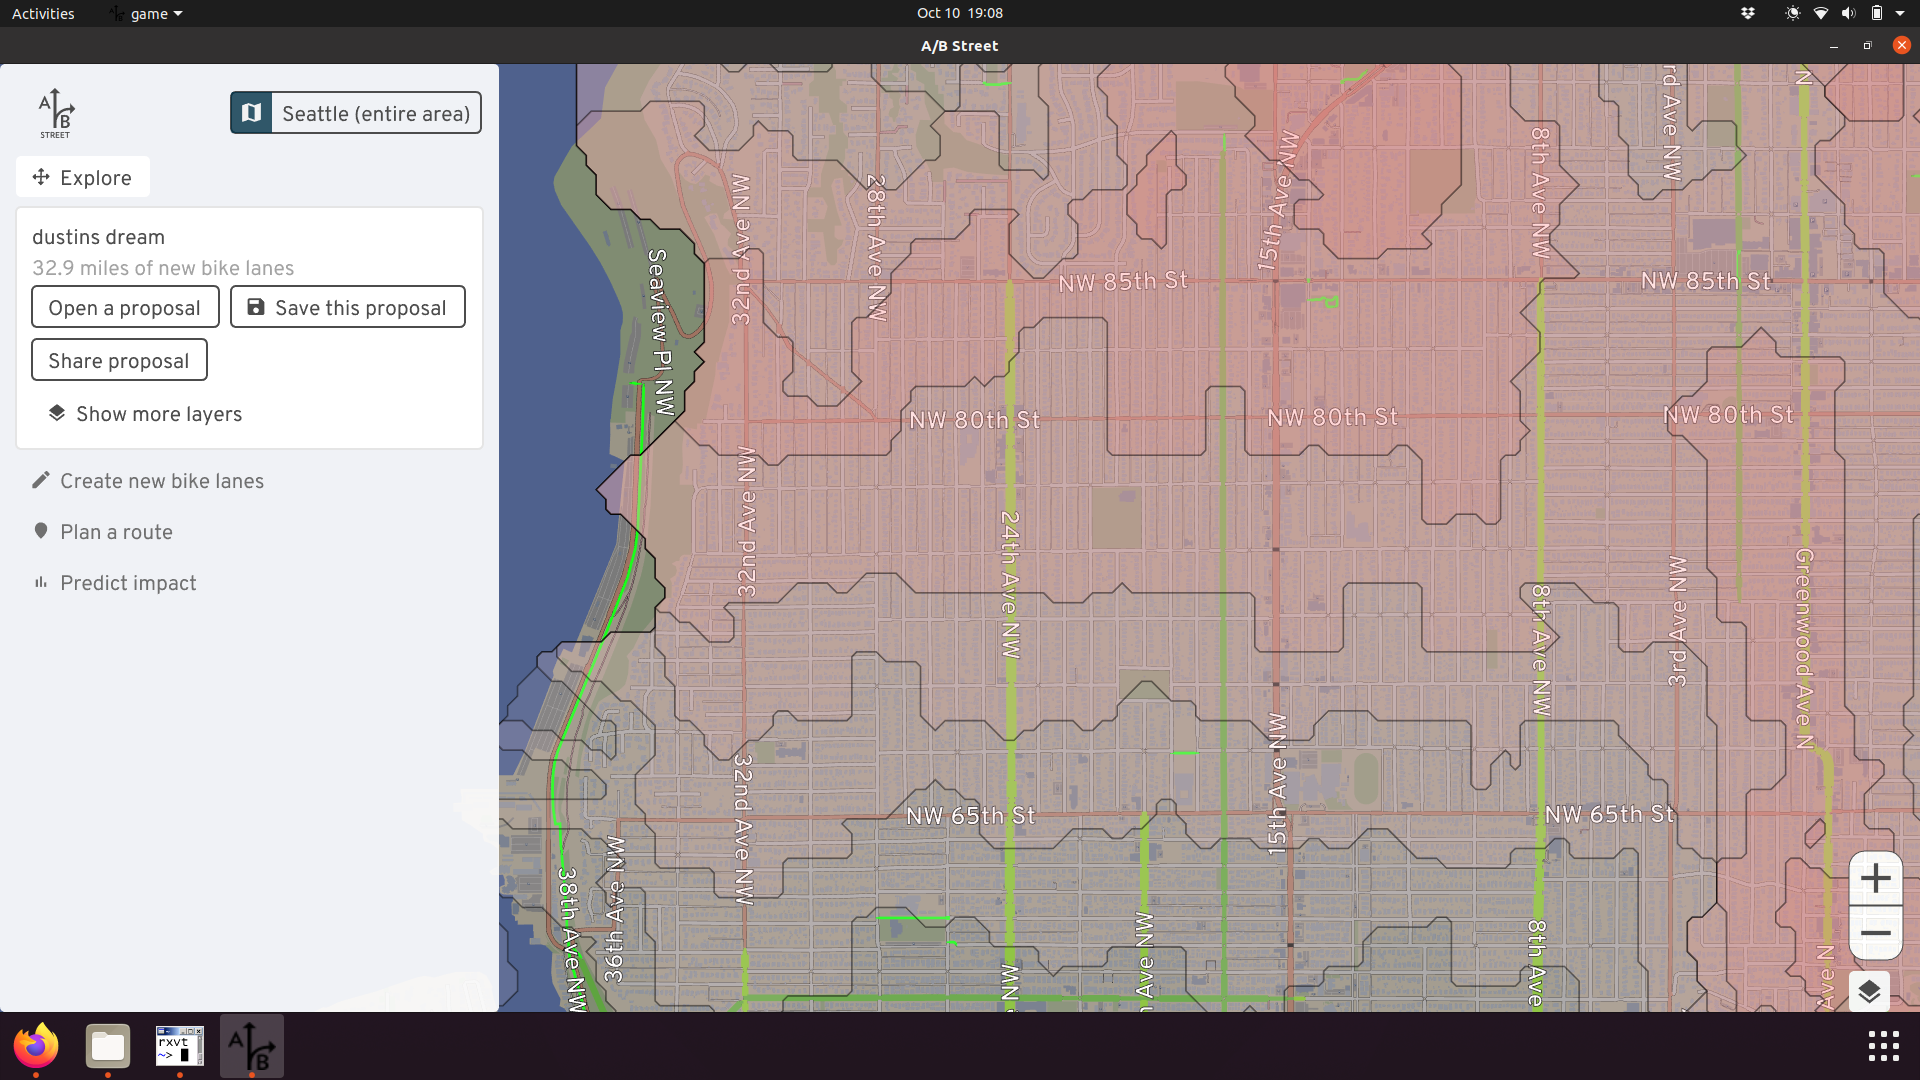
It's ridiculous to me that Lake Washington Blvd from Montlake all the way to Seaward isn't better designed for biking; it's part of the Lake Washington loop, and loads of people ride it. Greenways successfully fought for a Keep Moving Street that had loads of usage, but it ended after September.
Going from Ballard to downtown, normally I'd just take the scenic Elliot Bay trail through to Centennial Park, but once I had an errand somewhere around 15th Ave NW and Elliot. That's another huge road through a commercial area that probably deserves some protected lanes.
Estimating how much these might help
The software includes a tool to predict the impact of all of these changes to the region's current travel patterns. There's lots of assumptions and limitations with the calculation that you should read and mutter quietly to yourself about, but nonetheless, what's the verdict?
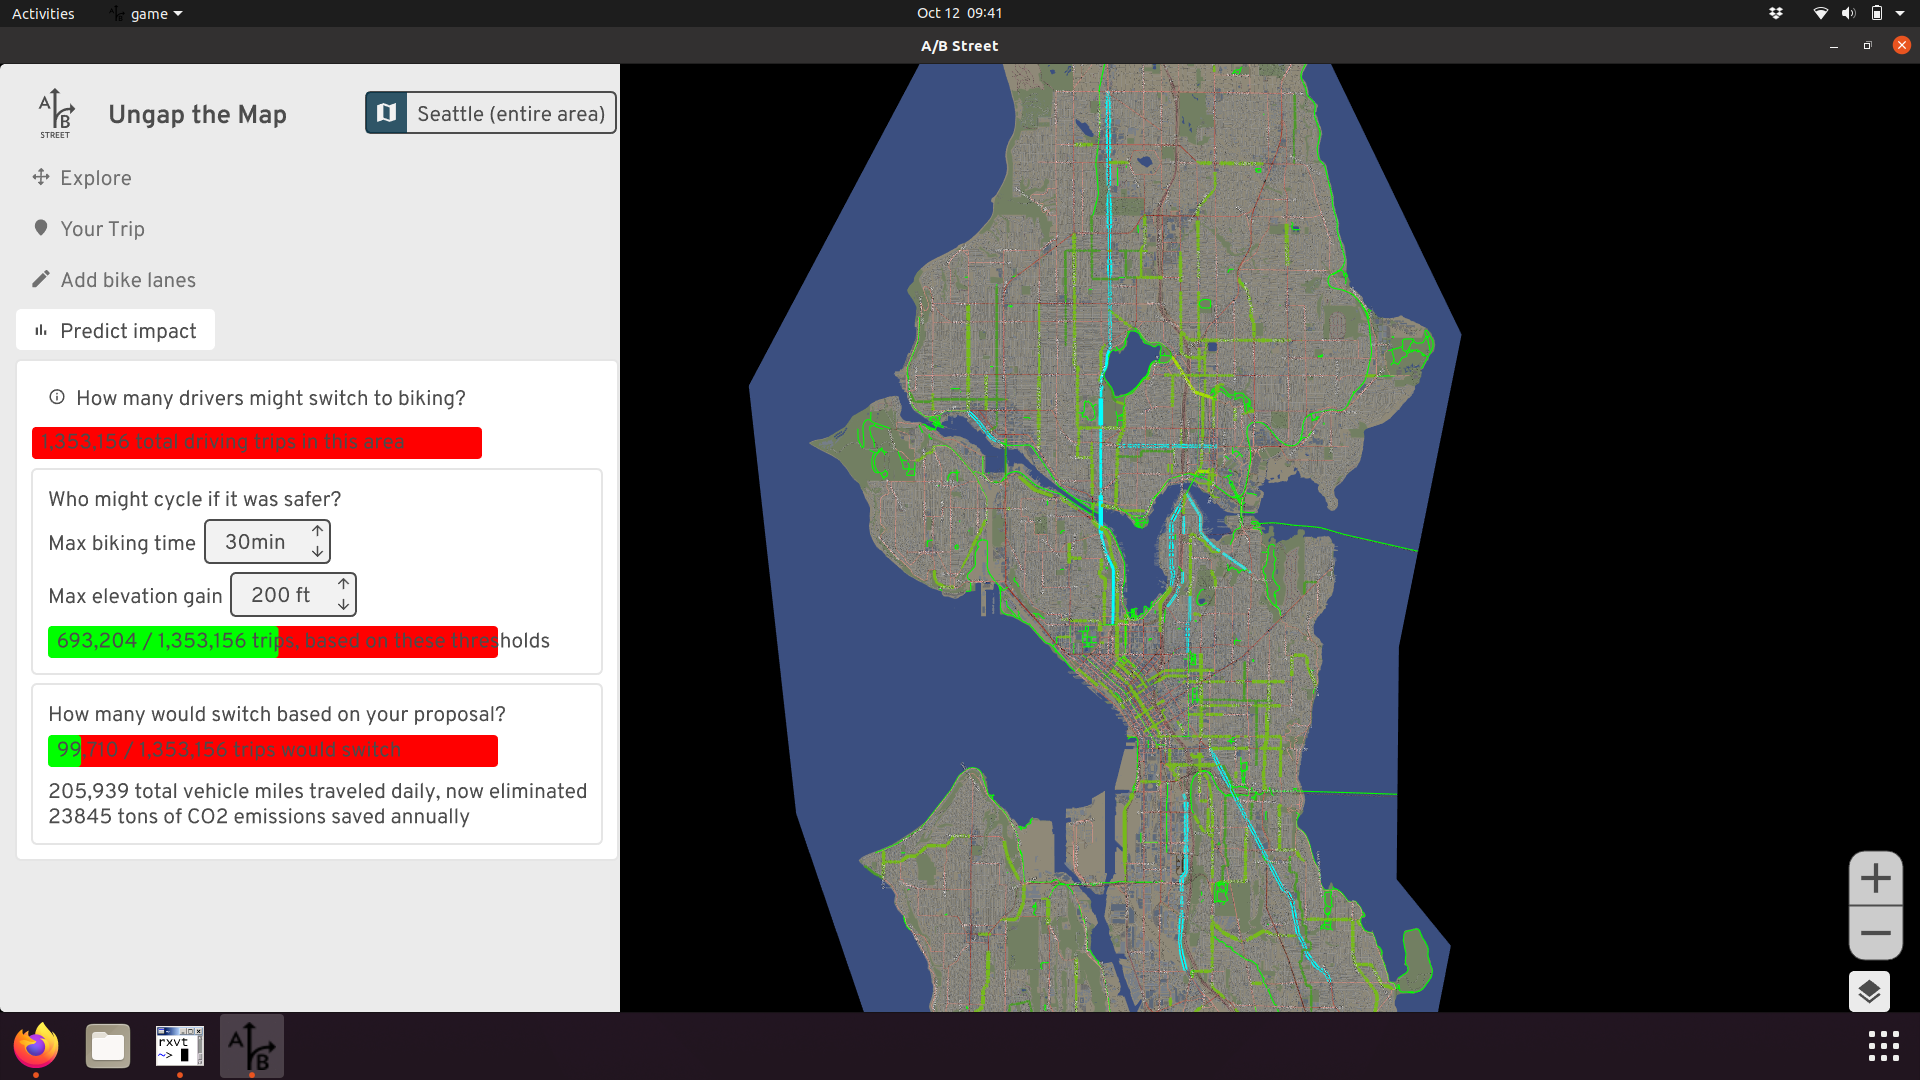
These 30 miles of new lanes could sway about 100,000 daily driving trips (about 7% of trips that stay within this part of Seattle and don't just pass through) to bike instead. That's assuming people will only tolerate up to a 30 minute ride with no more than 200 feet of elevation gain. If these driving trips all choose a more sustainable mode every weekday for a year, that's roughly 23,000 tons of CO2 emissions saved. It's a start.
Thanks for reading this far. Please share your feedback about these ideas and the new tool, and more importantly, your own vision for what biking in Seattle could be!
Allow bike and foot traffic through Broadmoor
posted July 1, 2021 by Michael Kirk — meet the A/B Street team
You could be forgiven for not knowing much about the Broadmoor neighborhood in Seattle — that's kind of by design. We're going to explore how it could become a valuable link for people walking and biking in Seattle, using the travel simulation game A/B Street.
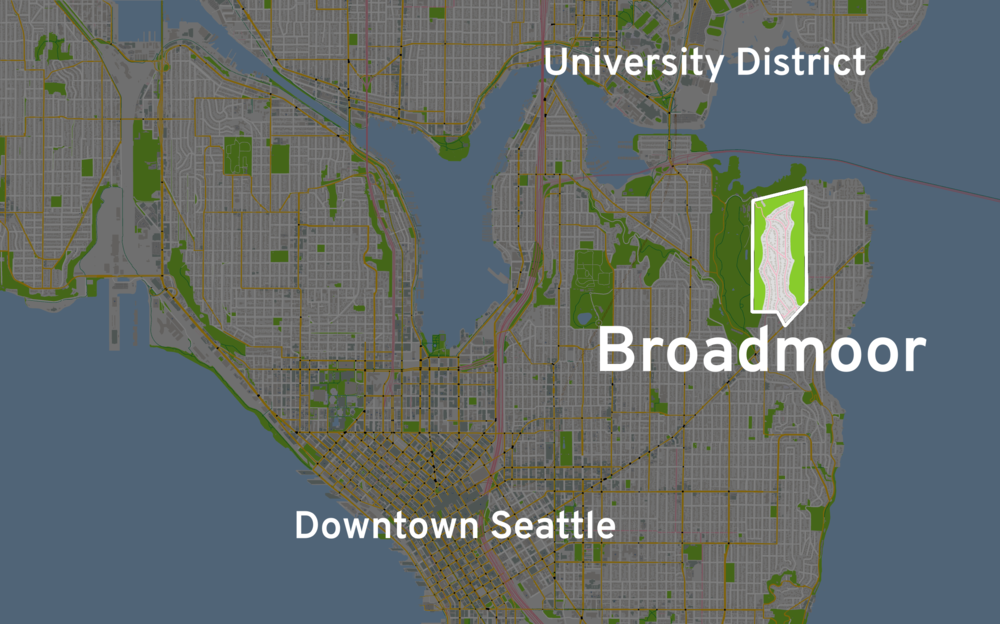
Broadmoor lies a few miles northeast of Downtown Seattle, sandwiched between the delightful Washington Park Arboretum and the Madison Park neighborhood.
Adjacent to Broadmoor, the Madison Park and Washington Park neighborhoods offer grocery stores, a hardware store, dining, and recreational destinations.
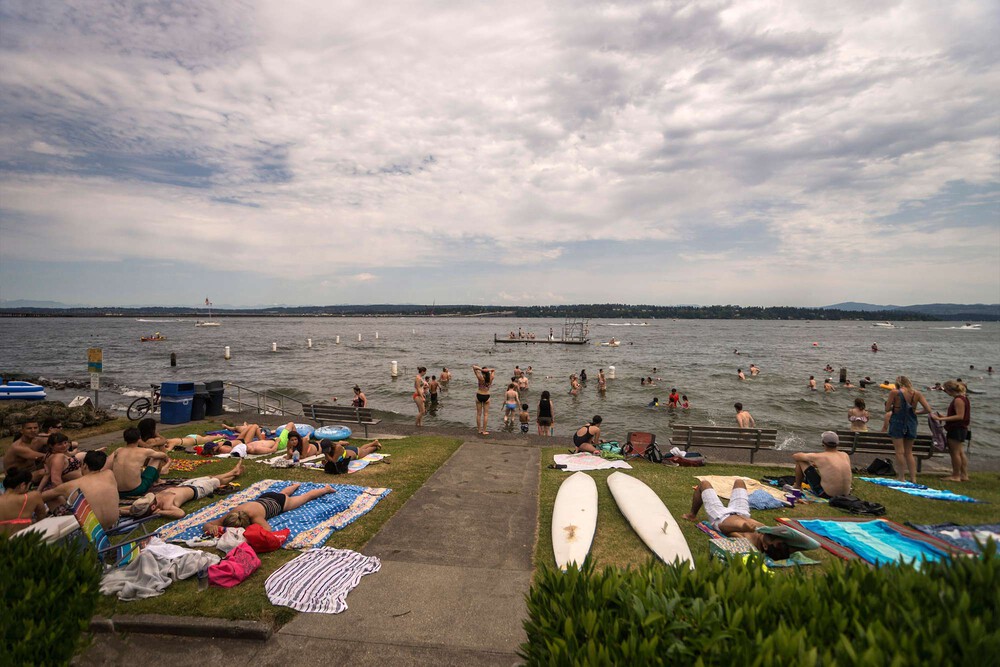
Madison Park Beach on Lake Washington is another notable neighborhood destination.
photo courtesy of the City of Seattle
If you were headed to one of these destinations today, and coming from, say Montlake or from the University District via the University bridge, it would almost certainly require you to take a long stretch walking or biking down East Madison Ave. This particular stretch of road is known to be high stress for people on bikes, and can be an equally harrowing walk for those on foot.

If people were instead allowed to walk or ride through Broadmoor, they could expect shorter trips on quieter streets.

Looking at elevation, the green route along Madison Ave climbs an 8% grade — quite steep! The blue route through Broadmoor offers a shorter, less steep, route.1
So why don't people take this seemingly superior route through Broadmoor? Apologies if you already have the context, but a greatly abridged history lesson is in order for those who don't.
Up until about 200 years ago, what we refer to as Broadmoor, like much land near the Puget Sound, was a forest inhabited by the Duwamish people. And, like much land near the Puget Sound, it was cut clear, and the timber sold off by a mill company. The owners of this particular parcel were the Puget Mill Company. After logging the parcel, they split it, not quite in half. The smaller western half was given to the city, and gardened into what is now enjoyed by the public as the Washington Park Arboretum. The General Manager from the very same Puget Mill Company was then allowed to develop the larger eastern half of the parcel into that venerable American trifecta: a golf course / country club / private gated residential community.2
So, Broadmoor was initially built as a gated enclave impassible to all but a select few of the leisure class. A century later, how much has changed?
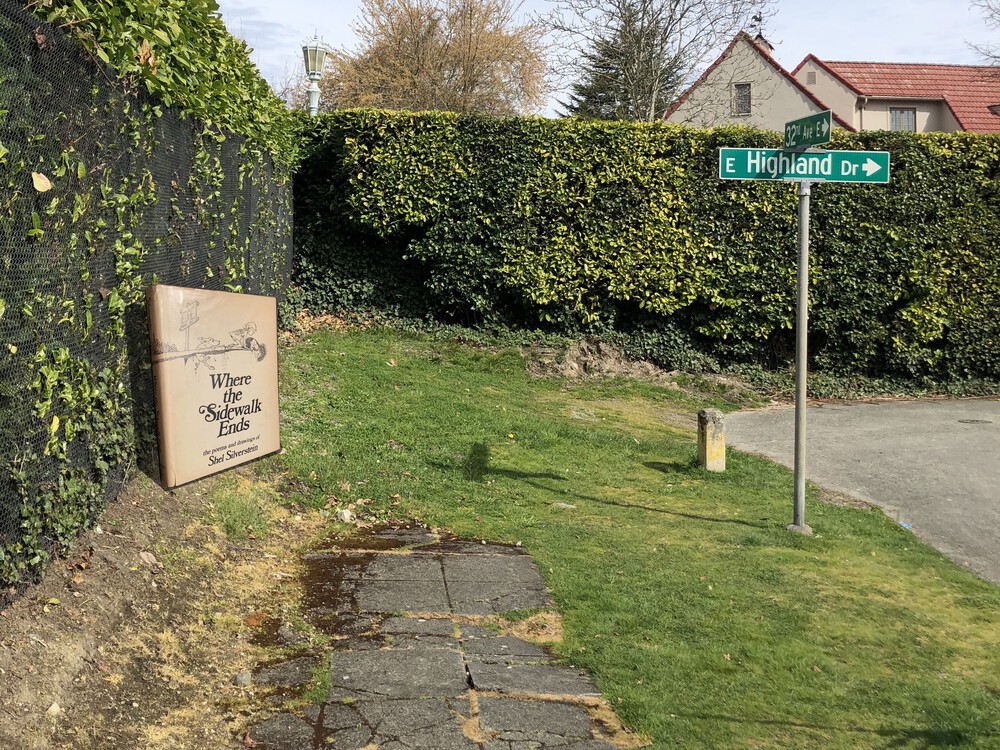
Try to walk through or around Broadmoor today, and you'll find yourself repeatedly redirected or inexplicably dead-ended.
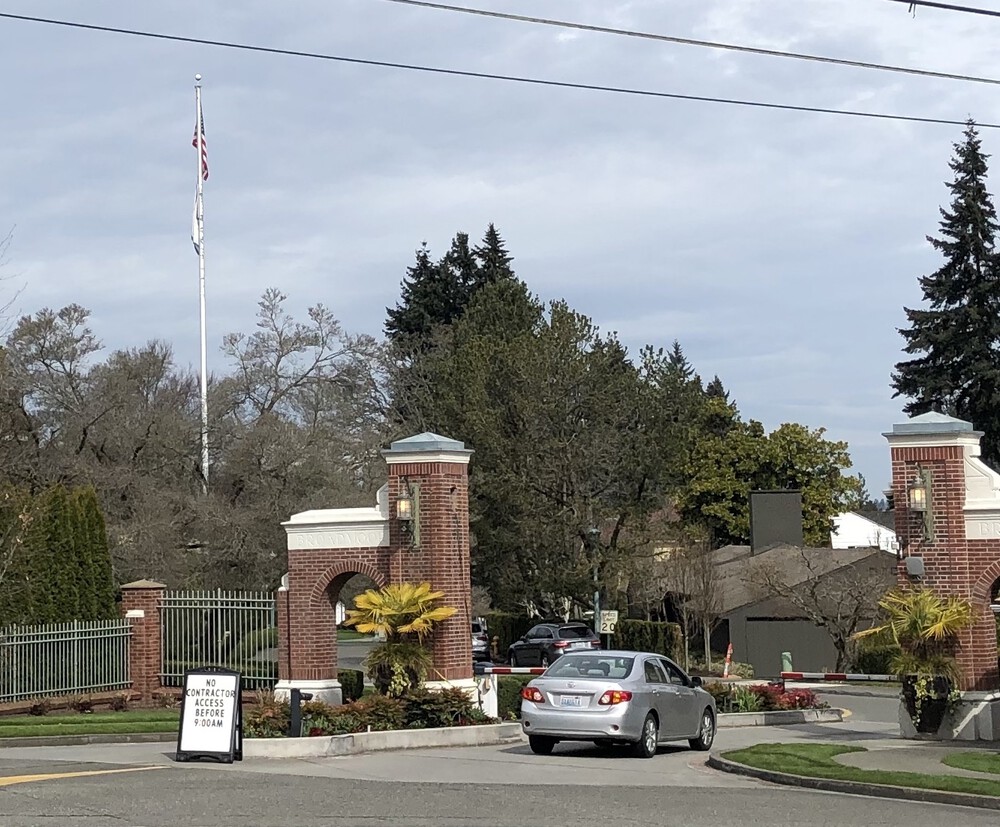
There are gates on the north and south ends of Broadmoor. Both are guarded by uniformed security.
Broadmoor is an obstacle to people walking and biking to desirable destinations on either side of it. But what if things were different? What if we allowed people on bikes, on foot, and in wheelchairs through Broadmoor rather than diverting them down Madison Ave?
Cui bono
To get an intuition for the benefits that opening up Broadmoor might have, we turn to A/B Street. If you have an idea for a change in your city streets, A/B Street can visualize that change and measure its impacts.
If you've never seen A/B Street before, here's what it looks like:
A/B Street uses public data sources, like OpenStreetMap and Seattle's Soundcast Travel Demand Model to simulate travel in the city. You can gain insight into your proposal by comparing metrics like travel duration and risk exposure as they are affected by your proposal.
In A/B Street, allowing people to walk and cycle through Broadmoor, is a matter of clicks. Then, A/B Street simulates how this change affects people's travel. You can watch as each individual person goes about their day. If given new circumstances, people will be able to make new, hopefully better, choices for themselves.
To gain a little intuition for the benefits of our proposal, let's follow one person in A/B Street on her morning walk from Madison Park to the University District, comparing the trip before and after being allowed to walk through Broadmoor.
Some of the highlights of her trip include a much calmer walk through Broadmoor as opposed to crossing along the many busy intersections on Madison Ave.
Beyond anecdotes
The morning commute shown above is good for story telling. It's an intuitive anecdote for why this could be a worthwhile proposal. However, travel behavior is highly interdependent. Every choice one person makes has potential ripple effects for others.
We need more than a handful of individual examples. A/B Street uses Seattle's Soundcast travel demand model to generate a realistic set of workday trips for the given area — for this area, that's about 75,000 trips. A/B Street includes tools to analyze each of these trips and aggregate overall travel experiences — allowing us to see beyond anecdotes to visualize trends across the map. Let's take a look at how overall trip times and some safety metrics are affected by this proposal.
Trip Durations
Cars: Individual Trips
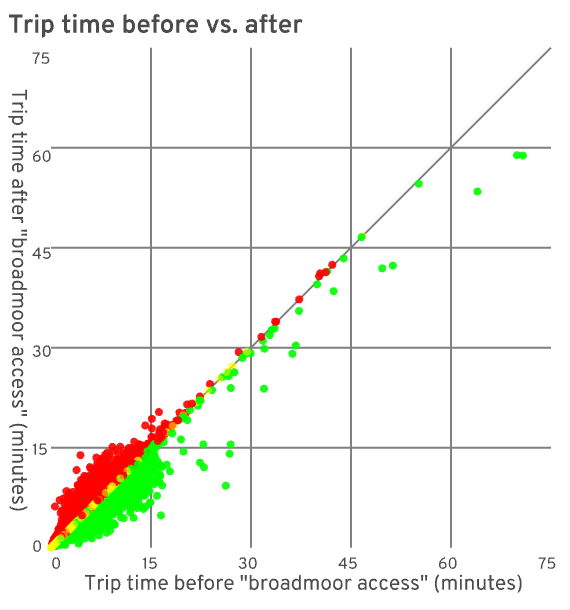
Comparing each driver's trip time before vs. after this change, some trips were a little faster, while others a little slower.
There appears to be a small positive bias, perhaps due to less contention on Madison, but overall it's mostly a wash for drivers, which is a boring, but useful validation.
Walking and Biking: Individual Trips
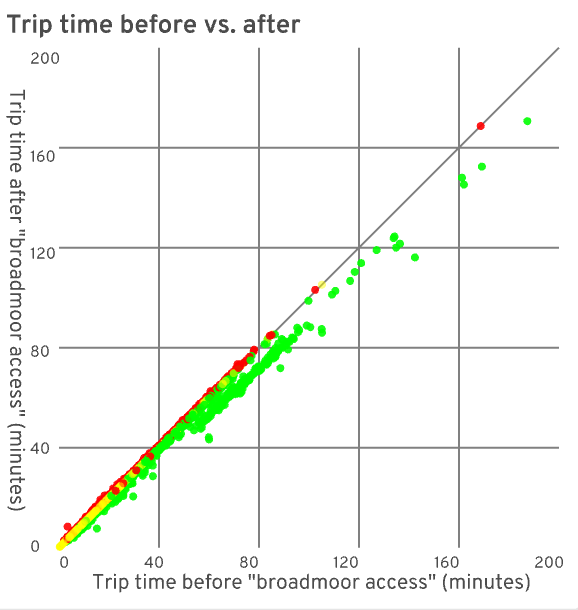
It gets more interesting for people walking and cycling. Especially for longer trips, people get where they're going more quickly after being allowed access through Broadmoor, with few trips experiencing a slowdown.
Apart from the benefits conveyed to pedestrians and cyclists, these charts also nicely show the interdependent nature of travel. For example, even though overall travel time and the routes available to drivers didn't change much, individual drivers did experience downstream effects of pedestrians and bicyclists making different choices. This interdependence is fertile soil for unintended consequences, which is why having tools to measure overall impact is essential.
Time Saved / Lost
The dot charts above are helpful for seeing the shape of some trends, but it's hard to quantify the improvements. These next charts compare the total amount of time saved across all trips with the total amount of time lost.
Cars: Overall
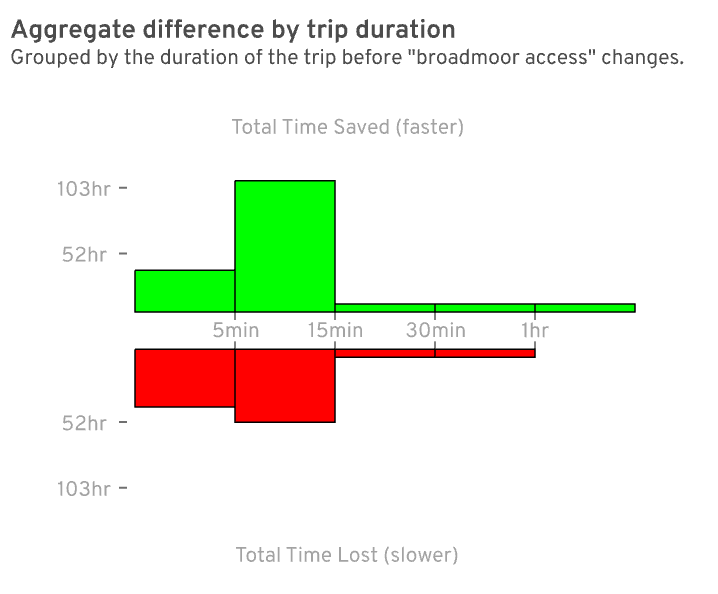
Here we can confirm the small bias for faster car trips, but not much more time is gained than was lost by others, implying a mostly neutral change across all people driving.
Walking and Biking: Overall
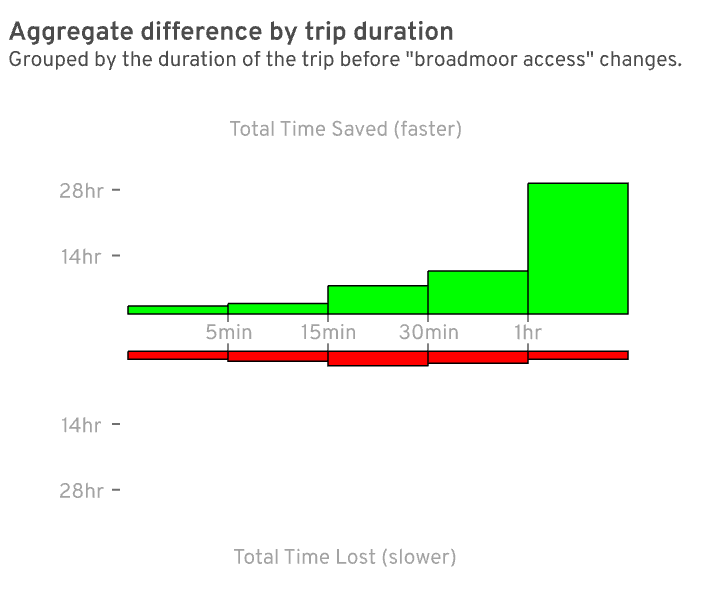
A clearer trend emerges for people walking and biking — many long trips were substantially faster given access to Broadmoor.
Trip duration is worth considering as a gut check to make sure a proposal seems reasonable, and this proposal indeed has some favorable evidence for faster trips, but trip duration shouldn't be the only, or even most important, effect to consider. In particular, there are important safety metrics we can measure with A/B Street which we'll dive into next.
Safety
All people should be able to get where they're going safely. As our most vulnerable road users, people walking, bicycling, and those using mobility aids deserve extra consideration.
There is an increasing effort to not only look at previous crash sites, but also to consider the types of places where crashes are likely to occur. By prioritizing places based on their similarity to crash sites, we can prevent or mitigate future crash sites before someone is hurt. In this vein, last year Seattle DOT released a safety study analyzing which physical roadway features that are associated with an increased risk of traffic-related death or serious injury.
For example:
Right hook crash risk tends to be higher on arterial streets. [...] This could be due to the overall complexity of the intersection and/or the width of the intersection.3
By classifying these risky features, A/B Street can keep tabs as people in the simulation are exposed to these risks. You can follow an individual's trip and see what risks they are exposed to, or, for a macro view, you can aggregate and identify map-wide hot spots for specific problems. Using A/B Street, you can compare how a proposal affects these metrics.
Identifying Hotspots

A/B Street's "problem" view helps you identify risk exposure hotspots.
These streets south of the Montlake Bridge exhibit several risk factors, including wide streets with fast moving vehicles and many-legged intersections.
Because the Montlake Bridge is one of only a couple plausible connections between the University District and central Seattle, it has relatively high bike and foot traffic.
The inherent riskiness of these kinds of streets, paired with the high number of people using them, results in a risk exposure hotspot worth extra scrutiny.
Walking: Arterial Intersections

Walking across arterial (wide, busy) intersections presents an increased risk of death or severe injury. This chart groups walking trips by duration and by how many fewer (or more) arterial intersections were crossed.
More than 800 walking trips had fewer arterial intersections to cross when they were allowed to pass through Broadmoor.
The chart shows that medium-to-long trips were most affected. For example, 518 people walking 30-60 minutes had 1-6 fewer arterial (major) intersections to cross.
Biking: Car Wants to Overtake

A 2018 study found that most cyclists who died in single-vehicle crashes were struck by the front of the vehicle4.
In shared lanes, a common risk that could lead to this type of collision is when a faster moving car pulls up too close behind a cyclist. This is uncomfortable for both the person on the bike and the person driving. Having the option to ride through Broadmoor gives some cyclists the option to avoid sharing a lane with cars on busy Madison.
Biking: Complex Intersections
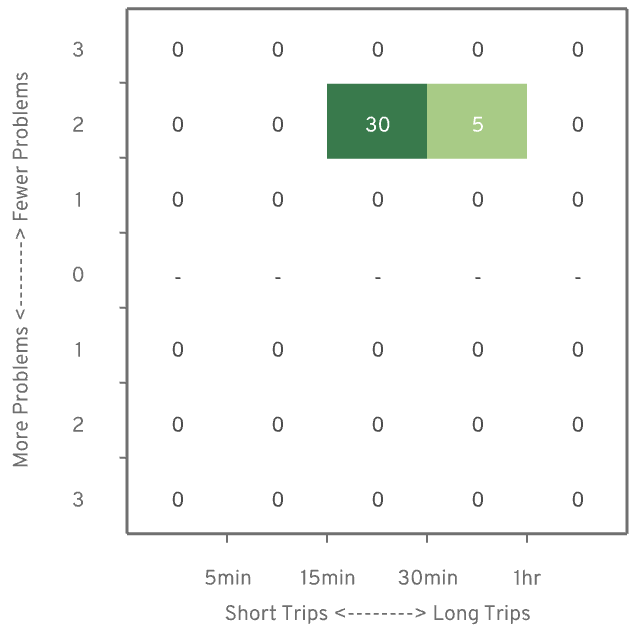
Simple intersections are where just two roads cross. Passing through a complex intersection, where more than two roads cross, has an increased risk of death or severe injury for people on bikes3. Being able to cycle through Broadmoor was a strict improvement for this metric.
This was a quick overview of some of the tools A/B Street has for measuring baseline safety metrics and seeing how your proposal affects them. We're continuing to add metrics and visualizations, but we'd love to know if there are any you'd specifically like to see.
What's next?
Using a tool like A/B Street is absolutely not a definitive evaluation. It's intended to get you started tinkering.
By identifying and measuring things we care about, and simulating how they change, we can quickly gain some visual intuition and quantified evidence to validate (or refute) assumptions in our proposal, and hopefully it's a little fun too.
Here we've shown there is at least some evidence that letting people walk and bike through the Broadmoor neighborhood in Seattle could result in faster, safer, and more pleasant trips without unduly impacting other traffic.
If you'd like to see for yourself what the Broadmoor proposal looks like, give it a try, you can run A/B Street in your browser or download the desktop client.
Or, if you have a different idea for improving how we get around, in Seattle or elsewhere, give it a go! Please contact us on twitter or github if you have any questions or issues.
Caveats
It bears repeating: A map is not the territory. The signifier is not the signified. A simulation is not, and can never be, the actual world.
But like a good map or a good metaphor, a good simulation can be a useful tool for learning and advocacy. Beyond the shortcomings inherent to any such semiotic excursion, there are a couple of limitations we wanted to call out in this case study in particular.
Data sources
The underlying road network is inferred from OpenStreetMap (OSM), a global community of mapping enthusiasts whose software and data is freely available. Using OSM, A/B Street is already usable in cities all over the globe. However, as a freely available community maintained project, OSM comes with no data quality guarantees, and local mapping conventions can vary. Not everyone using OSM is interested in the incredible level of detail required to run a travel simulation. This situation is ever improving though, and we'd love to have you give A/B Street a try, wherever you are.
A/B Street leverages Seattle's Soundcast travel demand model to generate the list of trips for each person in A/B Street. Specifically, for each person, Soundcast is responsible for saying where they need to be and at what time. Soundcast is also responsible for what mode the person takes - whether they walk, drive, cycle, etc.
Modeshift
Intuitively if you make driving more attractive, more people will drive. Similarly if you make a mode like cycling, walking, or transit more attractive, more people will choose that mode.
A/B Street doesn't currently account for this shifting of modes. It naively assumes that people will go about their day, always choosing to drive or walk or cycle regardless of what changes you make to the city. Mode shift is a real and important behavior that we are excited to implement and measure in A/B Street in the future.
There's tons of other improvements in the works. Follow @CarlinoDustin for updates, and let us know what you'd like to see.
Footnotes
Elevation data from King County LIDAR. Thanks to Eldan Goldenberg for processing this data.
Jane Powell Thomas, Madison Park Remembered (J.P. Thomas, 2004)
Seattle Department of Transportation's safety study: City of Seattle Bicycle and Pedestrian Safety Analysis Phase 2
NHTSA | National Highway Traffic Safety Administration - 2018 Traffic Safety Facts
Lake Washington Blvd Stay Healthy Street
Draft, updated May 7, 2020 by Dustin Carlino (dabreegster@gmail.com)
In April 2020, Seattle Department of Transportation started rolling out Stay Healthy Streets, restricting roads to through-traffic to give people walking and biking more space for social distancing. Seattle Neighborhood Greenways soon proposed extending this to a 130-mile network.
Selecting the streets requires some planning:
These streets were selected to amplify outdoor exercise opportunities for areas with limited open space options, low car ownership and routes connecting people to essential services and food take out. We also ensured street closures did not impact newly opened food pick up loading zones, parking around hospitals for service for health care professionals, and bus routes.
I've spent the last two years building A/B Street, software to explore the impacts of changes like this on different modes of transportation. So, let's try implementing part of the proposed network and see what happens!
Lake Washington Blvd
Let's start with one part of the proposal, closing Lake Washington Blvd to cars through the Arboretum. There's already a multi-use trail alongside this stretch, but its width makes it difficult to maintain 6 feet from people. There are some parking lots that become inaccessible with this proposal, but they're currently closed anyway.
First attempt
Let's get started! If you want to follow along, install A/B Street, open sandbox mode, and switch the map to Lake Washington corridor. Zoom in on the southern tip of the Arboretum and hop into edit mode. We can see Lake Washington Blvd just has one travel lane in each direction here. Click each lane, convert it to a bike lane, and repeat north until Foster Island Road.
When we leave edit mode, the traffic simulation resets to midnight. Nothing really interesting happens until 5 or 6am, so we'll speed up time. Watching the section of road we edited, we'll only see pedestrians and bikes use this stretch of road. If we want, we can click an individual person and follow along their journey.
Something's weird though. There's lots of traffic cutting northbound through the neighborhood, along 29th, Ward, and 28th. We can open up the throughput layer to find which roads have the most traffic. More usefully, we can select "compare before edits" to see what roads are getting more or less traffic because of the road we modified. As expected, there's much less traffic along Lake Wash Blvd, but it's also clear that lots of cars are now cutting through 26th Ave E.
Traffic calming
Let's say you want to nudge traffic to use 23rd Ave, the nearest north/south arterial, instead. (A/B Street is an unopinionated tool; if you have a different goal in mind, try using it for that instead.) In this simulation, drivers pick the fastest route, so we could try lowering speed limits or make some of the residential streets connecting to Madison one-way, discouraging through-traffic. In reality, the speed limit changes could be implemented through traffic calming or cheap, temporary alternatives.
Next steps
I'm working to model "local access only" roads in A/B Street, and I'll describe how to measure the impact on travel times. Stay tuned to see more of the proposed network simulated, and get in touch if you'd like to help out!
Technical details
This section of the site is intended for anybody who wants to understand or work on A/B Street's internals.
Developer guide
This guide is meant for people who want to work on A/B Street's code. In most cases as a user, even for importing new cities, you shouldn't need to bother with any of this.
Getting started
You will first need:
- Stable Rust, at least 1.71. https://www.rust-lang.org/tools/install.
- On Windows, you may need Visual Studio 2019.
- On Linux,
sudo apt-get install libasound2-dev libxcb-shape0-dev libxcb-xfixes0-dev libpango1.0-dev libgtk-3-devor the equivalent for your distro
One-time setup:
-
Download the repository:
git clone https://github.com/a-b-street/abstreet.git -
Grab the minimal amount of data to get started:
cargo run --bin updater -- download --minimal -
Run the game:
RUST_BACKTRACE=1 cargo run --bin game --release. On Windows, set environment variables like this:set RUST_BACKTRACE=1 && cargo run --bin game --release
Development tips
- Generated API documentation
- Compile faster by just doing
cargo run. The executable will have debug stack traces and run more slowly. You can docargo run --releaseto build in optimized release mode; compilation will be slower, but the executable much faster. - Some in-game features are turned off by default or don't have a normal menu to
access them. The list:
- To toggle developer mode: press Control+S in game, or
cargo run -- --dev - To warp to an object by numeric ID: press Control+j
- To enter debug mode with all sorts of goodies: press Control+D
- To toggle developer mode: press Control+S in game, or
- You can start the game in different modes using flags:
cargo run --bin game -- --dev data/system/us/seattle/maps/downtown.binstarts on a particular mapcargo run --bin game -- data/system/us/seattle/scenarios/downtown/weekday.binstarts with a scenario (which is tied to a certain map)cargo run --bin game -- --challenge=trafficsig/tut2starts on a particular challenge. See the list of aliases by passing in a bad value here.cargo run --bin game -- data/player/saves/us/seattle/montlake/no_edits_unnamed/00h00m20.3s.binrestores an exact simulation state. Savestates are found in debug mode (Control+D) -- they're probably confusing for the normal player experience, so they're hidden for now.cargo run --bin game -- --tutorial=12starts somewhere in the tutorial- Adding
--edits='name of edits'starts with edits applied to the map.
Downloading more cities
Most easily, you can download new cities using the GUI directly.
As data formats change over time, things in the data/ directory not under
version control will get out of date. At any time, you can run
cargo run --bin updater -- download from the main repository directory to
update only the files that have changed.
You can also opt into downloading updates for more cities from the command line
by editing data/player/data.json. If you want to add data for Leeds, GB, for
example, you could edit that file so that it contains the following:
{
  "runtime": ["gb/leeds", "us/seattle"],
  "input": ["gb/leeds", "us/seattle"]
}
If you want to opt into absolutely everything:
cargo run --bin updater -- opt-into-all > data/player/data.json
Building map data
You can skip this section if you're just touching code in game, widgetry,
and sim. If you're just trying to import a new city, follow
the user guide. This section is relevant if you're
working on the code that imports maps and scenarios.
Dependencies
To run all pieces of the importer, you'll need some extra dependencies:
osmium: See https://osmcode.org/osmium-tool/manual.html#installationlibgdal-dev: See https://gdal.org if your OS package manager doesn't have this. If you keep hitting linking errors, then just remove--features importer/scenariosfromimport.sh. You won't be able to build the Seattle scenarios.- Standard Unix utilities:
unzipandgunzip
The importer pipeline
The import process is split into two main steps. When you run the importer, you
specify what work you want to do, so understanding these steps is important.
First is the --raw step, which:
- Downloads all input data needed for a map -- a .osm.pbf file from Geofabrik, at minimum
- Uses
osmiumto clip the large OSM file into smaller pieces - Reads in all of the input, producing a
RawMapfile. This is an intermediate format that's useful for debugging, using themap_editortool.
If you look in data/input/us/nyc/ (substituting the country and city, of
course), you'll see osm and raw_maps directories. In places like
data/input/us/seattle/, there are many other input files.
The second step, --map, transforms the RawMap to the final Map file used
by all of the applications. These files live in data/system/us/nyc/maps.
Running the importer
The importer tool has many CLI flags not described here; --help is the best
reference. But we can start with a few common examples.
After creating configuration files for a city, you can import it, running both
the --raw and --map steps:
./import.sh --raw --map --city=br/sao_paulo
If your city is split into many maps, you can operate on just one of them (the
west boundary):
./import.sh --raw --map --city=fr/paris west
If you want to regenerate a map with the latest OSM data, you need to first
delete the OSM input files cached locally. Then running with --raw will
download them again. Note the OSM files are downloaded from Geofabrik, so they
may be up to one day out-of-date. You can additionally use osmupdate if
needed.
rm -rfv data/input/fr/paris/osm/
./import.sh --raw --map --city=fr/paris
Some more tips for running specific stages of the importer:
- If you're modifying the initial OSM data -> RawMap conversion in
convert_osm, you need./import.sh --raw --map. - If you're modifying
map_modelbut not the OSM -> RawMap conversion, then you just need./import.sh --map. - If you're modifying the demand model for Seattle, you can add
--scenarioto regenerate. - By default, all maps are regenerated. You can also specify a single map:
./import.sh --map downtown. - By default, Seattle is assumed as the city. You have to specify otherwise:
./import.sh --city=us/detroit --map downtown.
Building contraction hierarchies for pathfinding occurs in the --map stage. It
can take a few minutes for larger maps. To view occasional progress updates, you
can run the importer with
RUST_LOG="fast_paths=debug/contracted node [0-9]+0000 "
You can also make the importer import a new city.
Understanding stuff
The docs listed at https://github.com/a-b-street/abstreet#documentation explain things like map importing and how the traffic simulation works.
Code organization
If you're going to dig into the code, it helps to know what all the crates are.
The most interesting crates are map_model, sim, and game.
Constructing the map:
convert_osm: extract useful data from OpenStreetMap and other data sources, emit intermediate map formatkml: extract shapes from KML and CSV shapefilesmap_model: the final representation of the map, also conversion from the intermediate map format into the final formatmap_editor: GUI for modifying geometry of maps and creating maps from scratch. pretty abandoned as of June 2020importer: the entire import pipelinecli: a collection of command-line tools to manage importingupdater: tool to download/upload large files used in the import pipeline
Traffic simulation:
sim: all of the agent-based simulation logicheadless: tool to run a simulation without any visualization
Graphics:
game: the GUI and main gameplaymap_gui: common code to interact withmap_modelmapswidgetry: a GUI and 2D OpenGL rendering library, using glium + winit + glutin
Common utilities:
abstutil: a grab-bag timing and logging utilitiesabstio: Reading/writing files on native/webgeom: types for GPS and map-space points, lines, angles, polylines, polygons, circles, durations, speeds
Other:
collisions: an experimental data format for real-world collision datatraffic_seitan: a bug-finding tool that randomly generates live map editstests: integration testssanta: 15-minute Santa, an arcade game about delivering and zoningparking_mapper: a standalone tool to help map street parking in OSMosm_viewer: a standalone tool to render OSM in detailfifteen_min: a standalone tool to explore 15-minute neighborhoodspopdat: use census data to produce traffic simulation inputtraffic_signal_data: manual timing overrides for some traffic signalspiggyback: a small WebAssembly API to layer parts of A/B Street on top of Mapbox or other web maps
Code conventions
All code is automatically formatted using
https://github.com/rust-lang/rustfmt; please run cargo fmt before sending a
PR.
cargo fmt can't yet organize imports, but we follow a convention to minimize conflict with what some IDEs do. Follow existing code to group imports: std, external crates, other crates in the project, the current crate, then finally any module declarations.
We also use https://github.com/rust-lang/rust-clippy to adhere to more Rust best practices. No need to run it for every commit, and sometimes we'll disable a warning. If in doubt, just ask on a PR.
See the testing strategy page.
Error handling
The error handling is unfortunately inconsistent. The goal is to gracefully degrade instead of crashing the game. If a crash does happen, make sure the logs will have enough context to reproduce and debug. For example, giving up when some geometry problem happens isn't ideal, but at least make sure to print the road / agent IDs or whatever will help find the problem. It's fine to crash during map importing, since the player won't deal with this, and loudly stopping problems is useful. It's also fine to crash when initially constructing all of the renderable map objects, because this crash will consistently happen at startup-time and be noticed by somebody developing before a player gets to it.
Since almost none of the code ever needs to distinguish error cases, use
anyhow. Most of the errors generated within
A/B Street are just strings anyway; the bail! macro is a convenient way to
return them.
Logging
Prefer using info!, warn!, error!, etc from the log crate rather than
println.
Adjust the log level without recompiling via the RUST_LOG env variable.
RUST_LOG=debug cargo run --bin game
This can be done on a per lib basis:
RUST_LOG=my_lib=debug cargo run --bin game
Or a module-by-module basis:
RUST_LOG=my_lib::module=debug cargo run --bin game
You can mix and match:
# error logging by default, except the foo:bar module at debug level
# and the entire baz crate at info level
RUST_LOG=error,foo::bar=debug,baz=info cargo run --bin game
For some special cases, you might want to use regex matching by specifying a pattern with the "/":
# only log once every 10k
RUST_LOG="fast_paths=debug/contracted node [0-9]+0000 " mike import_la
See the env_logger documentation for more usage examples.
Profiling
Use https://github.com/flamegraph-rs/flamegraph, just running it on the binaries you build normally.
Development notes
Find packages to upgrade: cargo outdated -R
Deal with compile tile: cargo bloat --time
Find why two binary crates aren't sharing dependencies: https://old.reddit.com/r/rust/comments/cqceu4/common_crates_in_cargo_workspace_recompiled/
Where's a dependency coming from? cargo tree -i -p syn
Diff screencaps: http://www.imagemagick.org/Usage/compare/#methods
Debug OpenGL calls:
apitrace trace --api gl ../target/debug/game
qapitrace game.trace
apitrace dump game.trace
Understand XML: just use firefox
Markdown
For formatting:
sudo apt-get install npm
cd ~; mkdir npm; cd npm
npm init --yes
npm install prettier --save-dev --save-exact
Videos
# Fullscreen
ffmpeg -f x11grab -r 25 -s 1920x960 -i :0.0+0,55 -vcodec huffyuv raw.avi

ffmpeg -ss 10.0 -t 5.0 -i raw.avi -f gif -filter_complex "[0:v] fps=12,scale=1024:-1,split [a][b];[a] palettegen [p];[b][p] paletteuse" screencast.gif
Faster linking
sudo apt-get install lld
Stick this in ~/.cargo/config:
[target.x86_64-unknown-linux-gnu]
rustflags = [
    "-C", "link-arg=-fuse-ld=lld",
]
Also enable incremental builds in release mode. In ~/.cargo/config:
[build]
incremental = true
I'm not sure about setting this in the repo's Cargo.toml, because we may not want incremental builds on Github Actions for building the release? Not sure what best practice is.
git
Keep a fork up to date:
# Once
git remote add upstream https://github.com/rust-windowing/glutin/

git fetch upstream
git merge upstream/master
git diff upstream/master
Refactoring
perl -pi -e 's/WrappedComposite::text_button\(ctx, (.+?), (.+?)\)/Btn::text_fg(\1).build_def\(ctx, \2\)/' `find|grep rs|xargs`
Stack overflow
rust-gdb --args ../target/release/game --dev
Drawing diagrams
draw.io
Mapping
xodo on Android for annotating maps in the field
OSM tools
osmcha.org for recent changes
To upload diffs:
java -jar ~/Downloads/josm-tested.jar ~/abstreet/map_editor/diff.osc
JOSM: Press (and release T), then click to pan. Download a relevant layer, select the .osc, merge, then upload.
Fonts
fontdrop.info
Release checklist
What things are sensitive to changes in map data and simulation rules?
- tutorial
- optimize commute challenges
What things do I always forget to test?
- DPI issues, use
--scale_factor
API
Suppose you're tired of manually fiddling with traffic signals, and you want to use machine learning to do it. You can run A/B Street without graphics and automatically control it through an API.
Examples
This Python example has everything you need to get started.
See all example code -- there are different experiments in Go and Python that automate running a simulation, measuring some metric, and making a change to improve the metric.
Control flow
The headless API server that you run contains a single map and simulation at a
time. Even though you can theoretically have multiple clients make requests to
it simultaneously, the server will only execute one at a time. If you're trying
to do something other than use one script to make API calls in sequence, please
get in touch, so we can figure out something better suited to your use case.
When you start the headless server, it always loads the montlake map with
the weekday scenario. The only way you can change this is by calling
/sim/load. For example:
curl http://localhost:1234/sim/load -d '{ "scenario": "data/system/us/seattle/scenarios/downtown/monday.bin", "modifiers": [], "edits": null }' -X POST`
You can also pass flags like --infinite_parking to the server to control
SimOptions.
These settings will apply for the entire lifetime of the server; you can't
change them later.
API details
Under construction: The API will keep changing. There are no backwards compatibility guarantees yet. Please make sure I know about your project, so I don't break your client code.
For now, the API is JSON over HTTP. The exact format is unspecified, error codes are missing, etc. A summary of the commands available so far:
- /sim
- GET /sim/reset: Reset all temporary map edits and the simulation state.
The trips that will run don't change; they're determined by the scenario
specified by the last call to
/sim/load. If you made live map edits using things like/traffic-signals/set, they'll be reset to theeditsfrom/sim/load. - POST /sim/load: Switch the scenario being simulated, and also optionally sets the map edits.
- GET /sim/load-blank?map=data/system/gb/london/maps/southwark.bin: Switch to a different map, loading a blank simulation.
- GET /sim/get-time: Returns the current simulation time.
- GET /sim/goto-time?t=06:30:00: Simulate until 6:30 AM. If the time you specify is before the current time, you have to call /sim/reset first.
- POST /sim/new-person: The POST body must be an ExternalPerson in JSON format.
- GET /sim/reset: Reset all temporary map edits and the simulation state.
The trips that will run don't change; they're determined by the scenario
specified by the last call to
- /traffic-signals
- GET /traffic-signals/get?id=42: Returns the traffic signal of intersection #42 in JSON.
- POST /traffic-signals/set: The POST body must be a ControlTrafficSignal in JSON format.
- GET /traffic-signals/get-delays?id=42&t1=03:00:00&t2=03:30:00: Returns the delay experienced by every agent passing through intersection #42 from 3am to 3:30, grouped by direction of travel.
- GET /traffic-signals/get-cumulative-thruput?id=42: Returns the number of agents passing through intersection #42 since midnight, grouped by direction of travel.
- GET /traffic-signals/get-all-current-state: Returns the current state of all traffic signals, including the stage timing, waiting, and accepted agents.
- /data
- GET /data/get-finished-trips: Returns a JSON list of all finished trips. Each tuple is (time the trip finished in seconds after midnight, trip ID, mode, duration of trip in seconds). The mode is a string like "Walk" or "Drive". If the trip was cancelled for any reason, duration will be null.
- GET /data/get-agent-positions: Returns a JSON list of all active agents. Vehicle type (or pedestrian), person ID, and position is included.
- GET /data/get-road-thruput: Returns a JSON list of (road, agent type, hour since midnight, throughput for that one hour period).
- GET /data/get-blocked-by-graph: Returns a mapping from agent IDs to how long they've been waiting and why they're blocked.
- GET /data/trip-time-lower-bound?id=123: Returns a reasonable lower bound for the total duration of trip 123, in seconds. The time is calculated assuming no delay at intersections, travelling full speed along every road, and using the primary mode for the entire trip (so just driving).
- GET /data/all-trip-time-lower-bounds: The faster equivalent of calling
/data/trip-time-lower-boundfor every trip in the simulation.
- /map
- GET /map/get-edits: Returns the current map edits in JSON. You can save
this to a file in
data/player/edits/city_name/map_name/and later use it in-game normally. You can also later run theheadlessserver with--edits=name_of_edits. - GET /map/get-edit-road-command?id=123: Returns an object that can be modified and then added to map edits.
- GET /map/get-intersection-geometry?id=123: Returns a GeoJSON object with one feature for the intersection and a feature for all connecting roads. The polygon coordinates are measured in meters, with the origin centered at the intersection's center.
- GET /map/get-all-geometry: Returns a huge GeoJSON object with one feature per road and intersection in the map. The coordinate space is WGS84.
- GET /map/get-nearest-road?lat=1.23&lon=4.56&threshold_meters=100: Snaps a point to the nearest road center line, and returns the RoadID.
- GET /map/get-edits: Returns the current map edits in JSON. You can save
this to a file in
Working with the map model
If you need to deeply inspect the map, you can dump it to JSON:
cargo run --release --bin cli -- dump-json data/system/us/seattle/maps/montlake.bin > montlake.json
See some example code that reads this JSON and finds buildings.
You could also edit the map JSON, convert it back to binary, and use it in the
simulation. This isn't recommended generally, but one possible use case could be
tuning the amount of offstreet parking per building. The map JSON has a list
called buildings, and each object there has a field parking. You coud set
this object to { "Private": [100, false] } to indicate 100 parking spots, for
a building not explicitly designated in OpenStreetMap as a garage. After editing
the JSON, you have to convert it back to the binary format:
cargo run --release --bin cli -- import-json-map --input=montlake.json --output=data/system/us/seattle/maps/montlake_modified.bin`
The format of the map isn't well-documented yet. See the generated API docs and the map model docs in the meantime.
Working with individual trips
You can use the /sim/new-person API in the middle of a simulation, if needed. If possible, it's simpler to create a Scenario as input.
Working with Scenarios
You can import trips from your own data.
You can also generate different variations of one of the demand models by specifying an RNG seed:
cargo run --release --bin cli -- random-scenario --rng=123 --map=data/system/us/seattle/maps/montlake.bin --scenario_name=home_to_work
You can also dump Scenarios (the file that defines all of the people and trips) to JSON:
cargo run --release --bin cli -- dump-json data/system/us/seattle/scenarios/montlake/weekday.bin > montlake_weekday.json
You can modify the JSON, then put the file back in the appropriate directory and use it in-game:
cargo run --bin game -- --dev data/system/us/seattle/scenarios/montlake/modified_scenario.json
The Scenario format is documented here.
Testing strategy
Unit tests
As you've probably noticed, there aren't many. Lots of the interesting behavior in A/B Street - UI interactions, details of the simulation, map importing -- would take lots of infrastructure to specify a setup and expected outcomes. If you have ideas for new tests, contributions always welcome! In the meantime, one useful test covers how OSM tags translate into individual lanes.
Screenshot diffs
Downloading fresh OSM data or modifying any part of the map importing pipeline could easily break things. Expressing invariants about the map output is hard, because importing is far from perfect, and OSM data is often quite buggy. So the approach to preventing regressions here is to look for visual changes to the final rendered map.
- When a new map is opted into this type of test, somebody manually squints carefully at it and sanity checks that it works to some degree.
- They use the screen capture tool in debug mode to tile the map into 1920x960 chunks and screengrab everything.
- Later, somebody regenerates the map with some possible changes.
- They grab screenshots again, then use
compare_screenshots.shto quickly look at the visual diff. Changes to intersection geometry, number of lanes, rendering, etc are all easy to spot. - If this manual inspection of the diff is good, they commit the new screenshots as the new goldenfiles.
How do you actually run this test? Open the main sandbox mode (on a release
build, unless you're very patient), go to debug mode (Ctrl+D), then hit
"screenshot all of the everything" on the right. This will fly through a few
maps, tiling them into screen-sized chunks and saving a screenshot for each one.
The maps configured for this test are in game/src/debug/mod.rs, near the
string "screenshot all of the everything".
This process produces a screenshots/ directory. You can then use
./compare_screencaps.sh us phoenix tempe to see if that map's screenshots have
changed since the last recorded run of the test. This script assumes you've
opted into the input data and run the
updater for the appropriate cities. It also assumes the compare command (from
ImageMagick) and feh (to view images; you could change the script to something
else). Very critically, all the stored screenshots are sized 1920 x 948 (from
a 1920 x 1080 monitor, subtracting titlebars and such for my GNOME setup). The
diffs won't make sense if the size is different!
After confirming any diffs are intentional, the ./confirm_screencap.sh script
replaces the new source-of-truth in
data/input/us/phoenix/screenshots/tempe.zip or similar. The updater tool is
then used to upload the new data to S3 -- this is a step that currently only
Dustin has access to run.
data/regen.sh
This tool regenerates all maps and scenarios from scratch.
cargo run --bin updater -- dry-run then reveals what files have changed.
Additionally, this script does a few more tests:
--prebakeruns the full weekday scenario on two maps that've previously been coerced into being gridlock-free
Integration tests
The tests crate contains some integration tests.
One part runs the full importer against really simple .osm files. To iterate
rapidly on interpreting turn restrictions, it produces goldenfiles describing
all turns in the tiny map.
The "smoke-test" section simulates one hour on all maps, flushing out bugs with bus spawning, agents hitting odd parts of the map, etc
The "check proposals" section makes sure the edits shipped with the game still load properly.
Old tests
Once upon a time, I made a little test harness that would run the simulation
headlessly (without graphics), set up certain situations forcing a car to park
in a certain spot, and asserted that different sim/src/events.rs were produced
in the right order. The map_editor tool was used to manually draw really
simple maps for these situations. I deleted everything, because the effort to
specify the input and expected output were too tedious to maintain, and this
never really helped catch bugs. There was a way to label roads and buildings in
the synthetic maps, so the test code could assert person 2 made it to the
"house" building, but even with all of this, it was pretty hard.
This approach is maybe worth reviving, though.
Data organization
A/B Street includes lots of large binary files to represent converted maps, scenarios, and prebaked simulation results. The files are too large to store in git, but the files are still logically tied to a version of the code, since the format sometimes changes. Additionally, all of the files are too large to include in the .zip release that most people use, but it should still be possible for players to download the optional content. Also, there are different versions of the game floating around, on native and web, that have to be associated with the proper version of these files.
It's all slightly confusing, so this page describes how it all works.
The data itself
If you peek into the data/ directory, it's mainly split into 3 subdirectories.
system/ is used when running the game and is the subject of this page.
input/ is used to store input and intermediate files for importing maps, and
only developers running the importer should care about it. player/ contains
local settings, map edits, and other data created in-game.
data/MANIFEST.json is a listing of all files in data/system/, along with
their size and md5sum. Different tools compare this manifest to the local
filesystem to figure out what to do.
There are also some other scripts and files in data/, but they should probably
be moved.
Where the data is stored
data/system/ and data/input/ are stored in Amazon S3, at
http://abstreet.s3-website.us-east-2.amazonaws.com. This S3 bucket is organized
into versions: dev, 0.2.17, 0.2.18, etc. dev represents the latest
version of all data files. The numbered versions correspond to
releases and only contain
data/system/, not data/input/. Depending how large these directories grow
over time, I'll commit to keeping around at least 3 of the previous numbered
versions, but I might delete older ones after that.
play.abstreet.org is wired up to Cloudfront, via Google Domains. The CDN is
faster than accessing the S3 bucket (in one region) directly.
Native, running from source
For people building the game from source, the process to keep data
files fresh is to cargo run --bin updater -- download. This tool calculates
md5sums of all local files, then compares it with the checked-in
data/MANIFEST.json. Any difference results in a local file being deleted or a
new file from S3 being downloaded. By editing data/player/data.json manually
or using the UI in the game (found by loading a map, then choosing to download
more maps), somebody can opt into downloading "extra/optional" cities.
Native, running from a release .zip
When the weekly .zip binary release for Mac, Linux, and Windows is produced, the
game crate is built with --features release_s3. When the downloader UI is
opened in-game, this causes downloads to occur from a versioned S3 directory,
like 0.2.17, depending on the version string compiled into the game at that
time. So somebody can run off the weekly release, opt into more cities, and get
the correct version of the files, even if the format has changed in /dev/
since then.
Web, running locally
The strategy for managing files gets more interested when the game is compiled
to WebAssembly, since browsers can't read from the local filesystem.
game/src/load.rs contains some crazy tricks to instead make asynchronous HTTP
requests through the browser. When using game/run_web.sh, the files are served
through a local HTTP server and symlinked to the local copy of data/system/.
Not all files are loaded through HTTP; some are actually statically compiled
into the .wasm file itself! abstutil/src/io_web.rs does this magic using the
include_dir crate. Only a few critical large files, needed at startup, are
included. There's an IO layer for listing and reading files that, on web, merges
results from the bundled-in files and the remote files that're declared to exist
in the bundled-in copy of data/MANIFEST.json.
Web, from S3
Everything's the same, except that since the URL isn't localhost, the game makes
HTTP requests to the S3 bucket (or wherever the game is hosted). Additionally,
the files are expected to be gzipped. The web version always pins to /dev,
never a release version of the data, since the web client is always updated
along with the data, for now.
Release process
This happens every Sunday.
- Push a commit containing
[rebuild] [release]in the commit message. - Go to https://github.com/a-b-street/abstreet/actions and manually approve the deployment, then wait for it to complete
- Manually download the 3 .zip files
- With your current directory set to where the .zips are downloaded, run
~/abstreet/release/finalize.sh v0_2_38, changing the version number. (That path assumes the abstreet git repo is in your home directory.) - If you want, sanity check that the final generated binaries work. Sometimes I test things like the map importer or that maps not included by default can be downloaded.
- Create a new release at
https://github.com/a-b-street/abstreet/releases/new. Make sure the version
matches, with a different format --
v0.2.38. The description should match what later goes in the changelog, and the name really ought to be gastronomically offensive. - Upload the 3 transformed .zips created by
finalize.sh-- they're named something likeabstreet_mac_v0_2_38.zip. - Publish release!
- From the root directory of the abstreet repo, run
./release/update_docs.sh 37 38. When the major version number changes, update that script first. This updates the latest release from0.2.37to0.2.38. It assumes the https://github.com/a-b-street/docs repo is in your home directory named~/docs. - Go fill out
~/docs/book/src/project/history/CHANGELOG.md; the notes should match what's in the Github release. - Follow the steps that the
update_docs.shscript tells you. Don't forget to push the commit on the main abstreet repo as well.
One of the update_docs.sh steps is an S3 copy. This "freezes" the current
"dev" data and web deployment as a named version. The URL would be something
like http://abstreet.s3-website.us-east-2.amazonaws.com/0.2.38/abstreet.html.
How it works
The process is kind of convoluted; help is always welcome to smooth it out.
Github Actions is used to build for all 3 platforms.
.github/workflows/main.yml is configured to only build when [rebuild] is in
the commit message. [release] enables a cargo feature flag that tells
map_gui/src/tools/updater.rs where to look to download new system data.
Because the binary map format changes, an older release has to be pinned to a
particular versioned copy of all the system data. The workflow calls
release/build.sh, which assembles the directory structure with all of the
executables, system data (obtained by running the updater with the default
Seattle-only opt-in), and instructions.
There's some funkiness with producing a .zip, because uploading Github artifacts
always double-zips, and also on the Windows runner, there doesn't seem to be a
way to create a .zip. That's why the extra step of downloading the build
artifacts and running release/finalize.sh locally is necessary.
Data formats
This section describes data formats that A/B Street uses for input and output. Like the API, nothing is guaranteed to be backwards-compatible yet. The best way to make sure schema changes won't mess up your workflow is to keep in touch and make sure I know how you're using these files.
The formats are currently JSON, without a machine-readable schema. In the future, I'm highly likely to use protocol buffers, flatbuffers, Thrift, etc instead, so that languages with static type systems can benefit from auto-generated libraries and so that larger files can be encoded in binary.
Scenario data format
If you want to import your own travel demand model, you can use this JSON file.
Specification
Until we switch to using protobufs or similar, there's no formal spec. The JSON deserialization happens from Rust code. It's easiest to follow the example below.
Example
This defines a scenario containing a single person, who takes two trips. They
begin at 1 second past midnight (10000) at the building nearest to the
origin, 'find' a bike and cycle to the destination. Then at 12:20
(12000000 is 1200 seconds after midnight), they walk to the building nearest
to the destination. Note that the destination of trip 1 must match the
origin of trip 2.
The mode field can be be Walk, Bike, or Transit. The purpose field is
mostly unused; you could pick
other values
that show up in the UI. And of course, you can add as many people as you like.
{
  "scenario_name": "minimal",
  "people": [
    {
      "trips": [
        {
          "departure": 10000,
          "origin": {
            "Position": {
              "longitude": -122.303723,
              "latitude": 47.6372834
            }
          },
          "destination": {
            "Position": {
             "longitude": -122.3190500,
              "latitude": 47.6378600
        }
          },
          "mode": "Bike",
          "purpose": "Meal"
        },
        {
          "departure": 12000000,
          "origin": {
            "Position": {
             "longitude": -122.3190500,
              "latitude": 47.6378600
        }
          },
          "destination": {
            "Position": {
              "longitude": -122.3075948,
              "latitude": 47.6394773
        }
          },
          "mode": "Walk",
          "purpose": "Recreation"
        }
      ]
    }
  ]
}
Tools
To import this JSON file into A/B Street:
cargo run --release --bin cli -- import-scenario --map=data/system/us/seattle/maps/montlake.bin --input=/path/to/input.json
Then run the game as follows:
cargo run --bin game -- --dev data/system/us/seattle/maps/montlake.bin
You will need to select the senario with the user interface.
This tool matches input positions to the nearest building, within 100 meters. If
the point lies outside the map boundary, it's snapped to the nearest map border.
The tool will fail if any point doesn't match to a building. If you pass
--skip_problems, those people will be logged and skipped instead.
There are also a few tools that produce this JSON file:
- https://github.com/a-b-street/abstreet/blob/master/headless/examples/generate_traffic.py
- https://github.com/a-b-street/abstr
Future requests
- A way to specify some kind of numeric ID for each person, so you can later correlate results from the simulation with your input
Traffic signal data format
A/B Street uses a JSON format to describe how a single intersection with traffic signals is configured. This format changes more frequently, but the software will automatically upgrade a signal described in an old format. This way, players can save their edits to a map and, months later, still use the same edits with a new version of A/B Street. (The only exception is when OpenStreetMap IDs change; if a way near the intersection is split and assigned a new ID, we make no attempt to handle this.)
The format is complicated, so let's break down some of the concepts used in it.
Turns
We first need a way to describe a movement between two road segments. Let's use https://www.openstreetmap.org/node/53219808, the intersection of 24th Ave E and E McGraw St in Seattle as an example.
Directed road segments
So first let's identify a single road segment. For this example, let's describe the eastbound direction of the west side of McGraw St, which is https://www.openstreetmap.org/way/804788512 in OSM. As you can see, this way hits 3 intersections. We just want to describe the segment between 24th and 25th Ave. Looking at the list of nodes for that way in the order defined in OSM, we see it goes from https://www.openstreetmap.org/node/53219808 to https://www.openstreetmap.org/node/1709143541. Note that the intermediate nodes used as control points for the shape of the road or as crosswalk nodes are ignored. So, we can describe this segment by using the way's ID and the first and last node ID.
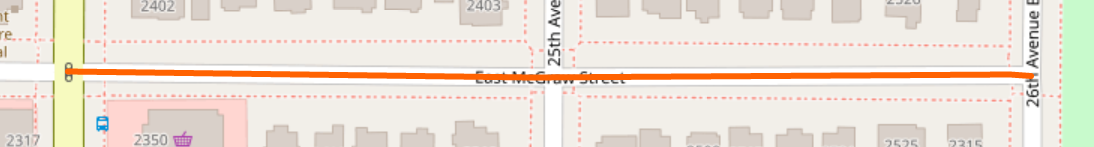
{
  "osm_way_id": 804788512,
  "osm_node1": 53219808,
  "osm_node2": 1709143541,
  "is_forwards": false
}
Finally, we have to say which direction of this road segment we're talking
about. The order of the nodes in OSM is arbitrary; in this case, the road points
from the traffic signal we're talking about to another intersection. But we want
to refer to the inbound / eastbound direction of this road. So we say
"is_forwards": false to indicate the opposite of the direction specified by
OSM. This is the same concept as "forward & backward" as defined in the
OSM wiki.
Turns for vehicles
So now let's describe the left turn from E McGraw to 24th going southbound. It looks like this:
{
  "from": {
    "osm_way_id": 804788512,
    "osm_node1": 53219808,
    "osm_node2": 1709143541,
    "is_forwards": false
  },
  "to": {
    "osm_way_id": 6470476,
    "osm_node1": 53128048,
    "osm_node2": 53219808,
    "is_forwards": false
  },
  "intersection_osm_node_id": 53219808,
  "is_crosswalk": false
}
You specify the from and to fields using the directed road segment ID.
Additionally, you specify which intersection the traffic signal is at --
53219808 in this case -- and set is_crosswalk to false to indicate a turn
for vehicles or cyclists on the road.
Crosswalks
Why is the format above so repetitive? The reason is to be able to also specify
movements along crosswalks in the intersection. The from and to directed
road segments refer to one half of a road, so they can be used to identify one
sidewalk or another. From this diagram, you can see how there are 8 different
start or end points for crosswalks at this intersection:
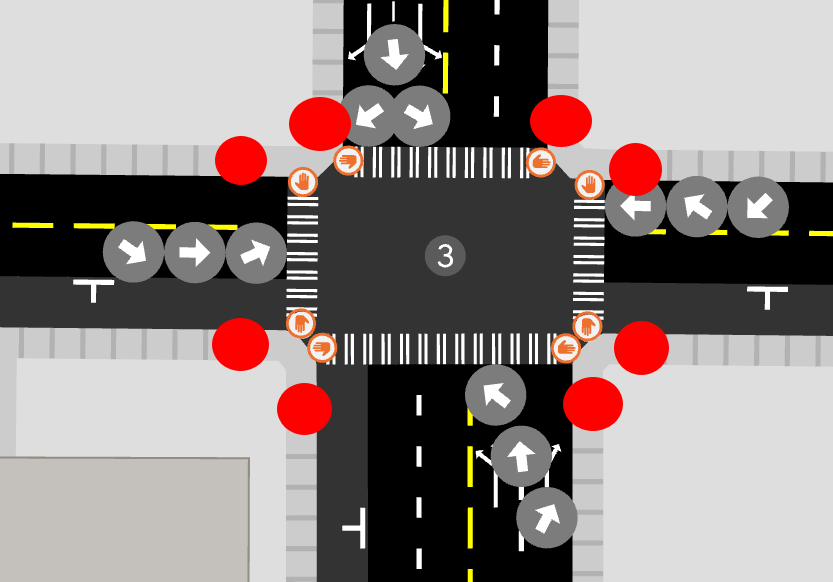
TODO: Walk through an example of a single crosswalk. I hope the explanation of the format above suffices, for now.
Stages
Now that we understand how to describe turns, we can describe the sequence of stages that a traffic signal cycles through. Each stage specifies the turns that are protected and permitted. Protected turns have priority (a green light), and no two protected turns in the same stage can cross each other. Permitted turns are allowed only if there's no oncoming traffic -- so this could mean a right turn on red or an unprotected left turn with a flashing arrow. Note that crosswalks always must be defined as protected, which means any vehicle turns that intersect with the crosswalk have to be specified as permitted. This captures the semantics in the US that turning vehicles must always yield to pedestrians when the crosswalk signal is on.
A single traffic signal cycles through the same list of stages over and over.
Each stage also specifies its duration with the stage_type. The simple example
is "Fixed": 45, meaning this stage always lasts exactly 45 seconds. A stage
can also have variable timing, also known as actuation. The format is
"Variable": [15, 2, 10]. This stage would last a minimum of 15 seconds, but it
may last an additional 10 seconds, up to a maximum of 25 seconds. If there are
no vehicles or pedestrians trying to make protected turns after 15 seconds, the
stage ends. If there are, then the stage is extended by 2 seconds, and the same
check repeats, until the maximum of 25 is reached.
The full example
Understanding everything above means you should be able to interpret what https://github.com/a-b-street/abstreet/blob/599c7b6d6bc078312e5ea9f57d3391be9568ef83/traffic_signal_data/data/53219808.json means. The rendering in A/B Street looks like this:
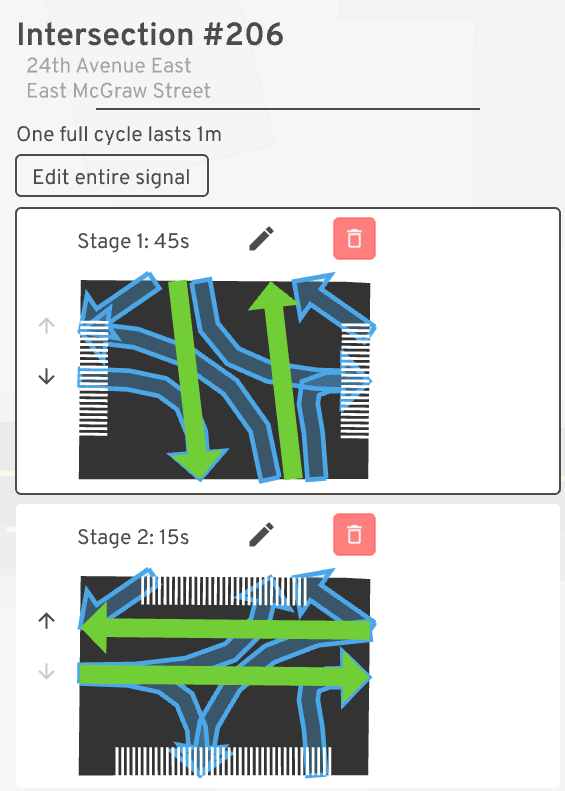
There are two stages. The first lasts 45 seconds and allows north/south movement. Left turns onto McGraw are permitted after yielding. Since the north/south crosswalks are also enabled, all right turns also have to yield. The second stage lasts only 15 seconds and lets east/west traffic move. Left turns are also unprotected here.
Limitations
In reality, many traffic signals use different configuration during rush hour, late at night, on weekends, etc. There's some planned work to model one intersection having different plans.
Many intersections in Seattle now use leading pedestrian intervals, which enable a crosswalk signal to give pedestrians a head-start into the intersection before vehicles start to turn. You can model this in A/B Street by adding an extra stage that only enables the crosswalks and lasts a few seconds, followed by a stage allowing both the crosswalks and vehicle turns. We could explicitly add a parameter for LPI duration, but it would complicate the format, so this "flattened stage" format will work for now.
You'll notice the format for specifying turns works at the granularity of the entire road, not individual lanes. Most of the time, this is fine -- vehicles will only use the turn lanes available. But in some cases, we may want to distinguish two groups of vehicles moving the same direction by the lane type. In particular, sometimes there's a bidirectional protected cycle-track on one side of the road with its own dedicated signal:
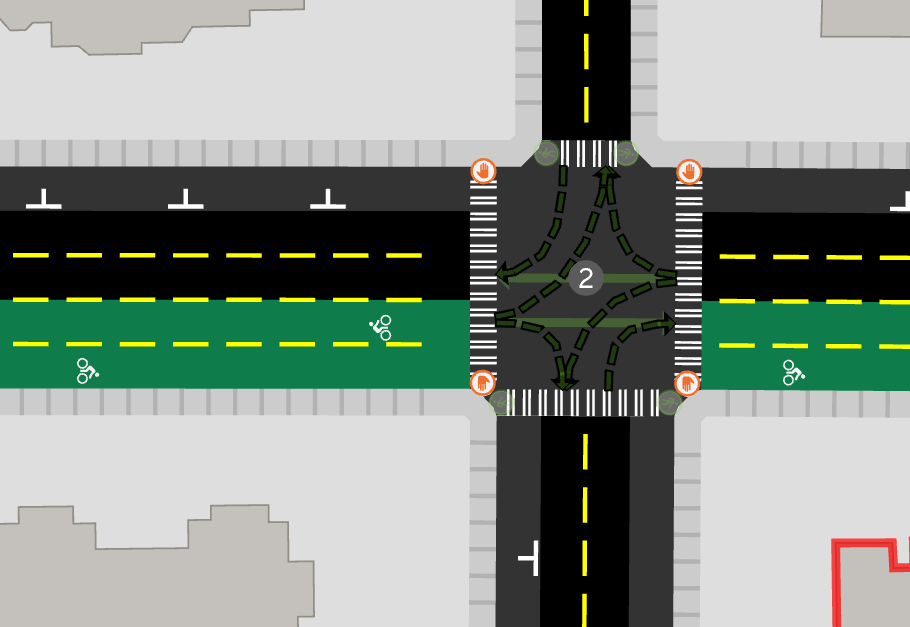
A/B Street can't model this as having a separate signal yet.
Complications with importing other data
External software like vol2timing can provide much better signal configuration than A/B Street's default heuristics. We will encounter at least two major challenges to import it.
Crosswalks
A/B Street currently does not use sidewalks, foot-paths, and crosswalks that are explicitly drawn as separate OSM ways. Instead, it makes many guesses for which roads have a sidewalk and creates many, many crosswalks. See https://github.com/a-b-street/abstreet/issues/485 for some examples of crosswalks that should not be created, but currently are.
When A/B Street imports traffic signal configuration, it validates that all possible turns at the intersection are captured by at least one stage. The problem here will be that other software may not list as many crosswalks as A/B Street expects.
Intersection merging/consolidation
OSM models bidirectional roads with some physical median as two one-ways. When these divided one-ways cross a regular road, the intersection is split into two intersections with a very short "road" in between. When two pairs of divided one-ways cross, the intersection has four nodes and short "roads" in between. This wreaks havoc in A/B Street, making the intersection geometry look strange, making it hard to edit the two or four uncoordinated traffic signals around the intersection, and causing vehicles to get stuck in the short "roads".
One solution that's promising is for A/B Street to consolidate those nodes and short "roads" into one big intersection, capturing how a human would intuitively view the area. One case where this works well is https://www.openstreetmap.org/#map=19/47.68264/-122.34426. See the before and after:
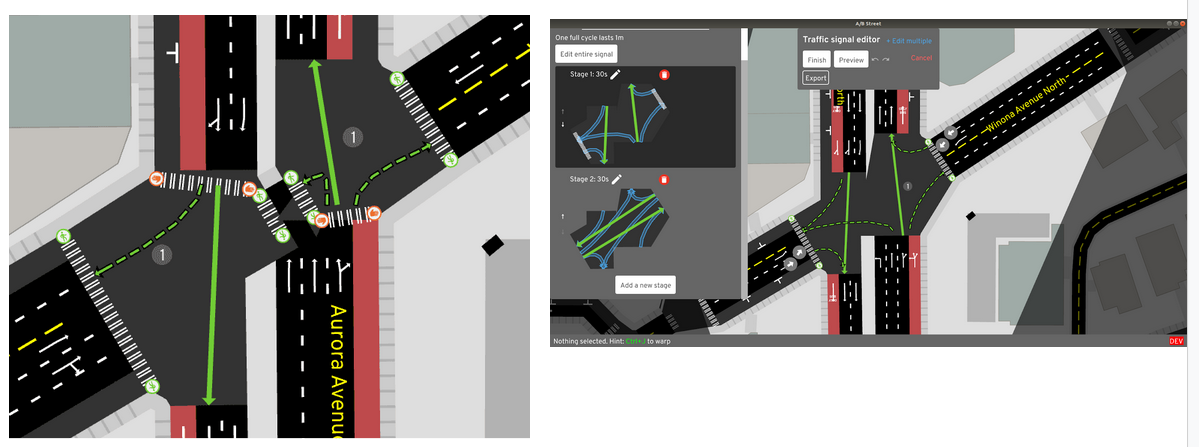
Unfortunately this process doesn't work for many more cases, so it's not enabled by default yet. Preserving turn restrictions defined by OSM and getting good results for the geometry of the consolidated intersection is hard.
In the meantime, all of this complicates the traffic signal format, because it's unclear how to specify road segments when A/B Street will arbitrarily delete some of the node IDs when it imports.
How the the A/B Street UI & drawing work
When I started A/B Street in June 2018, the
Rust UI ecosystem had nothing that clearly fit my
needs, so I wound up rolling something custom. This doc explains conceptually
how it works and how to use it. Eventually some of this should become proper
docs for widgetry.
Best advice on how to use stuff in practice is to work from examples. grep is
your friend.
widgetry overview
First, the crate-level view. widgetry is the generic drawing and UI library,
independent of A/B Street. map_gui builds on top of it, providing ways to
render the map model used by all of the projects. Finally, game,
fifteen_min, santa, and others are the runnable applications making use of
this.
This section will explain how widgetry works from bottom-up. Conceptually
we'll walk through how it was built from scratch, skipping all of the false
turns made along the way.
Low-level
Let's start just by drawing stuff and handling keyboard/mouse events. The basic loop of any winit program is to handle input events and, when winit says to, redraw everything. The earliest A/B Street prototype expressed the primitive map model imported from OpenStreetMap as a bunch of polygons, and hooked up basic mouse controls to pan and zoom over the canvas.
And that hasn't really changed -- we still only draw 2D colored polygons. Widgetry's use of OpenGL shaders is dirt simple. With the exception of some barely used texture code, all of the icons and images in A/B Street are SVGs, which can be transformed into colored polygons through the magic of the usvg and lyon crates. This includes all text -- even the text is just colored vector polygons! (Text rendering usually works by uploading a table of raster glyphs to the GPU and drawing textured quads.)
The brief story of how we got here: by November 2019, there was some basic support for uploading raster texture and drawing them. At the second Democracy Lab hackathon, a developer on Mac hit a 16 texture object limit that was different than Linux. This is also when Yuwen joined and started designing using Figma, which... conveniently had SVG export. I was also frustrated by rendering text separately from everything else; finding the bounding boxes was buggy and there were z-order issues. All of this prompted me to poke around and discover an example using lyon to tesellate the output from usvg. I thought, there's no way vectorizing EVERYTHING could be performant. But happily I was wrong.
Finally getting to the practical consequence here. It's expensive to upload
stuff to the GPU, but it's cheap to draw something already uploaded. So you use
a GeomBatch to build up that list of colored polygons, then upload it by doing
ctx.upload(batch). Later on, you can g.redraw(&drawable) as many times as
you want and it's fast. You don't keep the GeomBatch around; it's just the
builder for a Drawable.
How should you batch stuff? Issuing redraw calls is fast, but not when there's
lots of them. So for example, one Drawable per every building on the map would
be a nightmare. Since buildings don't change, there's a single batch and
Drawable for all of them. There's a balance here; sometimes you have to
experiment to find it. But generally, if recalculating a batch only needs to
happen every so often, just lump everything together in one for simplicity.
Stack of states
So at this point, there's logically one method to handle input events, and one method to draw. No built-in organization; all application state is just lumped somewhere. The basic insight is that an app has a stack of smaller states layered on top of each other. For example, you start with a title screen, then enter the main simulation interface, then open up a menu to show extra layers. You still want to draw the simulation underneath the menu, but not allow it to handle events. When you exit the simulation, you want to go back to the title screen and preserve any local state there.
So a widgetry app mainly consists of a stack of
States.
Each state implements a method to handle events and draw. Some states want to
draw what's underneath them, while some want to clear the screen and fully
handle everything -- so draw_baselayer specifies this.
When a state handles an event, it returns a Transition. This manipulates the
stack. Transition::Keep doesn't do anything; the current state remains.
Transition::Pop deletes the current state from the stack, and the previous one
takes over. Transition::Push introduces a new state, preserving the current
underneath. And so on.
There's actually two types of "state" (as in, data managed by the app): local
and global. Local "state" is owned by the struct implementing the State trait.
This is usually stuff like any UI panels (which we'll get to soon) and stuff
like which road we're editing, or what building we're examining. But usually an
app has a bunch of "state" that lasts for the entire lifetime of the program --
the map, the simulation, global settings. This stuff can change through the
program, like loading a new map, but every single State probably wants to use
it. This global stuff is stored in the App struct, which gets plumbed around.
So, each State has
fn event(&mut self, ctx: &mut EventCtx, app: &mut App) -> Transition -- self
is the local State on the stack, ctx is a handle into the generic widgetry
system, and app is that global "state". And there's also
fn draw(&self, g: &mut GfxCtx, app: &App), with GfxCtx being the hook to
draw stuff. Note draw uses immutable borrows; generally you shouldn't modify
anything while drawing. (When you need to, like for caching, usually
RefCell is the answer.)
This system of states and transitions mostly works, but there's one super
awkward problem. Sometimes, state1 needs to push on state2 in order to prompt
the user for input (free-form text, a menu, or even something more complicated)
and use the result of state2 in order to do something else. In normal
programming, this would just be calling a function and using the return value.
How do we make that work with the event/draw interface? The answer is for state2
to return Transition::Pop and Transition::ModifyState, downcast the previous
State into a particular struct, and shove the return value somewhere. This is
incredibly gross, but I'm not sure what else to do.
Panels
What's been described so far is kind of only useful for drawing and interacting with stuff in "map-space", aka, the scrollable canvas. What about normal GUI elements that live in "screen-space" on top of everything else -- buttons, dropdowns, checkboxes, frobnozzlers? There needs to be a way to create these, arrange them in some kind of layout, and use them for interaction. There's a bunch of ways that GUI frameworks manage the problem of synchronizing application "state" with the UI widgets, and it's more complex than usual in Rust, because you hit crazy lifetime and borrowing issues if you try to do anything with callbacks.
So sticking to the widgetry philosophy of seeing how far the low-level
abstractions stretch, widgets are just temporary "state" managed by a State.
They're always managed as part of a Panel, even if you have just a single
button. Constructing Panels is hopefully straightforward from examples; you
assemble a tree of rows and columns, with some occasional styling and layouting
hints thrown in. Underneath, widgetry uses
stretch for CSS Flexbox-style layouting.
There are some quirks, most of which we've worked out and hopefully papered over
(like padding and margin don't work on most widgets directly; you have to
wrap them in a Widget::row or Widget::col).
So how do you know if a button has been clicked, a toggle toggled, a slider
slidden, a frobnozzler frobnuzzled? In some languages, you might expect
callbacks, but here in widgetry, you have to explicitly ask. Most States will
match self.panel.event(ctx) somewhere near the top. This takes the current
event (a low-level keypress or mouse movement) and lets all of the widgets
inside the Panel possibly use it. If the event caused the widgets to do
something interesting, the entire Panel will return
Some(Outcome::Clicked("button name")) or
Some(Outcome::Changed("spinner name")). The State code can then interpret
that UI-level event appropriately.
Currently, the widgets in a Panel are identified by lovely type-unsafe
hardcoded strings. This isn't the best, but in practice, it's rare to get out of
sync between the two places in one file that talk about the same widget.
Some widgets have more information than just "the button was clicked". Whenever
you need to, you can just query their state --
self.panel.slider("time").get_percent(), self.panel.dropdown_value("mode"),
self.panel.spinner("duration"). These last two are generic, and the compiler
usually infers the type of the value contained. (Internally, we just downcast to
that type, so you'd get a runtime panic if you mess up.)
Updating panels
Sometimes you need to change a Panel, often in response to something done on
that panel -- like say you toggle between showing raw data points versus
aggregating in a heatmap, and want to expose extra heatmap settings. There are
two choices for how to do this: build a new panel entirely, or replace one
widget.
Often it's simplest to just split the method that builds a Panel into its own
method, and call it again with some different parameters. Very very occasionally
when you take this approach, you'll need to do
new_panel.restore(ctx, &self.panel); self.panel = new_panel; to retain
internal widgetry state, such as "this scrollbar is in the process of being
dragged by the mouse."
Or you can just replace one widget (which may be an entire row or column of
stuff; it's just based on the string ID you specify).
self.panel.replace(ctx, "edit", new_button) does the trick.
SimpleState
The free-formed nature of State::event is sometimes overwhelming; how do you
order all of the things that need to happen? You could also implement
SimpleState
when you only have a single Panel. This gives a slightly more opinionated
interface, telling you when a button was clicked, slider was changed, when the
mouse was moved, etc. If you're confused, see how it implements fn event --
it's just organizing some typical different things that happen to handle an
event.
Higher layers
Someday we want to release widgetry for general use to the Rust community. But
there's also lot of code shared between game, fifteen_min, and other apps
that handles UI concerns specific to map_model, which isn't something most
people will care about. This stuff goes in map_gui.
Lots of the map_gui code implements widgetry States, but those are
parameterized by a particular App struct. Since each of the top-level crates
uses a different struct, there's an
AppLike trait
to handle this level of indirection. If it walks like a duck...
Rendering maps
There are generally two strategies for drawing the map. In the unzoomed view, we
tend to have a single Drawable for all buildings, another for all roads, etc.
In the zoomed view, only a few map elements (bus stops, lanes, buildings) are
visible at a time, so we can afford to show more detail, and store a Drawable
per object. In fact, there's no need to even calculate all of this zoomed-in
detail upfront; many maps are huge, and a player won't zoom into every section
in a particular session. So internally, most of the
Renderables
use RefCell and lazily calculate what to draw.
DrawMap internally manages a
quadtree to figure out what to draw
and to help figure out what object is under the mouse cursor.
async madness
If you want to see some scary Rust, check out
load.rs.
There's a fatal flaw with the core winit event loop -- it was written before
Rust async landed. It's generally bad to spend more than a few milliseconds in
either event or draw; the app will appear sluggish, and at some point, the
window manager warns that the app is frozen. This happens when we
synchronously/blockingly load a big file from disk, or worse, from the network.
We're starting to figure out some of the workarounds. When there's "proper"
async Rust code, like for downloading a file on native, the trick is to spawn a
separate thread to execute the async block. The main thread (where event and
draw and most things run) stashes a Future inside of the State. In
event, it non-blockingly polls the future to see if its done. If not,
immediately return control to the window manager and just ask it to wake things
up again in a few milliseconds. Proper loading screens can be drawn this way.
All of this gets more complicated on the web, because you can't really spawn a thread without somme web worker magic. It's still possible to make async HTTP fetches work, but it's not all wired together yet.
Map model
A/B Street transforms OpenStreetMap (OSM) data into a detailed geometric and semantic representation of the world for traffic simulation. This chapter describes that map model, with the hopes that it'll be useful for purposes beyond this project.
Overview
A Map covers everything inside some hand-drawn boundary, usually scoped to a
city or a few of a city's districts. Unlike OSM, it doesn't cover the entire
world; it only has areas specifically extracted for some purpose.
A map consists of many objects. Mainly, there are roads, broken down into individual lanes, and intersections. A road is a single segment connecting exactly two intersections (as opposed to OSM, where a single "way" may span many intersections). Lanes within a road have a specific type, which dictates their direction of travel (or lack of travel, like on-street parking) and uses. Sidewalks are represented as bidirectional lanes. Roads connect at intersections, which contain an explicit set of turns, each linking a source lane to a destination lane.
Maps also contain parking lots and buildings, which connect to the nearest driveable lane and a sidewalk. Maps have water and park areas, only used for drawing. They also represent public transit stops and routes.
How is a map used?
Unlike some GIS systems, maps don't use any kind of database -- they're just a file, anywhere from 1 to ~500MB (depending on the size of their boundary). Once loaded into memory, different objects from the map can be accessed directly, along with a large API to perform various queries.
Most of the map's API is read-only; once built, a map doesn't change until user-created edits are applied.
The pipeline to import a map from OSM data (and also optional supplementary, city-specific data) is complex and may take a few minutes to run, but it happens once offline. Applications using maps just read the final file.
Features
Why use A/B Street's map model instead of processing OSM directly?
TODO: Order these better. For each one, show before/after pictures
Area clipping
Bodies of water, forests, parks, and other areas are represented in OSM as relations, requiring the user to stitch together multiple polylines in undefined orders and handle inner holes. A/B Street maps handle all of that, and also clip the area's polygon to the boundary of the entire map -- including coastlines.
Road and intersection geometry
OSM represents roads as a polyline of the physical center of the road. A/B Street infers the number and type of lanes from OSM metadata, then creates individual lanes of appropriate width, each with a center-line and polygon for geometry. At intersections, the roads and lanes are "trimmed back" to avoid overlapping, and the "common area" becomes the intersection's polygon. This heuristic process is reasonably robust to complex shapes, with special treatment of highway on/off-ramps, although it does still have some bugs.
Turns
At each intersection, A/B Street infers all legal movements between vehicle lanes and sidewalks. This process makes use of OSM metadata about turn lanes, inferring reasonable defaults for multi-lane roads. OSM turn restriction relations, which may span a sequence of several roads to describe U-turns around complex intersections, are also used.
Parking lots
OSM models parking lots as areas along with the driveable aisles. Usually the capacity of a lot isn't tagged. A/B Street automatically fills paring lots with individual stalls along the aisles, estimating the capacity just from this geometry.
Stop signs
At unsignalized intersections, A/B Street infers which roads have to stop, and which have right-of-way.
Traffic signals
OSM has no way to describe how traffic signals are configured. A/B Street models fixed-timer signals, automatically inferring the number of stages, their duration, and the movements that are prioritized and permitted during each stage.
Pathfinding
A/B Street can determine routes along lanes and turns for vehicles and pedestrians. These routes obey OSM's turn restriction relations that span multiple road segments. They also avoid roads that're tagged as not allowing through-traffic, depending on the route's origin and destination and vehicle type. The pathfinding optionally makes use of contraction hierarchies to greatly speed up query performance, at the cost of a slower offline importing process.
Bridge z-ordering
OSM tags bridges and tunnels, but the roads that happen to pass underneath bridges aren't mapped. A/B Street detects these and represents the z-order for drawing.
Buildings
Similar to areas, A/B Street consolidates the geometry of OSM buildings, which may be split into multiple polygons. Each building is also associated with the nearest driveable lane and sidewalk, and metadata is used to infer a land-use (like residential and commercial) and commercial amenities available.
Experimental: public transit
A/B Street uses bus stops and route relations from OSM to build a model of public transit routes. OSM makes few guarantees about how the specifics of the route are specified, but A/B Street produces specific paths, handling clipping to the map boundary.
... All of this isn't the case yet, but it's a WIP!
Experimental: separated cyclepaths, tramways, and walking paths
Some cyclepaths, tram lines, and footpaths in OSM are tagged as separate ways, with no association to a "main" road. Sometimes this is true -- they're independent trails that only occasionally cross roads. But often they run alongside a road. A/B Street attempts to detect these and "snap" them to the main road as extra lanes.
... But this doesn't work yet at all.
Deep dive into devilish details: Intersection geometry
By Dustin Carlino, last updated September 2021
Some of the things in A/B Street that seem the simplest have taken tremendous effort. Determining the shape of roads and intersections is one of those problems, so this article is a deep-dive into how it works and why it's so hard.
Note: The approach I'll describe has many flaws -- I'm not claiming this is a good solution, just the one that A/B Street uses. If you see a way to improve anything here, let me know about it!
- Trying this out
- Background
- The main process
- Interlude: problems so far
- Intersection consolidation
- Conclusion
- Appendices
Trying this out
Originally I wanted to embed code in this article and have interactive demos to explore each step. That level of ambition fell through, but there is a geometry debugging tool, running in your browser (with WASM and WebGL required): launch the tool.
The tool wasn't designed for ease-of-use, so some hints on using it:
- Click and drag to move, scroll to zoom
- Toggle intersection geometry on/off with the right panel or by pressing g
- Click and drag an intersection or an internal point in a curved road to move it
Background
Most street maps you'll find provide a simplified view of streets. Google Maps, Apple Maps, and most OpenStreetMap (OSM) renderers mostly just tell you the road's name, color it by type (a highway, major arterial road, minor residential street), take great liberties with the width, and don't explicitly distinguish intersections from roads. These maps are used for navigation and drawing your attention to nearby businesses, so this is quite a reasonable view.
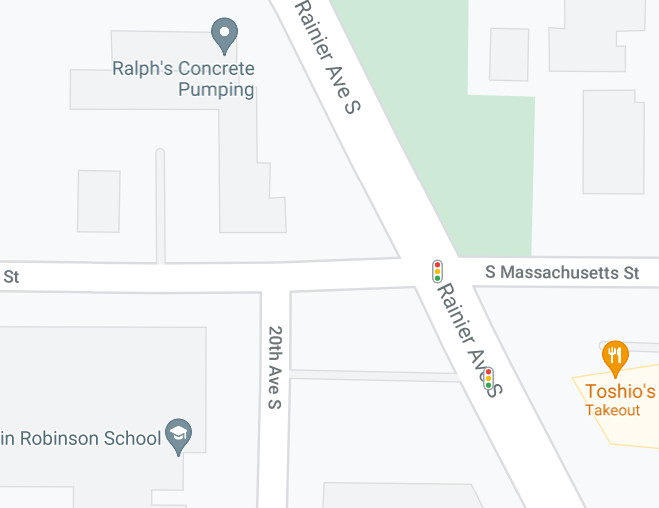
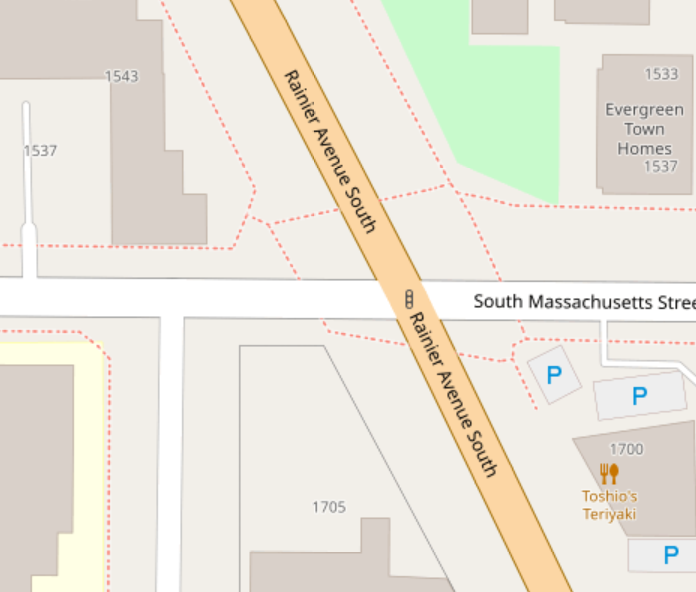
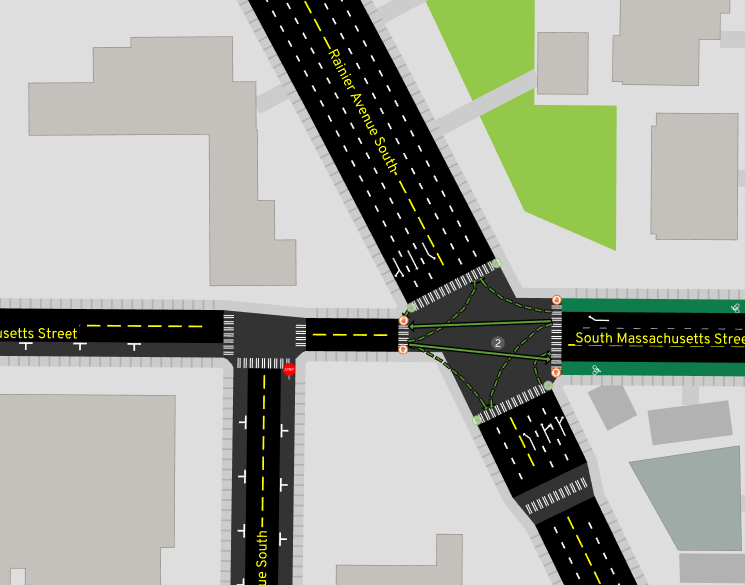
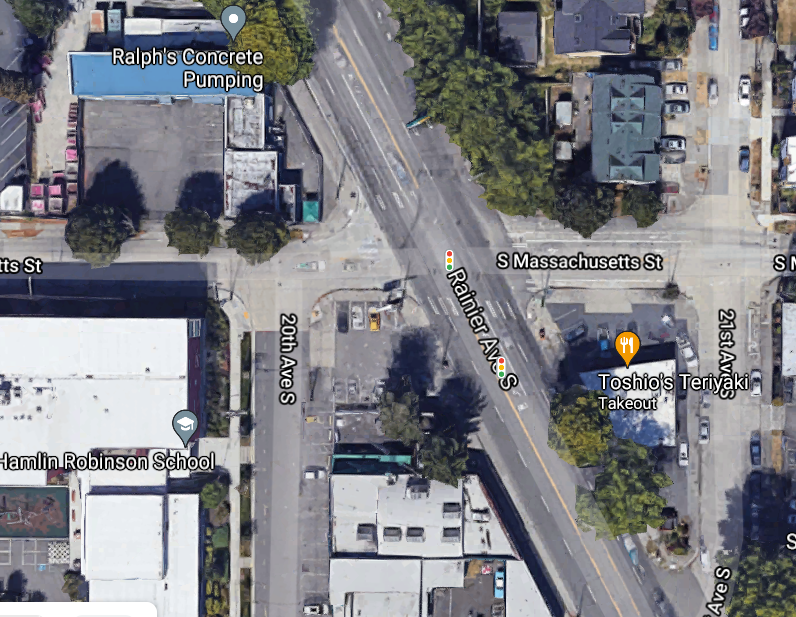
A/B Street is all about imagining how traffic moves through a city and exploring the effects of redesigning streets. So of course, we need way more detail. To imagine a bike lane down Eastlake Ave instead of street parking, we need to first see how the street's space is allocated. To propose a more pedestrian-friendly traffic signal crossing from Husky Stadium to the UW medical building, we need to see that huge intersection.
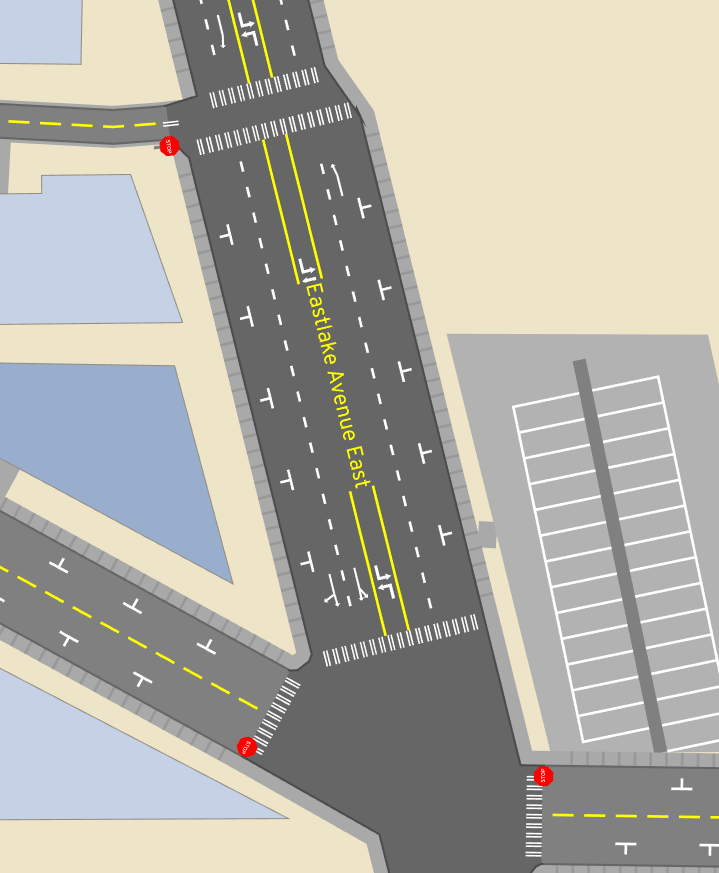
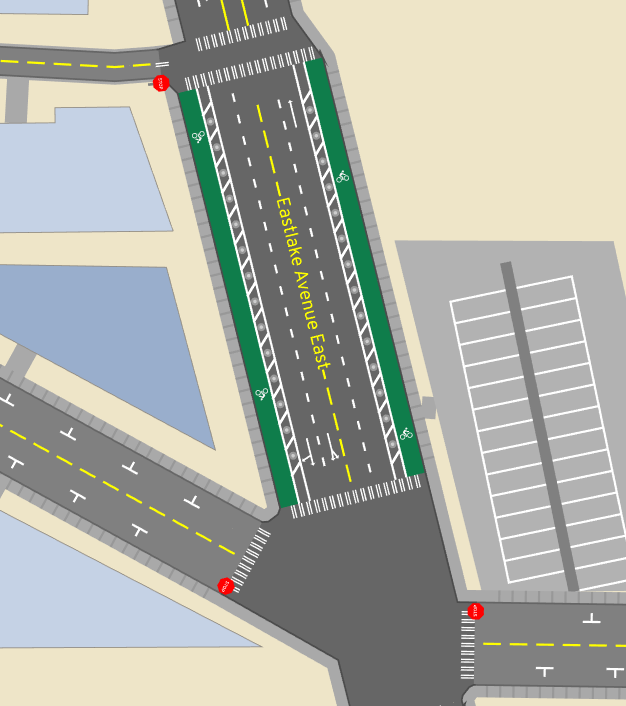
At a high-level, we want a representation that:
- Clearly communicates how a road is divided into different types of lanes (general purpose driving, turn lanes, bike lanes, bus-only lanes, street parking, sidewalks)
- Represents the total road width, which tells us how we might change that lane configuration
- Divides paved area into distinct roads and intersections. This division tells us where vehicles stop before entering an intersection, how pedestrians and vehicles are likely to move through the space, and what conflicts between them might occur.
We're constrained to publicly available, free data sources. Although some cities have GIS departments with some datasets that might be helpful, we're pretty much going with OpenStreetMap (OSM), which has decent coverage of most cities worldwide.
Desired output
Let's be a little more specific about the representation we want. If you imagine a city as flat 2D space, roads and intersections occupy some portion of it. (Let's ignore bridges and tunnels.)

We want to partition this space into individual intersections and road segments. Each road segment (just called "road" for simplicity) leads between exactly two of those intersections. This partition shouldn't have any ambiguous overlap between objects.

A simplifying assumption, mostly coming from OSM, is that roads can be represented as a center-line and width, and individual lanes can be formed by projecting that center-line left and right. This means when the road changes width in the middle (like for pocket parking or to make room for a turn lane), we have to model that transition as a small "degenerate" intersection, which connects only those two roads.
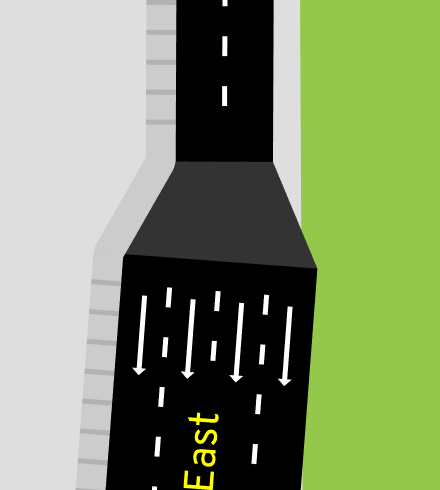
Another assumption taken by A/B Street is that roads hit intersections at a perpendicular angle.
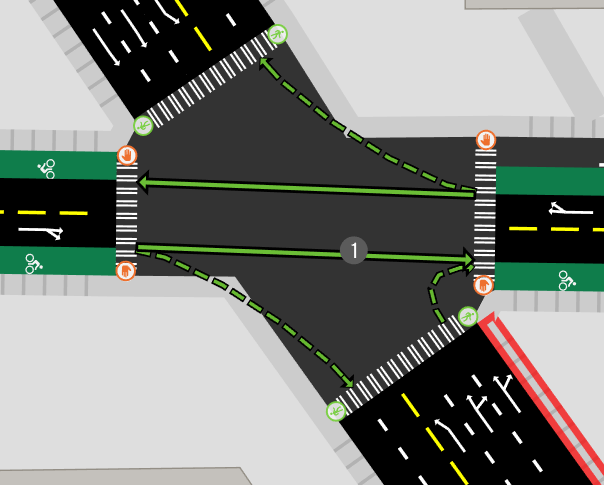
We use this division to determine where vehicles stop, and where a crosswalk exists:
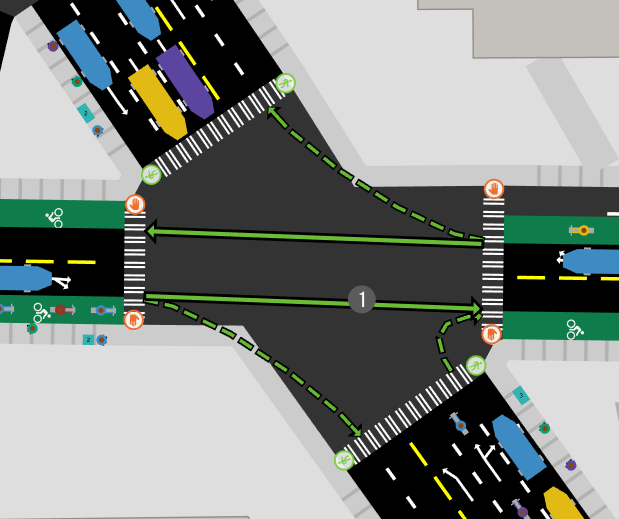
Of course, this assumption isn't always true in reality:
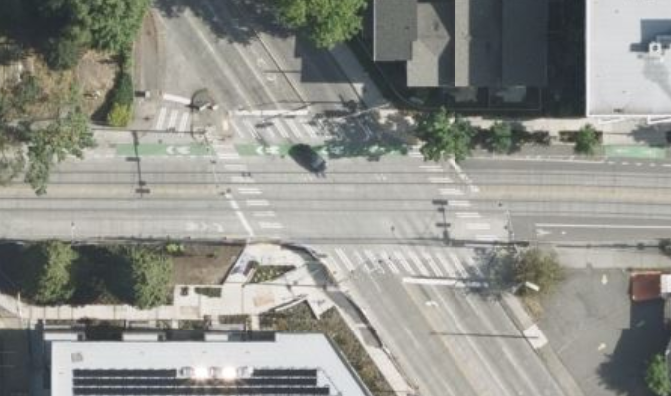
If we allowed roads to hit intersections at non-perpendicular angles, but still insisted that the stop position for each individual lane was perpendicular, it might have a "jagged tooth" look:
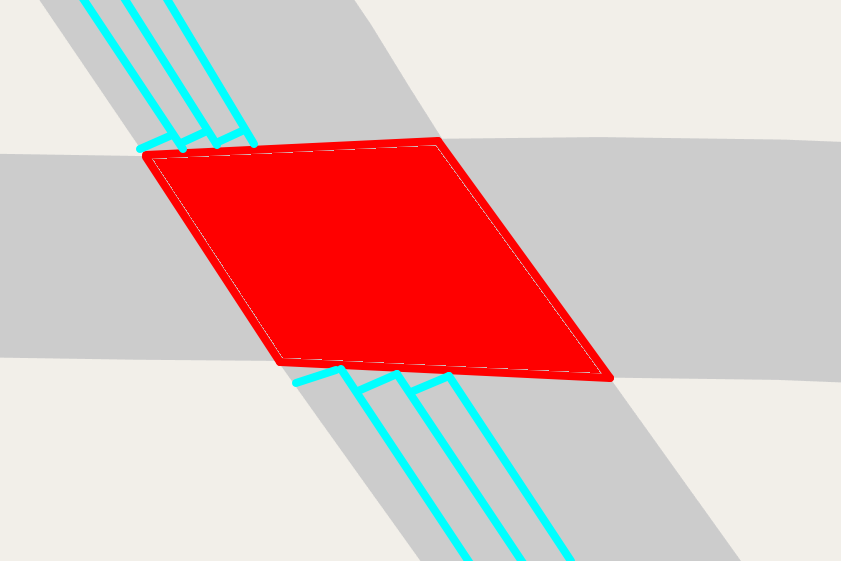
But for the sake of this article, these're the assumptions we're sticking with. Pedestrian islands, slip lanes, gores, and medians are all real-world elements that don't fit nicely in this model.
The main process
We'll now explore the steps to produce geometry for a single intersection and its connected roads. The broad overview:
- Pre-process OSM into road center-lines with attributes, with each road connecting just two intersections.
- Thicken each road
- Trim back the roads based on overlap
- Produce the intersection polygon
Let's pick a particularly illustrative five-way intersection as our example.
Part 1: Thickening the infinitesimal
OSM models roads as a center-line -- supposedly the physical center of the paved area, not the solid or dashed yellow line (at least in the US) separating the two directions of traffic. The schema, and how it gets mapped in practice, is fuzzy when there are more lanes in one direction than the other or when roads join or split up for logical routing, but... let's keep things simple to start.
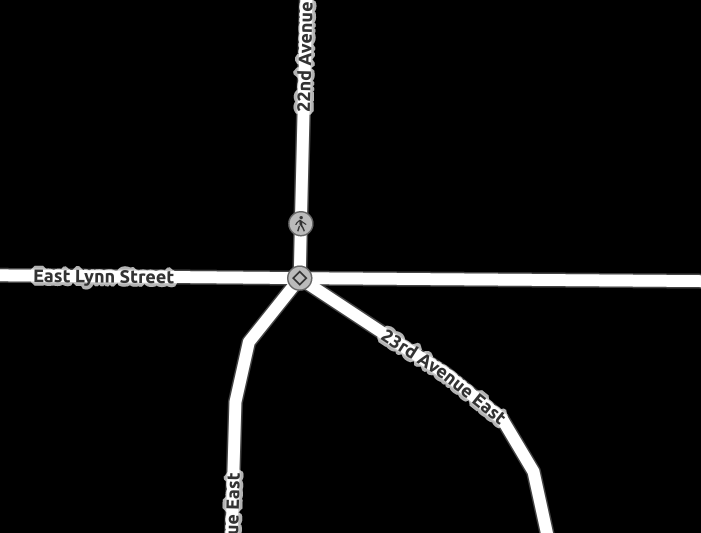
OSM has a few tags for explicitly mapping road width, but in practice they're not widely used. Instead, we have a whole bunch of tags that describe the lane configuration of the road. A/B Street interprets these and produces an ordered list of lanes from the left side of the road to the right, guessing the direction, width, and type of each lane. See the code here -- it's fairly lengthy, but has some intuitive unit tests. This interpretation of tags is hard in practice because the schema is very confusing, there are multiple ways of mapping the same thing, people make many mistakes in practice, etc.
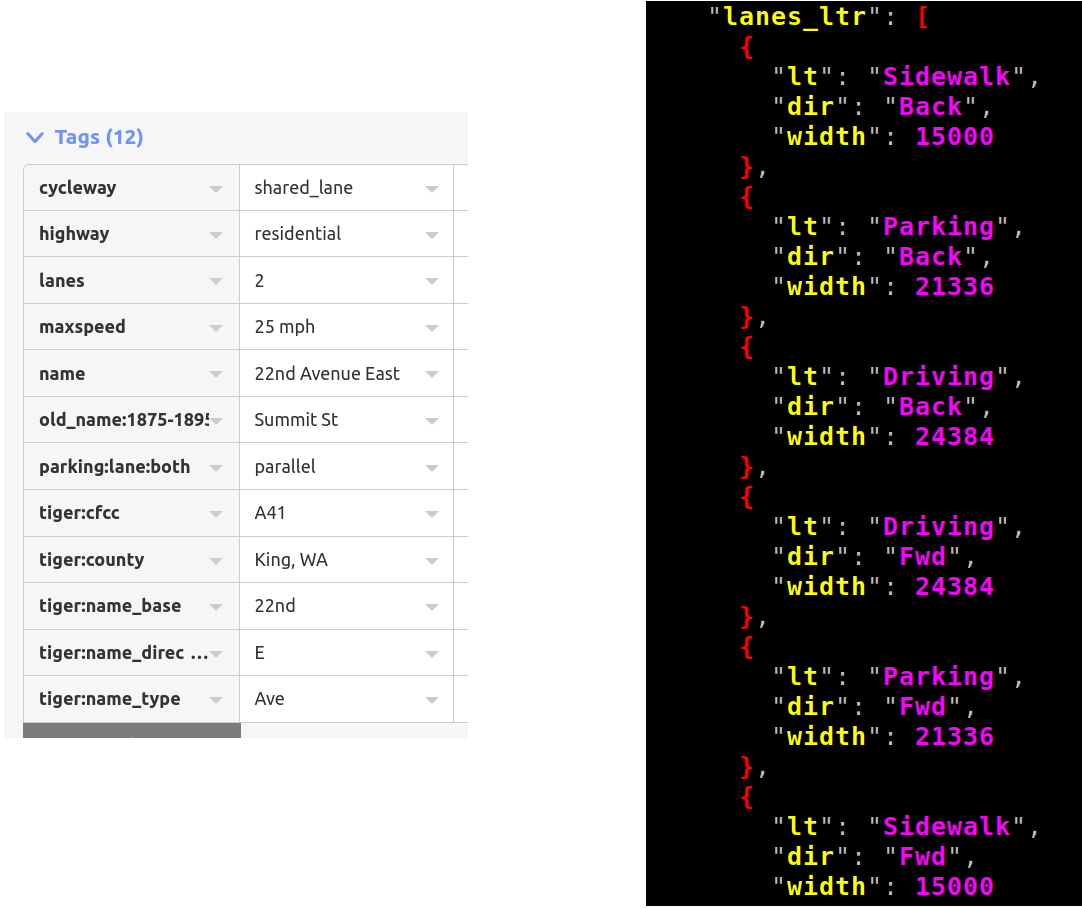
So for each road, we estimate the total width based on the lane tagging. Then we project the center line to the left and right, giving us a thickened polygon for the entire road:
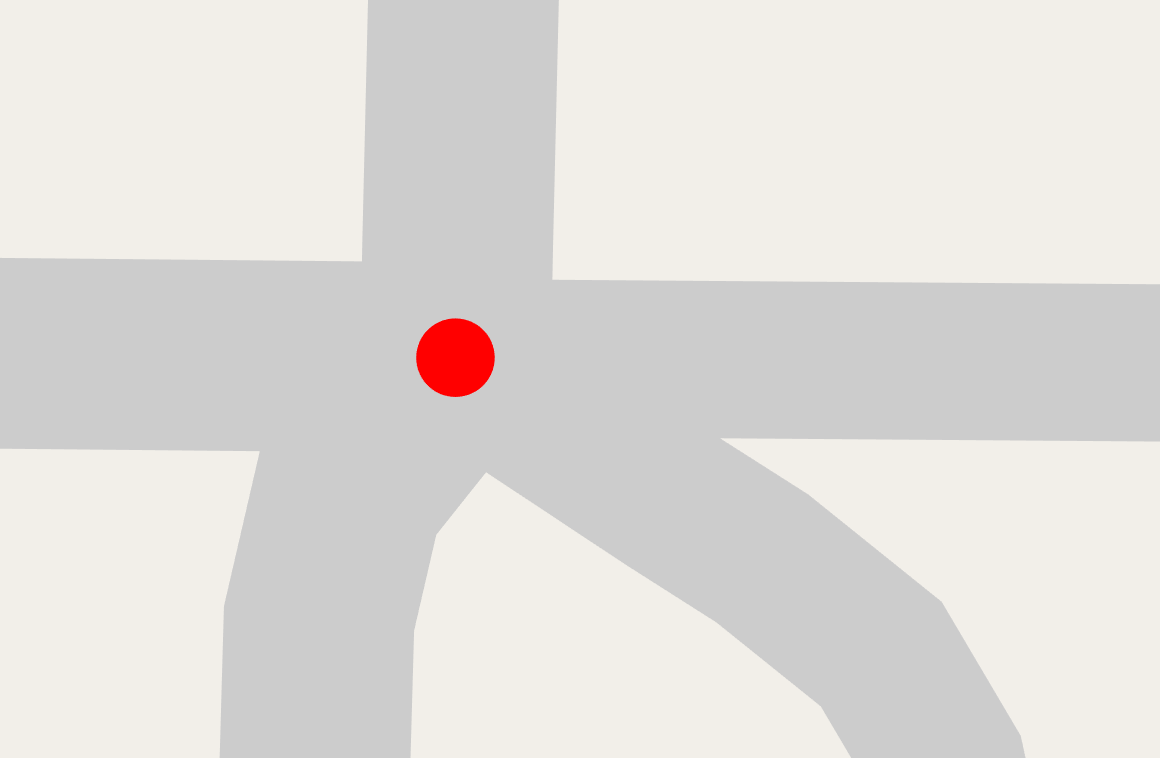
Projecting a polyline
Before we move on, a quick primer on how to take a polyline (an ordered list of points) and project it to the left or right. For a much better explanation, see part 1 and 2 from Rye Terrell's blog. I wouldn't call A/B Street's implementation fantastic, but it's there for reference.
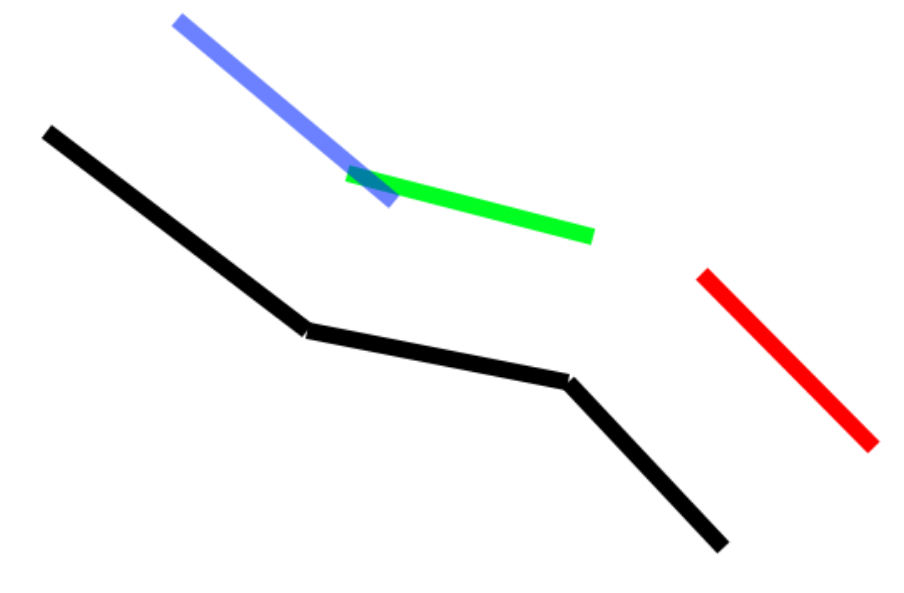
The original polyline is in black. If you can't tell from my quick drawing, it consists of 3 line segments glued together. We want to shift it to the right some distance. We start by taking each line segment and projecting it to the right that distance. That operation is simple -- rotate the line's angle by 90 degrees, then project the line's endpoints that direction. The 3 projected line segments are shown in blue, green, and red.
There are two types of problems we need to fix for the new polyline to be glued together nicely. The blue and the green line segment intersect each other, so we'll trim both segments to that common point:
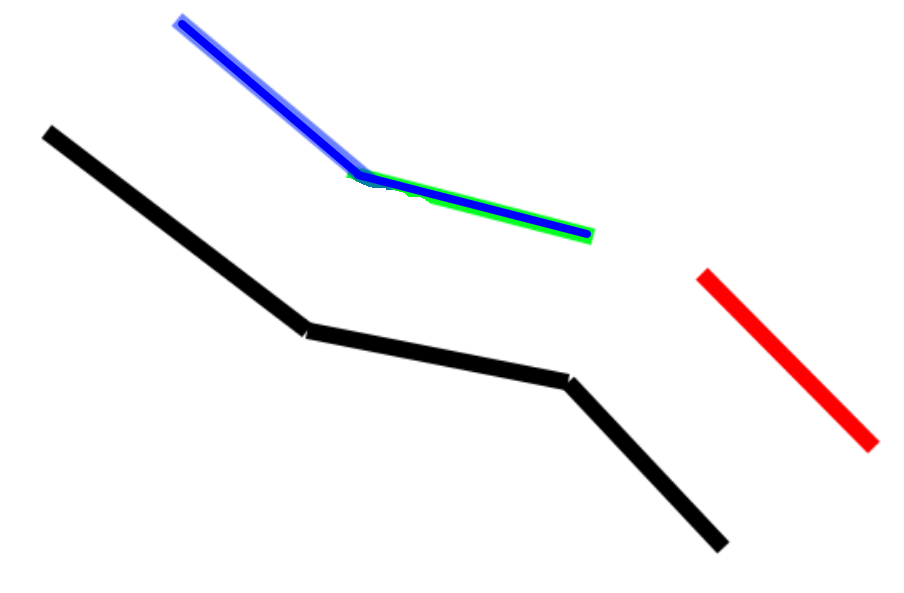
The green and the red line segments are far apart. Let's imagine they keep extending until they do intersect. If I recall proper terminology, this is a miter join:
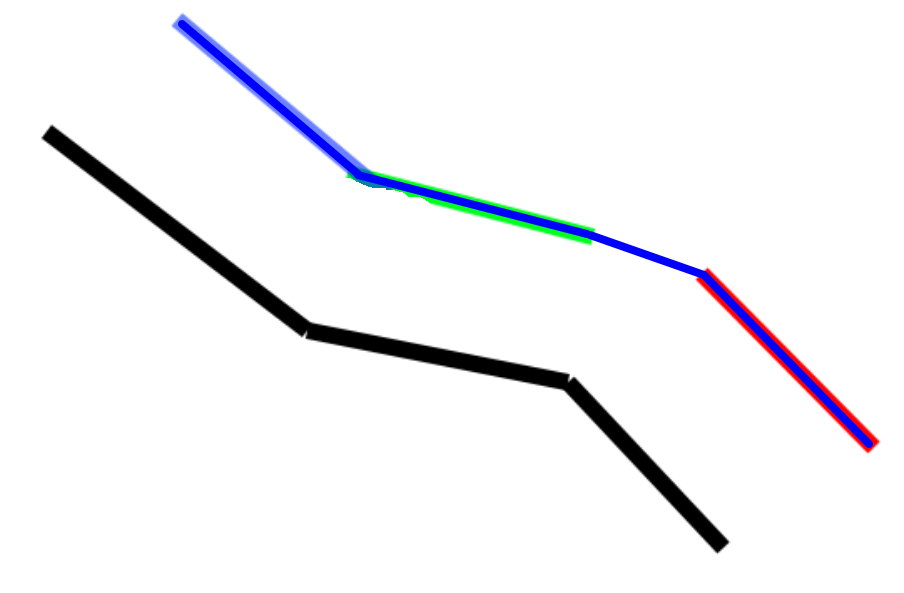
And that's it! Easy.
... Except not really. The real world of OSM center-lines has every imaginable edge case. When a road is both thick and sharply angled enough, extending those line segments until they meet works... but the hit might be very far away:

My workaround currently is to hardcode a maximum distance away from the original line endpoints. If our miter cap reaches beyond that, just draw a straight line between the two segments. I think this is known as a bevel join.
Just for fun, let's see what happens when a polyline doubles back on itself in some less-than-realistic ways:
Truly Lovecraftian geometry. I don't think I often see points from OSM totally out of order like this, but it happens sometimes and is immediately obvious.
Part 2: Counting coup
For each road, we've got the original center from OSM and our calculated the left and right side:
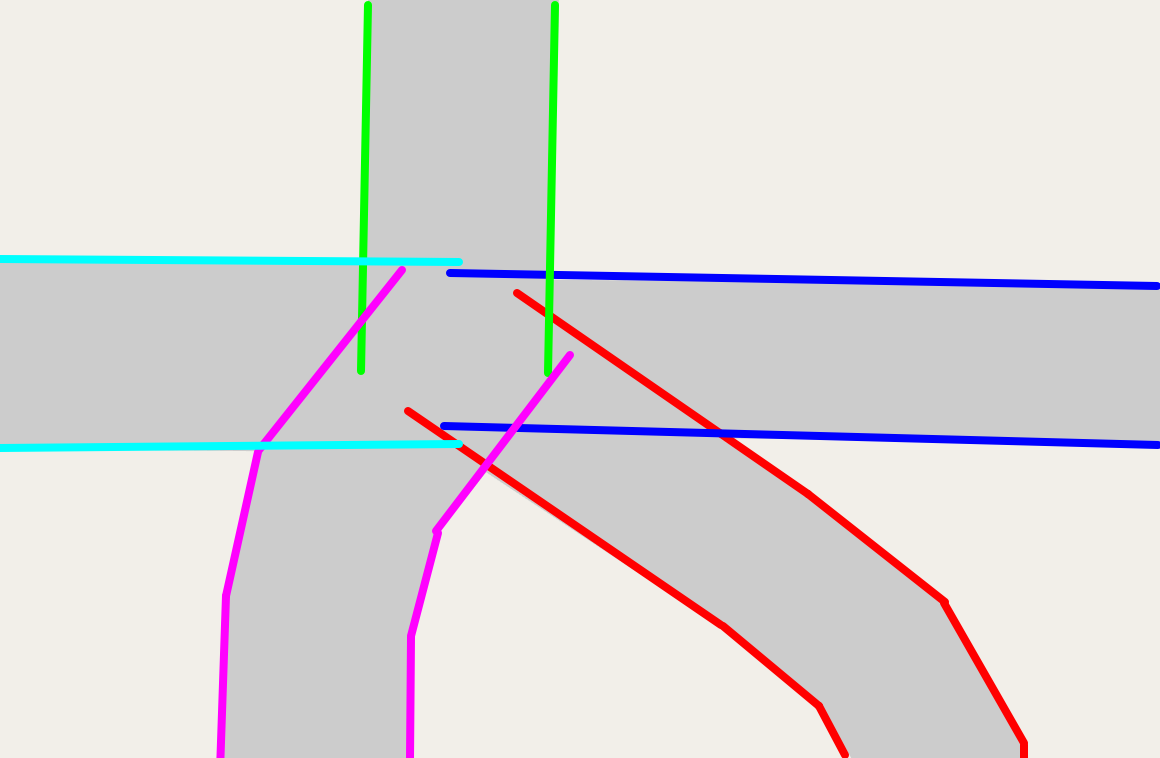
Now the magic happens. You'll notice that many of those polylines collide (For sanity, let's call these "collisions" and not "intersections", since that term is overloaded here!). Let's find every collision point:
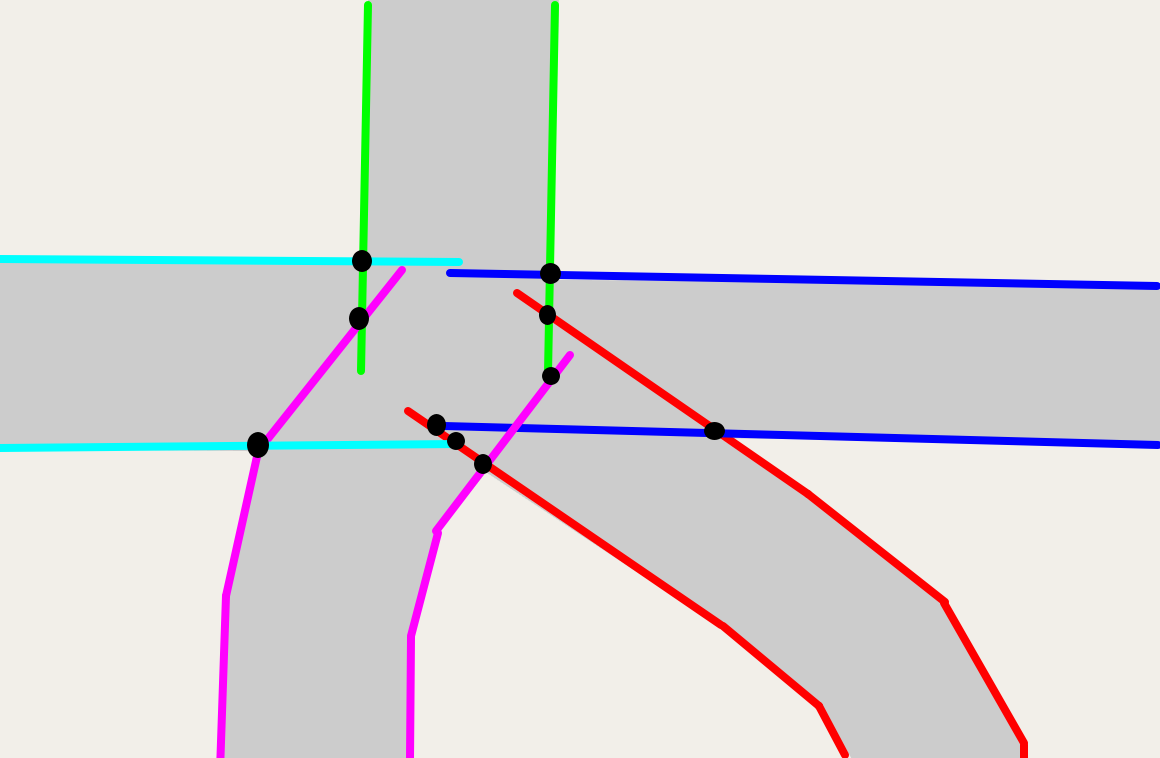
These collisions represent where two thickened roads overlap. So let's use them to "trim back" the roads and avoid overlap. For each collision, we form an infinitely long line perpendicular to the collision and find where it hits the original center-line. We'll trim the road back to at least that point.
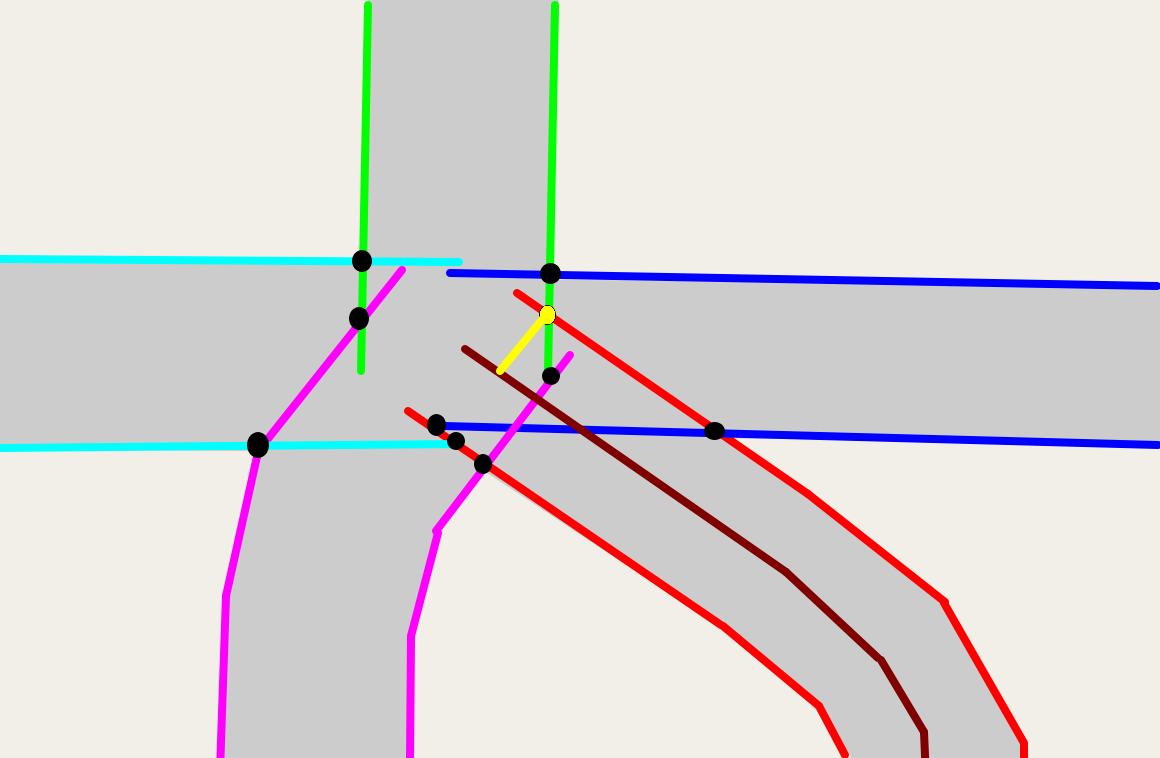
Because we want roads to meet intersections perpendiculously (I'm quite sure that's the proper term), we want the left and right side of a road to line up. There's probably a collision on a road's left and right side, and usually one of them would cause the center-line to be trimmed back more than the other. We'll always trim back as much as possible.
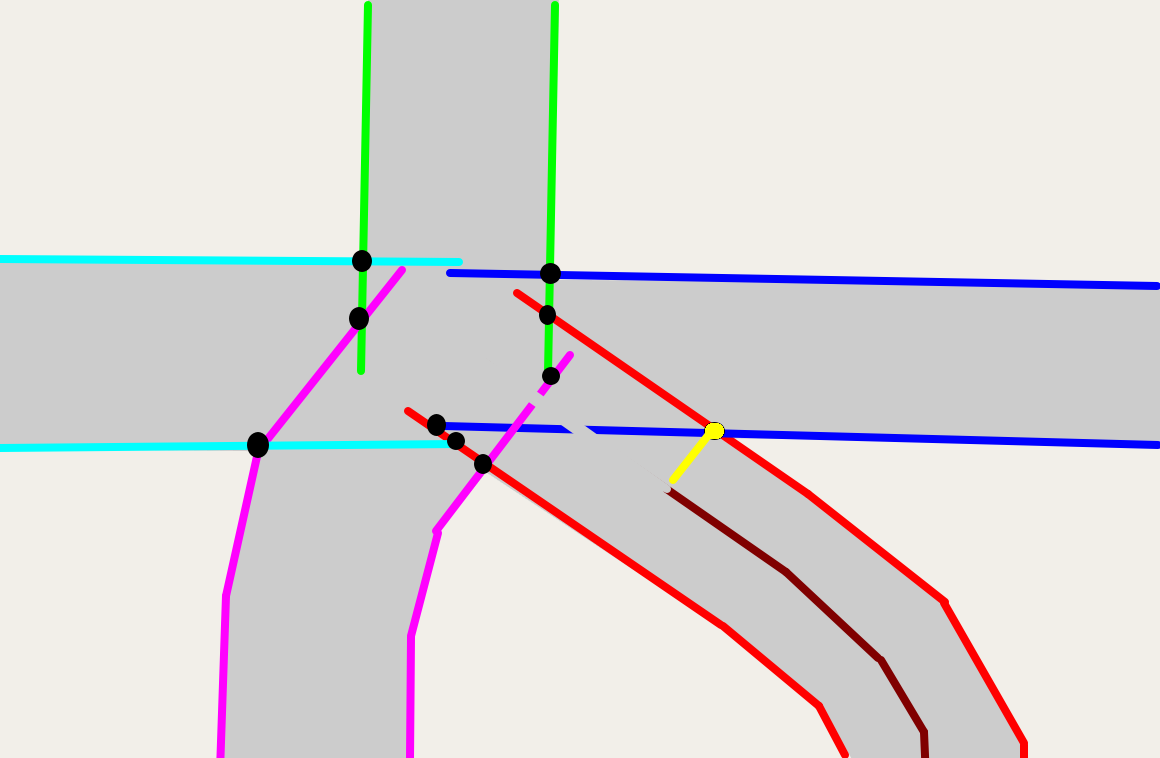
If we repeat this for every collision, eventually we wind up with:
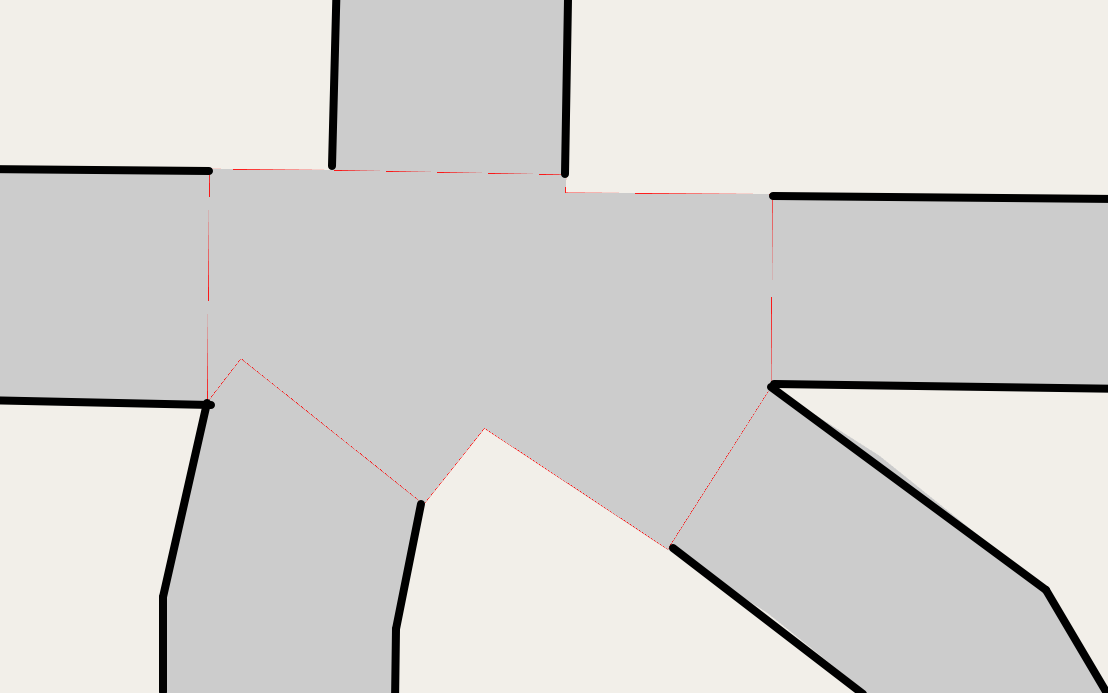
Some questions to consider:
-
Why look for collisions between every pair of left/right lines? Couldn't we just use the "adjacent" pairs?
-
Is it ever possible for the line perpendicular to a collision to NOT hit the original center-line?
(As I'm reviewing my old code and writing this up, these're things I don't remember, worth revisiting.)
Part 3: The clockwise walk
We've now trimmed roads back to avoid overlapping each other. We just need to generate the polygon for the intersection. As a first cut, let's take these trimmed center-lines, calculate the left and right polylines again (since we've changed the center line), and use the endpoints for the shape.
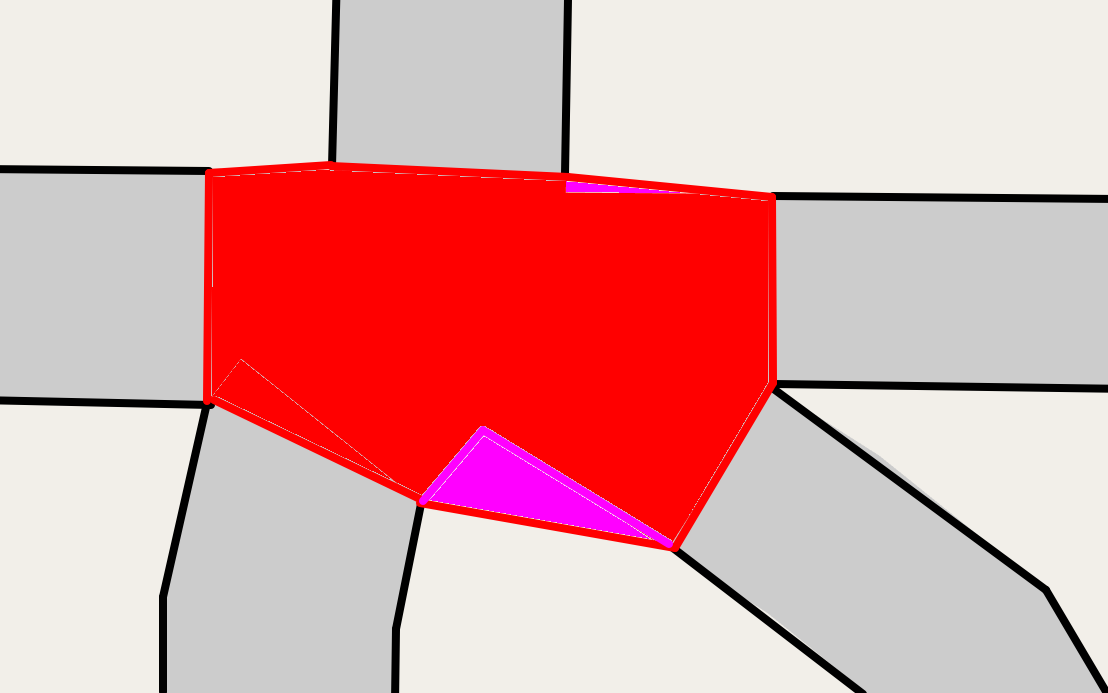
Oops, the polygon covers a bit too much space! Cut red tape, queues, and split ends, but not corners. What if we remember all of the collision points, and use those too?
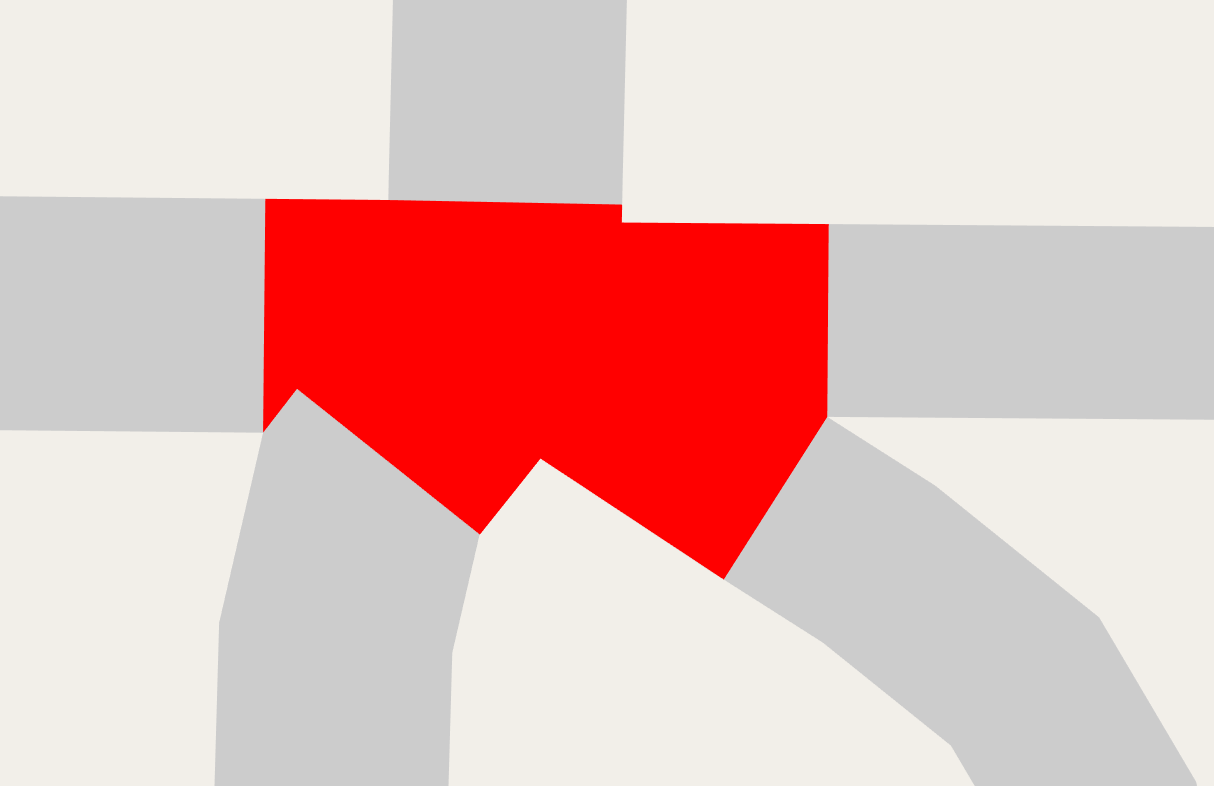
Much better.
Sorting roads around a center
I snuck a fast one on ya. When we form a polygon from these left/right endpoints and the original collision points, how do we put those points in the correct order? Seemingly innocent question.
There are a few approaches that work fine for the simple cases. First, from OSM we know the single point where the 5 road center lines meet. After we've calculated the points for the intersection polygon, we can use that single point, calculate the angle to each polygon point, and sort. That works fine.
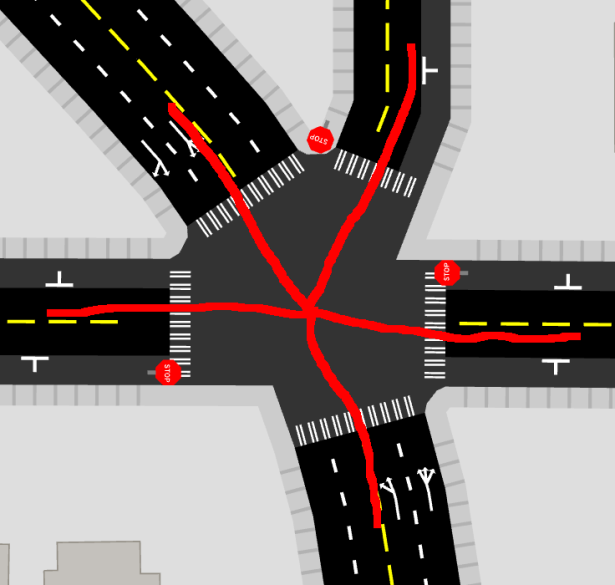
Foreshadowing: But soon, things won't be so simple.
Interlude: problems so far
That wasn't actually so bad! The results are reasonable in many cases:
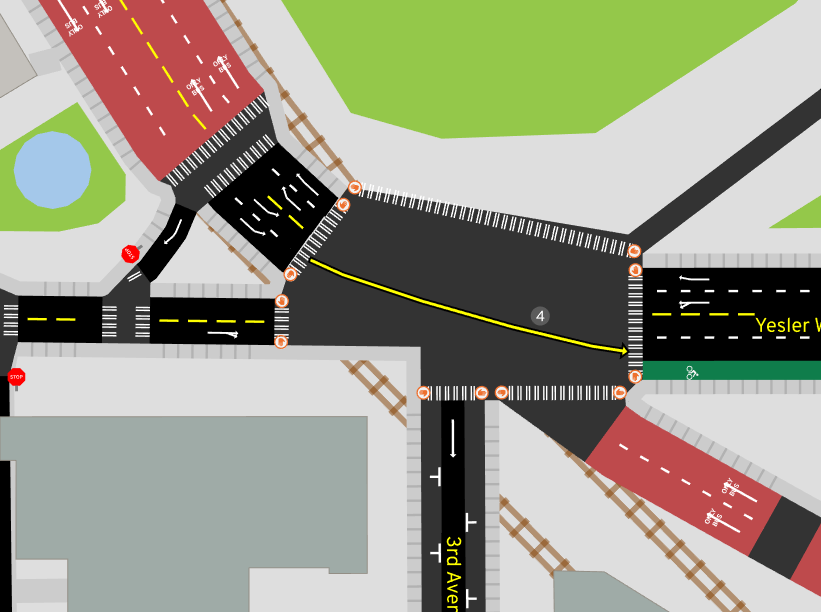
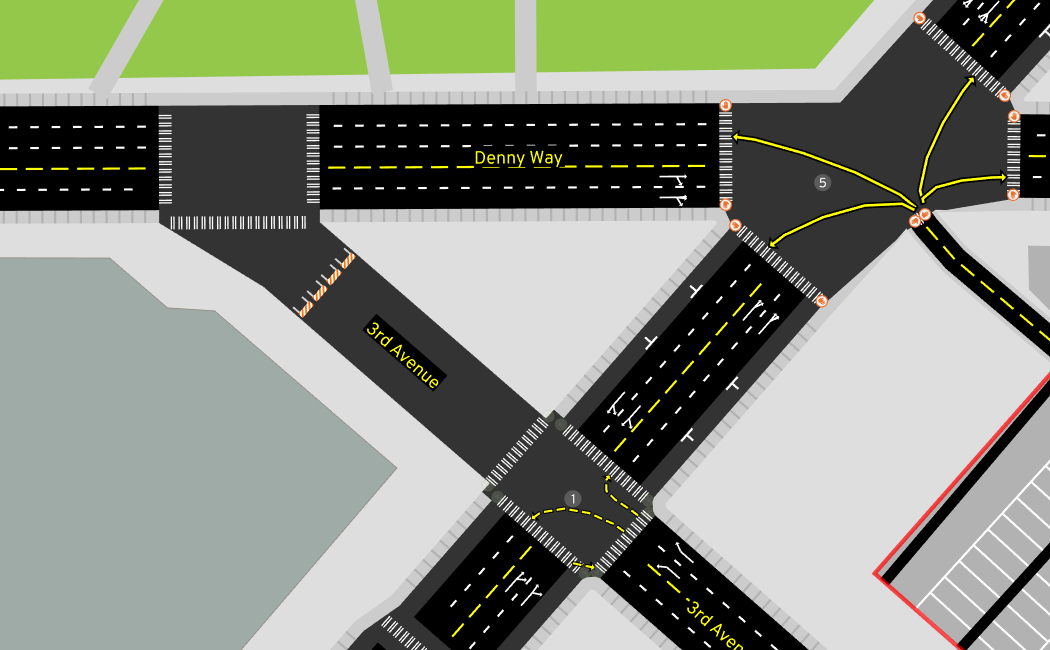
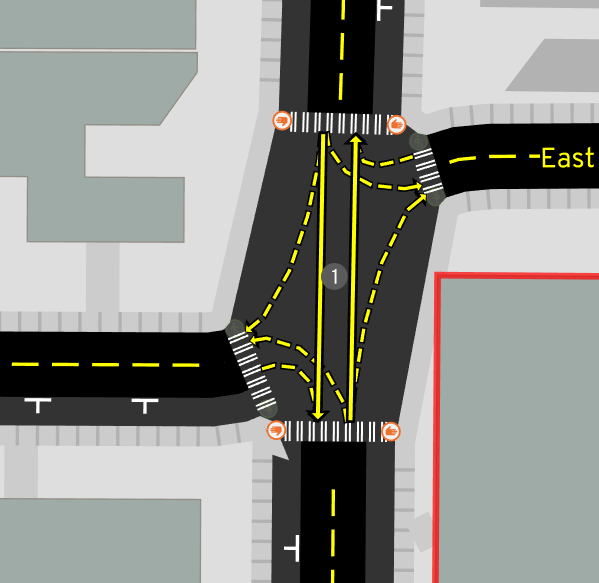
But what kind of things go wrong?
Funky sidewalks
What's going on with the sidewalk in that last example?
Lovecraftian geometry
Sometimes followers of Cthulu edit OSM, I assume.
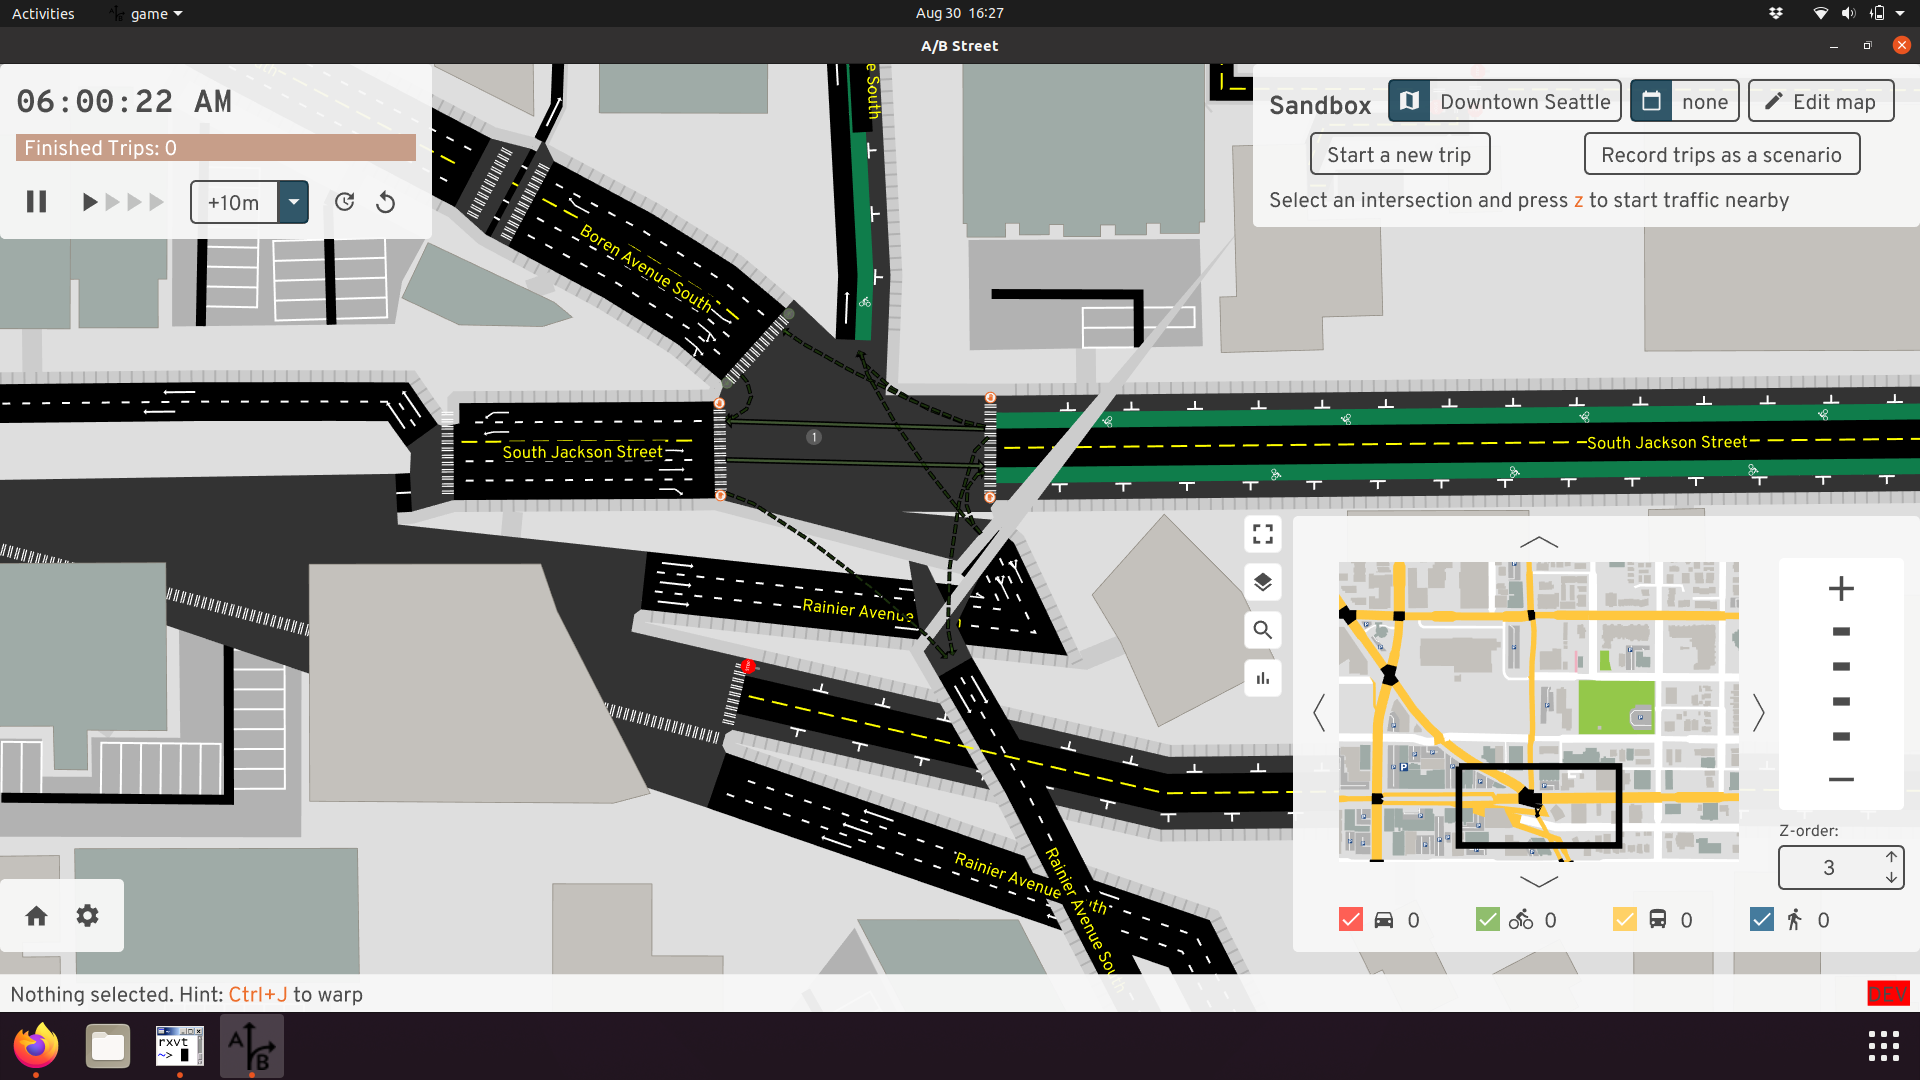
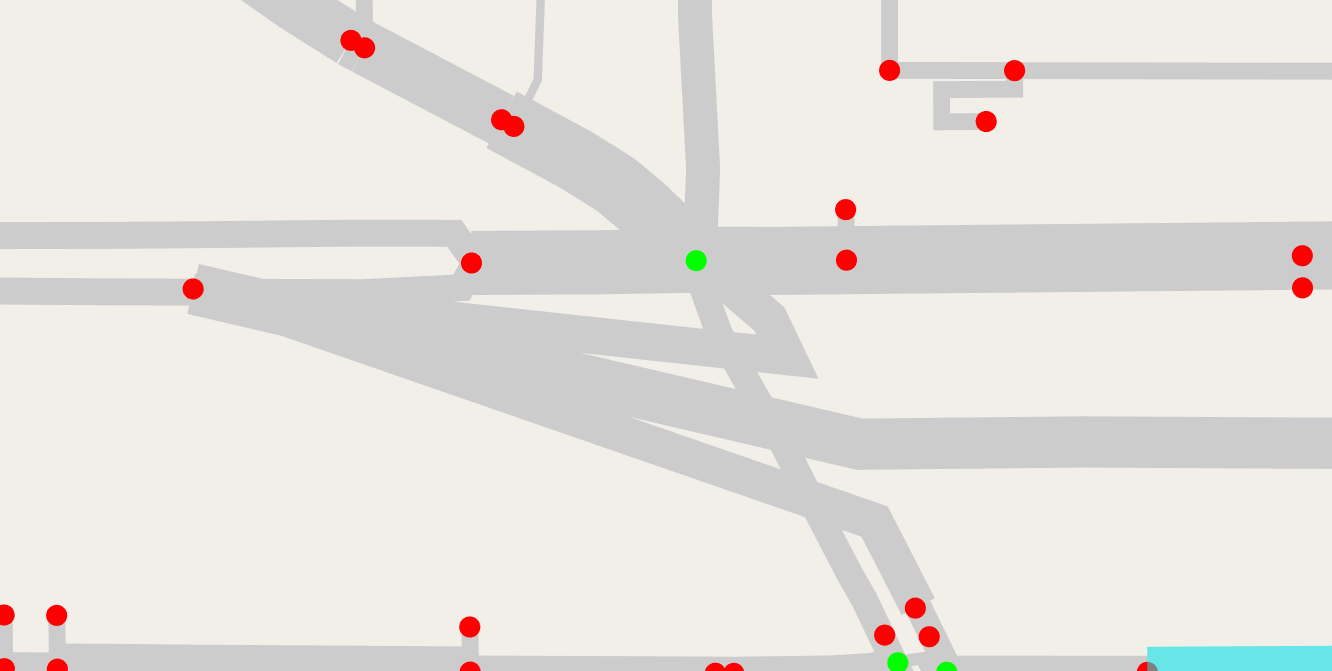
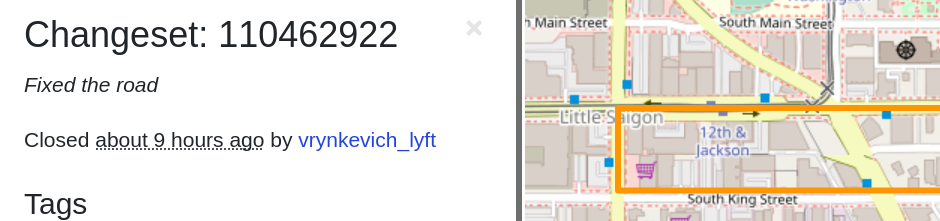
Bad OSM data
Often times, the upstream OSM data is just flat-out wrong. Center lines for divided one-way roads are way too close to each other, so using the number of lanes with a reasonable guess at width produces roads that overlap outside of the intersection. This throws off everything we've done!
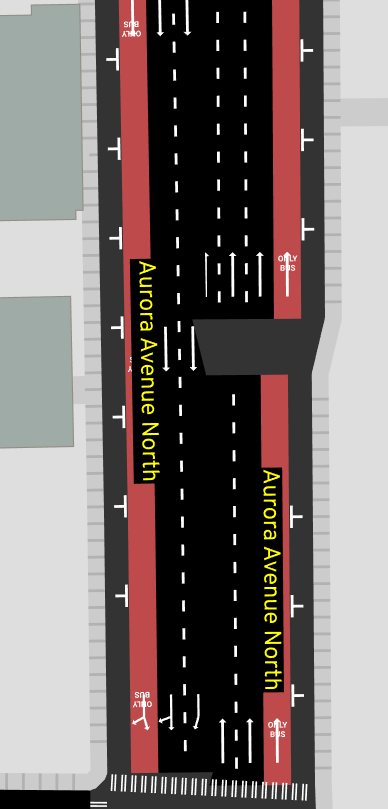
Another example is people tagging the lane count incorrectly. A common problem
when splitting a bidirectional road into two one-ways (which is what you're
supposed to do when there's physical separation like a median) is forgetting to
change the lane count.
Here's a recent example,
where sidewalk=both was copied when a bidirectional road was split into
divided one-ways.
An important lesson when trying to write algorithms using OSM data: there's a balance between making your code robust to problems in the data, and trying to fix everything upstream. I attempt a compromise. It's a virtuous cycle -- in trying to use OSM data in this new way, I wind up fixing the data sometimes.
Highway on/off-ramps
When three nearly parallel roads meet, our algorithm is a bit over-eager with the size of the intersection:
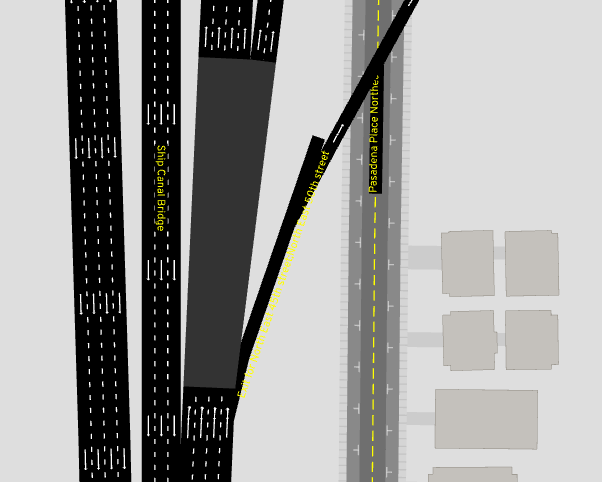
This case isn't even a real "intersection" -- a one-way highway has two different off-ramps jut out. At some point, I had some scribbled diagrams in a notebook somewhere from when I worked on this, but it's lost -- luckily the code for this case is pretty simple. This produces much better results here:
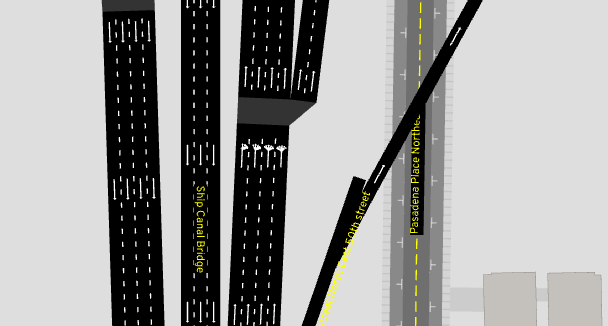
OSM has a placement tag that may also be useful here.
Intersection consolidation
The skeptical reader has noticed the suspicious lack of complex intersections so far. Time to dive into that.
Where short roads conspire
In OSM, roads with opposite directions of traffic separated by any sort of center median -- even if it's just a small raised curb -- are mapped as two parallel one-way roads. These're also called divided highways or dual carriageways. When these intersect, we wind up with lots of short "road segments" and several intersections all clustered together:
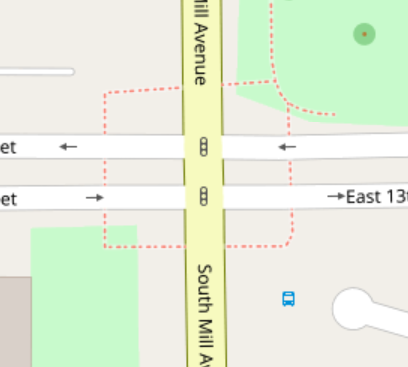
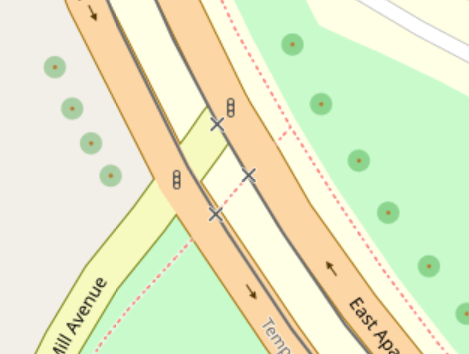
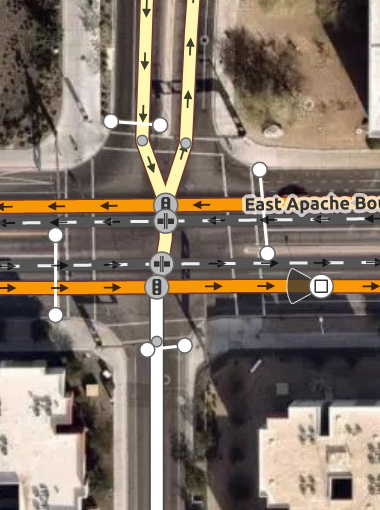
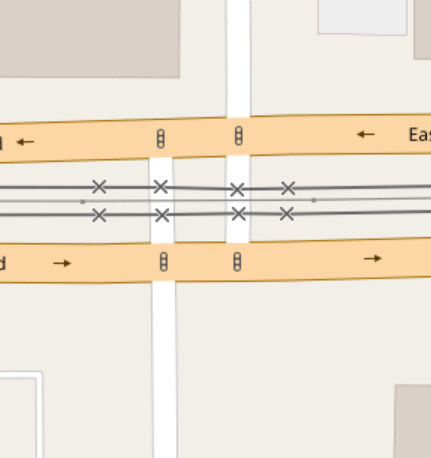
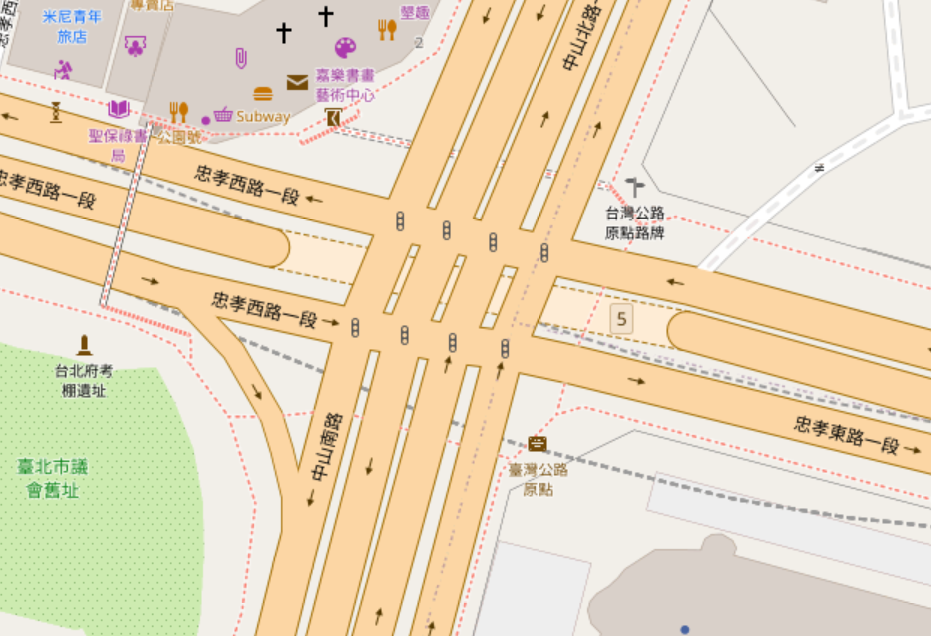
But wait, there's more. How about "dog-leg" intersections, where one road shifts over slightly as it crosses another?
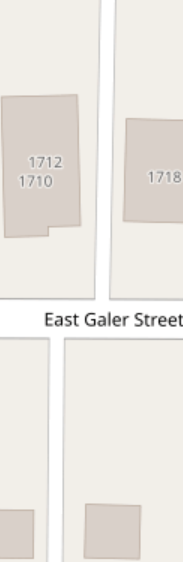
But sometimes something looking like a dog-leg actually isn't -- if vehicles can legitimately stop and queue in the middle of the "intersection", even if it's only one or two of them, then I think that interior "road" deserves to remain separate:
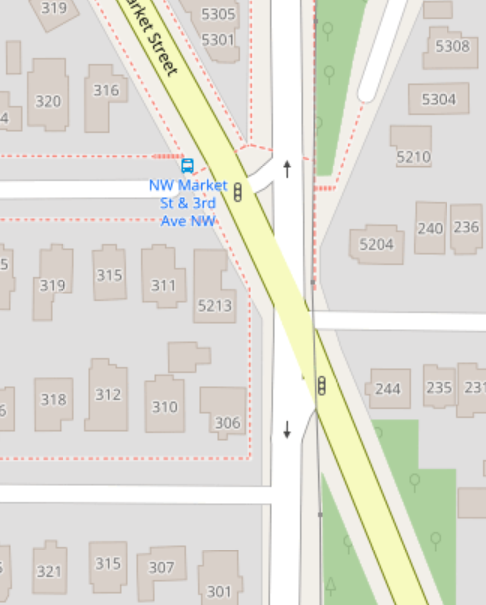
And then there's just the cases where I'm pretty sure civil engineers anticipated me writing this algorithm, and found the most obnoxious angles for roads to meet in order to maximize my pain:
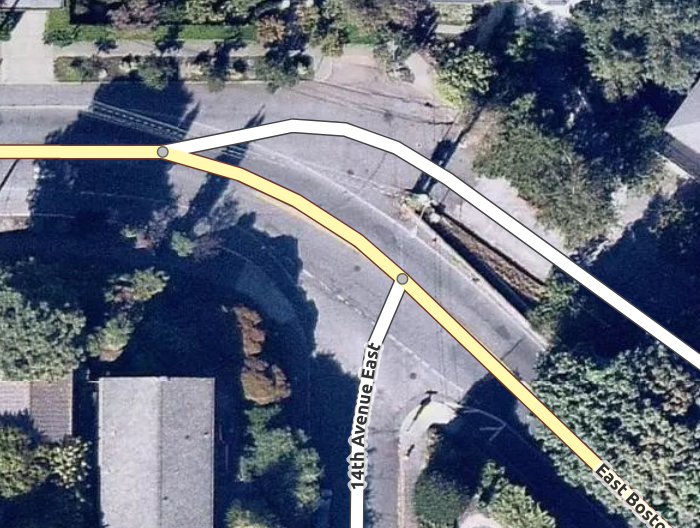
Why we want to do something about it
So hold up, what's the problem? Some areas that people treat as one physical intersection in reality are modelled in OSM as a cluster of intersections, with lots of short "roads" linking them together. It's fine from a graph connectivity and routing perspective. What could go wrong?
Well for starters, with the algorithm described so far that tries to render the physical shape, it's completely visually incomprehensible:
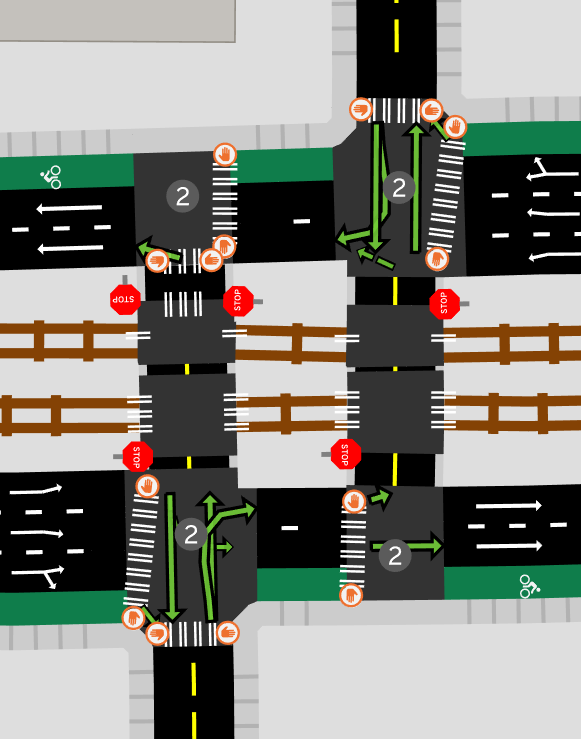
These complicated intersections are often the ones that would be the most interesting to study in A/B Street, but just try modifying lanes in these cases:
Now throw traffic signals into the mix. A/B Street tries to simulate those, so when we have a cluster of two or four of them super close, now we have to somehow try to synchronize their timing. When somebody wants to edit them, now they have to operate on all of them at once! We even extended the UI to handle that, but it's quite a poor editing experience.
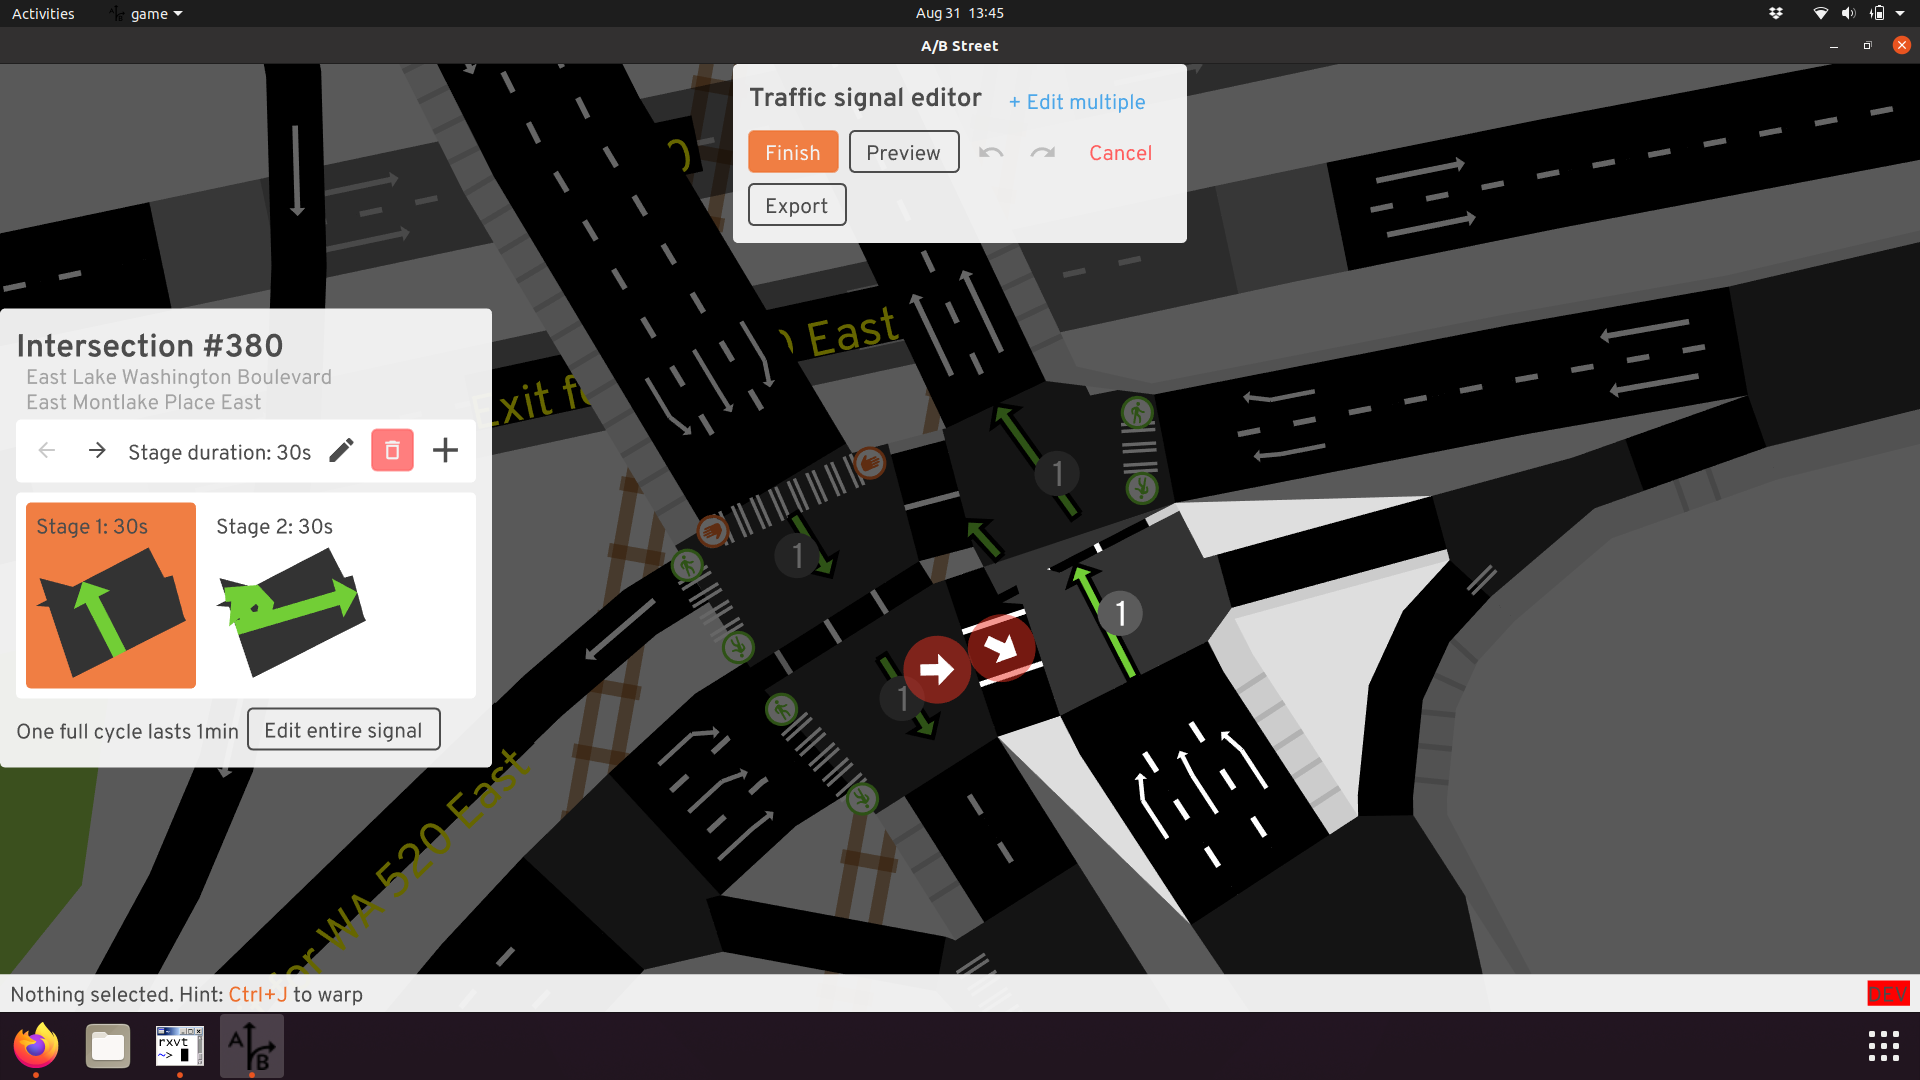
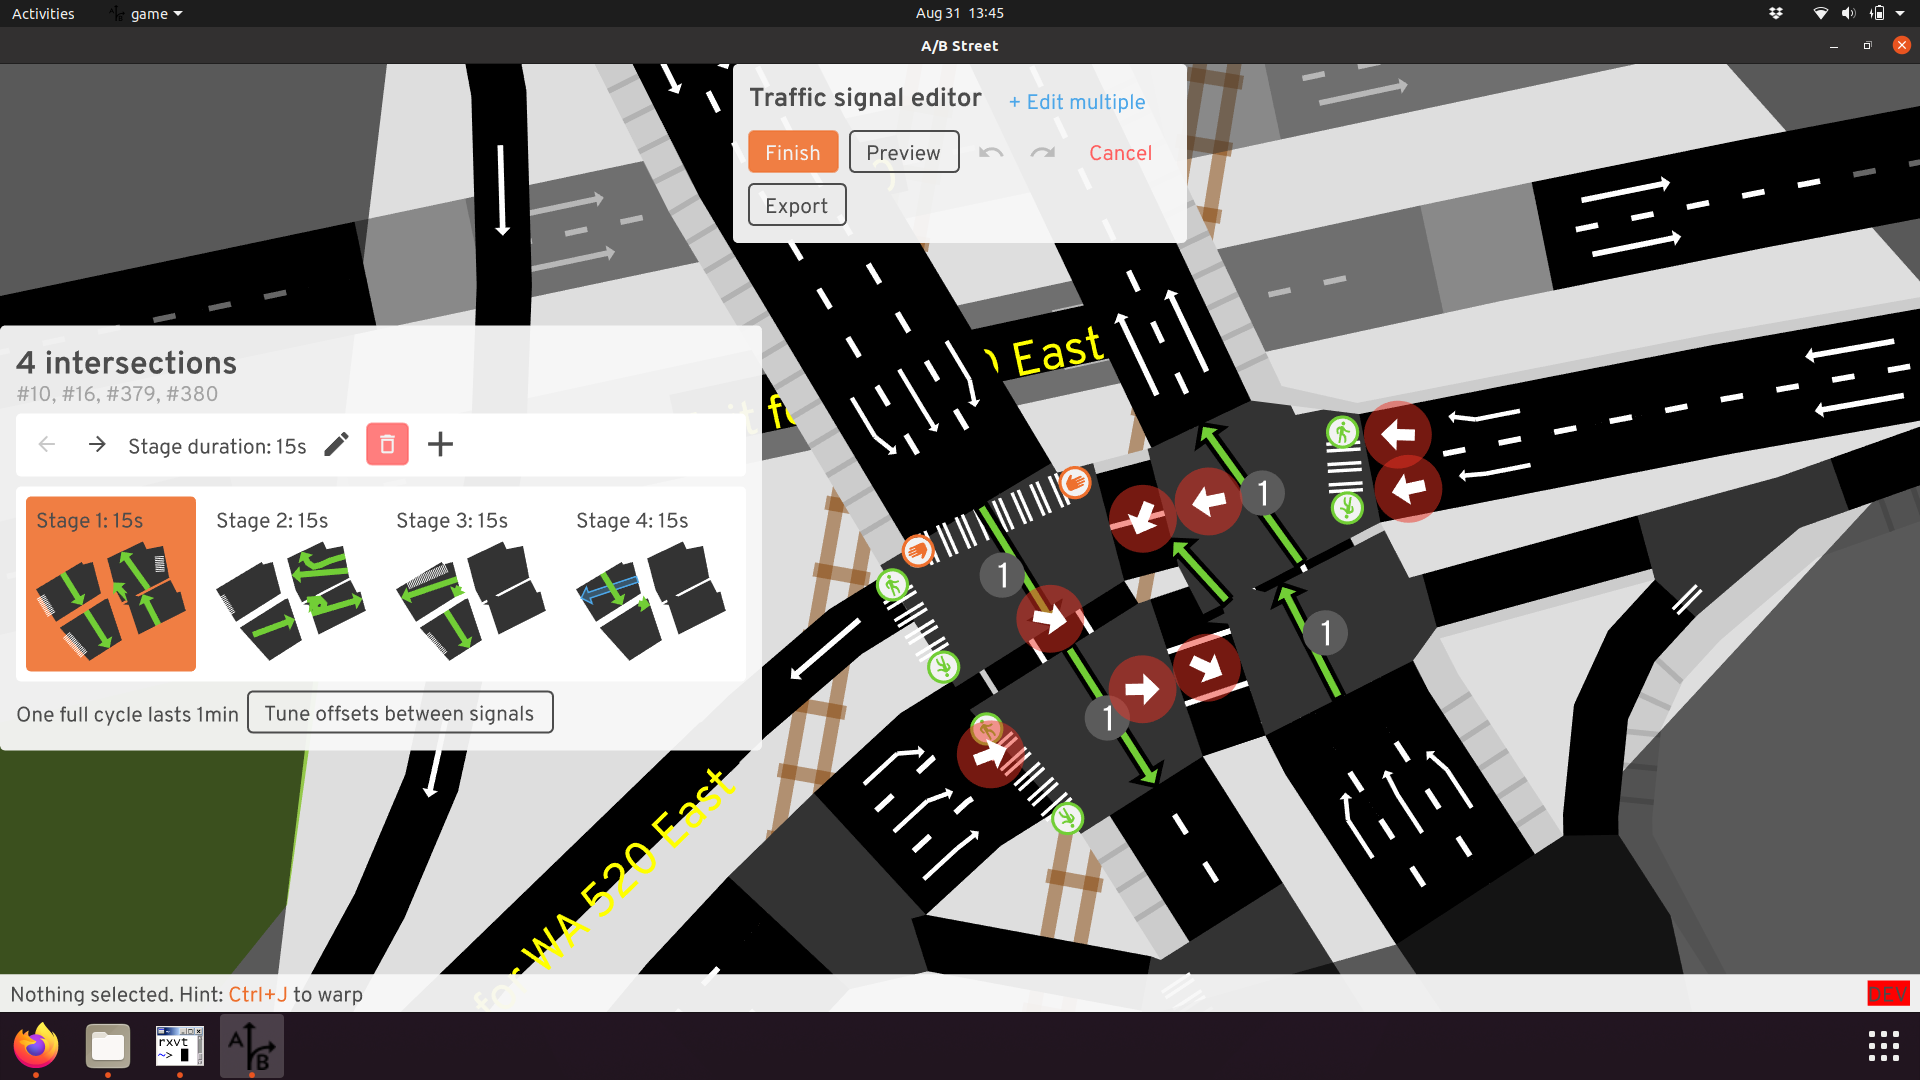
And finally, traffic simulation gets MUCH harder. A/B Street models vehicles as having some length, meaning a vehicle's front can make it through one intersection, but its tail gets stuck there:
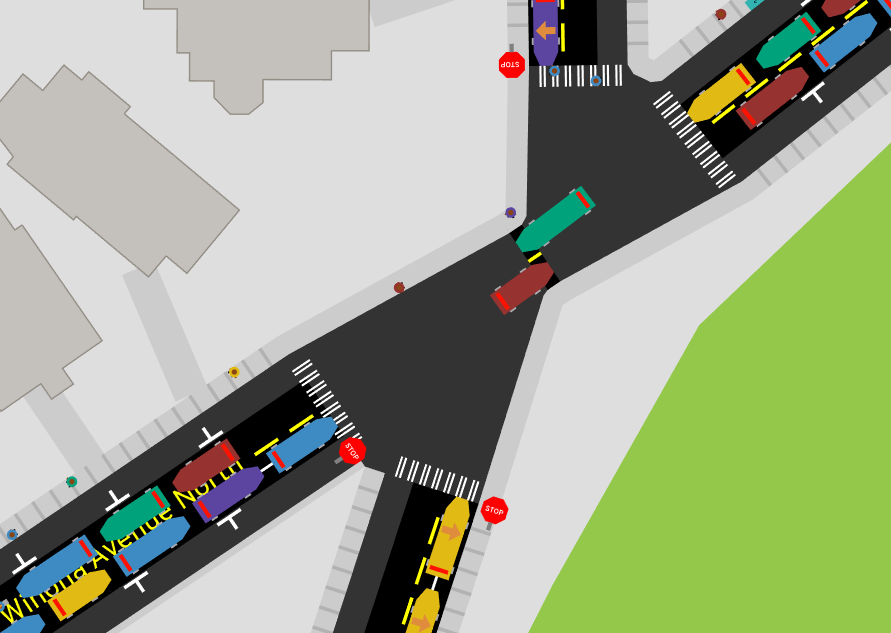
At the simulation layer, vehicles moving through an intersection conflict with each other very coarsely. If a vehicle is partially stuck in the intersection, it prevents other vehicles from starting potentially conflicting turns. So to prevent this problem from happening, the simulation has complicated rules so that vehicles do not "block the box" -- if they enter an intersection, they must be guaranteed to fully exit and clear it, not get stuck somewhere in the middle. These rules blow up in the presence of short roads like this. Lots of effort has gone into workarounds at the simulation layer, but... just fixing the representation in the map model seems much more desirable.
Goal
In reality, many of these clusters of intersections and short roads are actually just one "logical" intersection. If you consider where vehicles stop or where crosswalks are placed, this can make this definition a little bit more clear, but it's somewhat subjective. In A/B Street, we aim to "consolidate" this cluster into just one intersection. Visually coherent geometry, reasoning about a single traffic signal, and preventing vehicles from getting stuck in the cluster are the goals.
Before we dive into the approach to consolidate, let's look at some success stories.
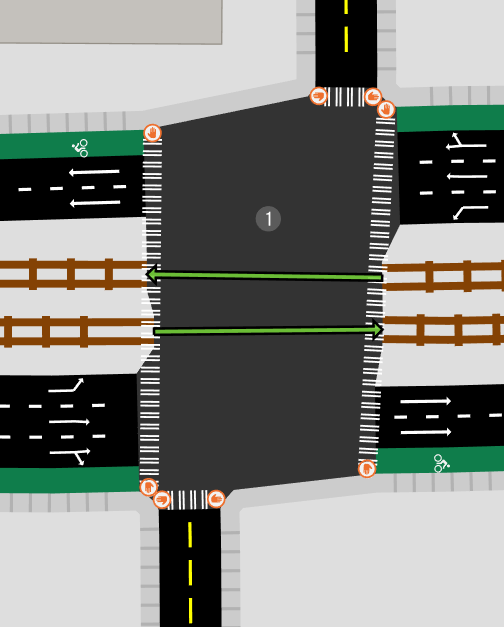
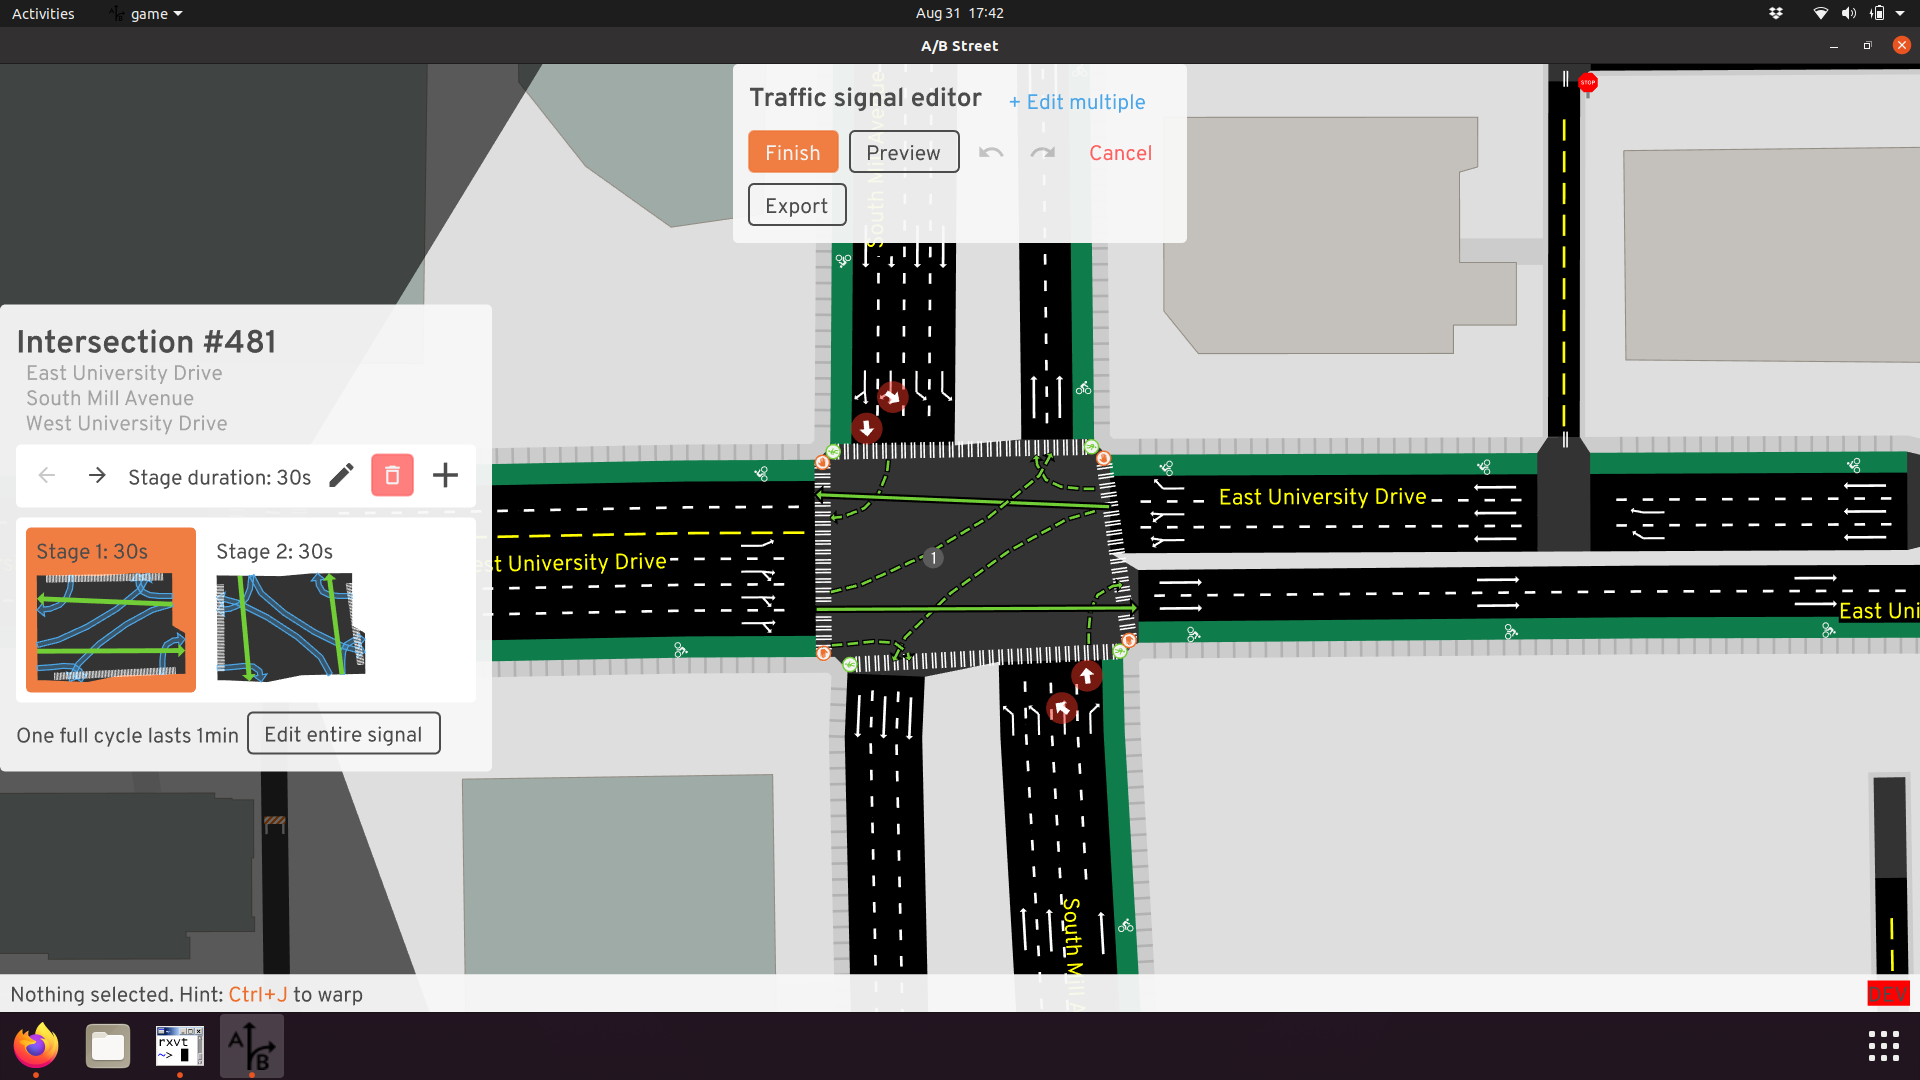
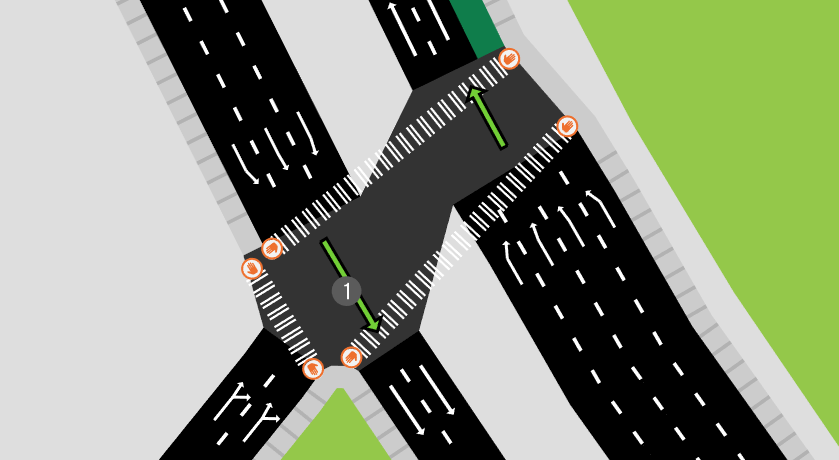
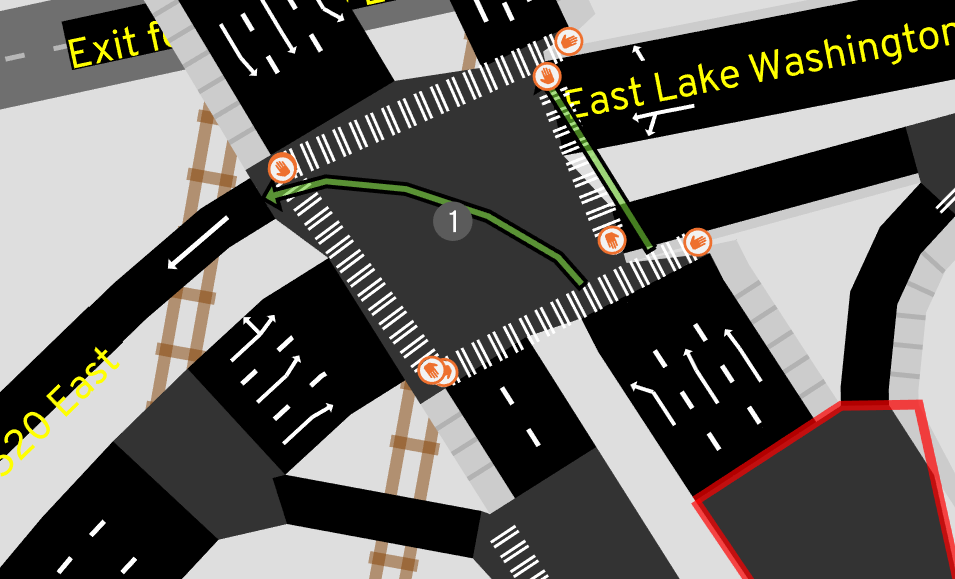
A solution: two passes
For some history getting to this point, check out previous attempts and more before/after examples.
Consolidating a complex intersection happens in a few steps.
- Identify the short roads
- Run the regular algorithm for intersection geometry, and remember how much each road's center line gets trimmed back
- Remove the short road and fix up graph connectivity
- Use the "pre-trimmed" center line to project each surviving road to the left and right
- Assemble those points in order to create the consolidated intersection's polygon
Step 1 and 5 are covered in more detail in below sections.
For step 2, we start with the regular algorithm described so far, applied to each intersection:

Then we delete the short road. The details of how this is done are particular to A/B Street's intermediate representation of a map model. Graph connectivity and all sorts of turn restrictions must be preserved. But geometrically, it just looks like this:
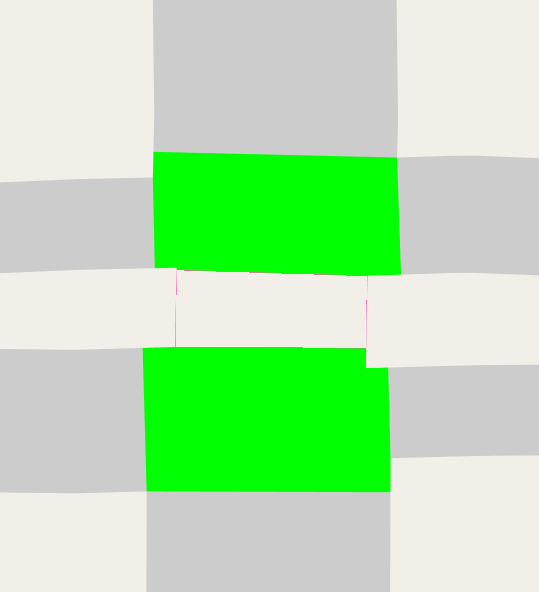
Then we run step 4, finding the left and right side of each surviving road:
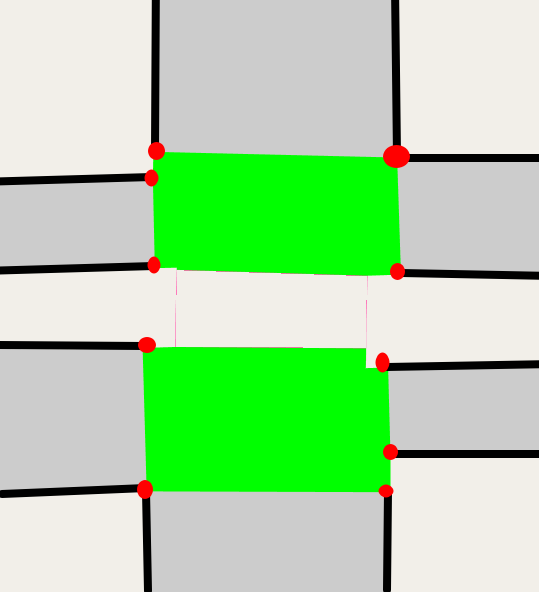
Now if we just use those red dots, we can create the final polygon for this consolidated intersection.
Sorting revisited
To assemble the endpoints into a polygon, we need to know what order they go in. If you recall from an earlier section, we used the original shared point from OSM as the center, and the point farthest away from that shared point to do this:
But now things are less clear -- we have multiple shared points, from before consolidation. As a first pass, maybe we can just average all of the original shared OSM points and call that the "center." And since we've already trimmed back the roads around the complex junction, we can use that point to determine order.
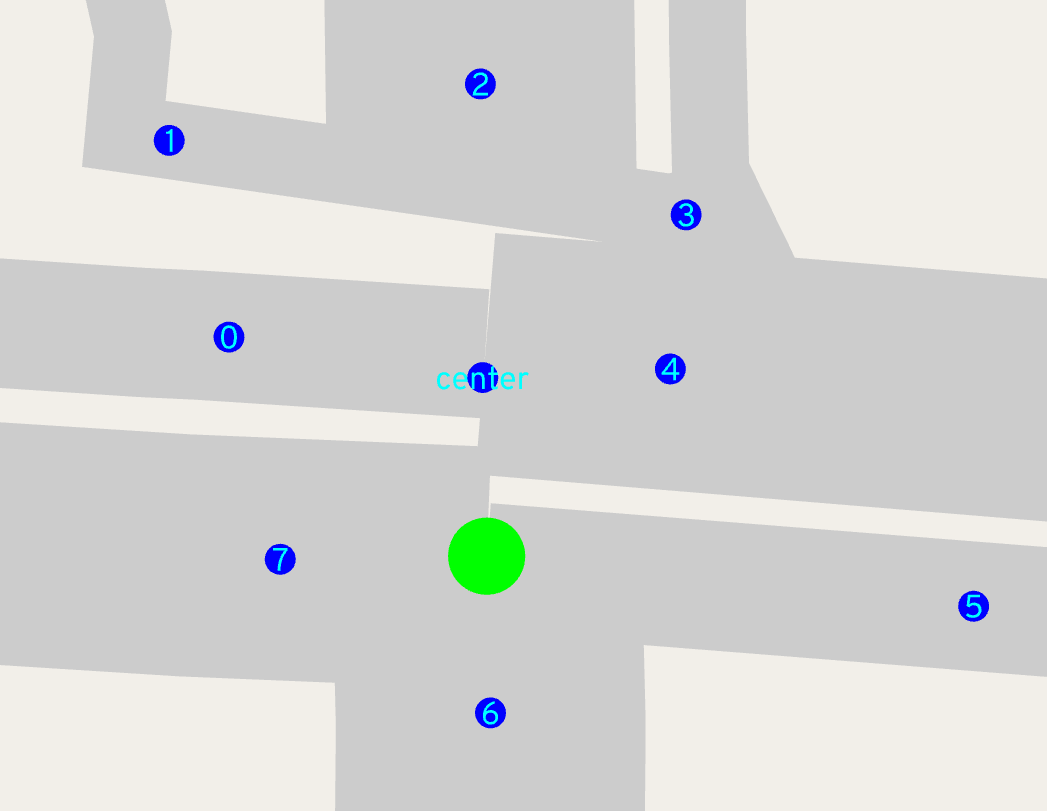
But let's imagine we didn't use that pre-trimmed point, and still used the point farthest from the shared center, like we do for the first pass. Sometimes that can break down!
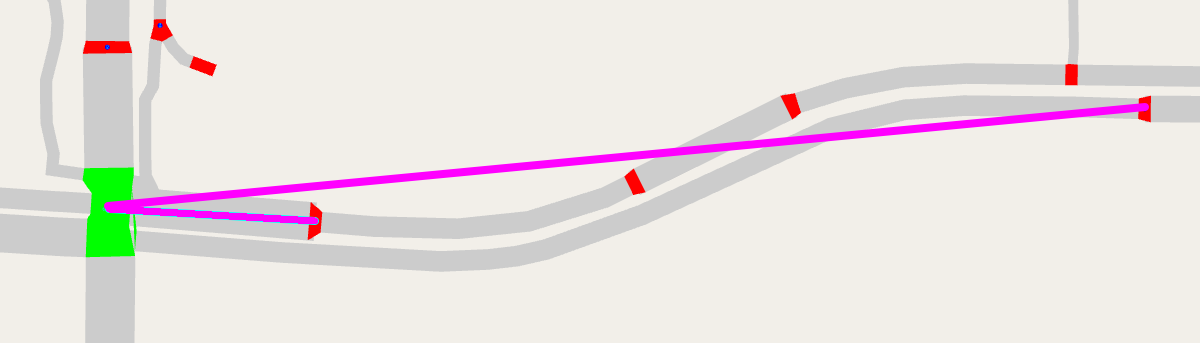
What happens when we get the ordering of roads wrong? The polygon will loop back on itself, looking like a bowtie:
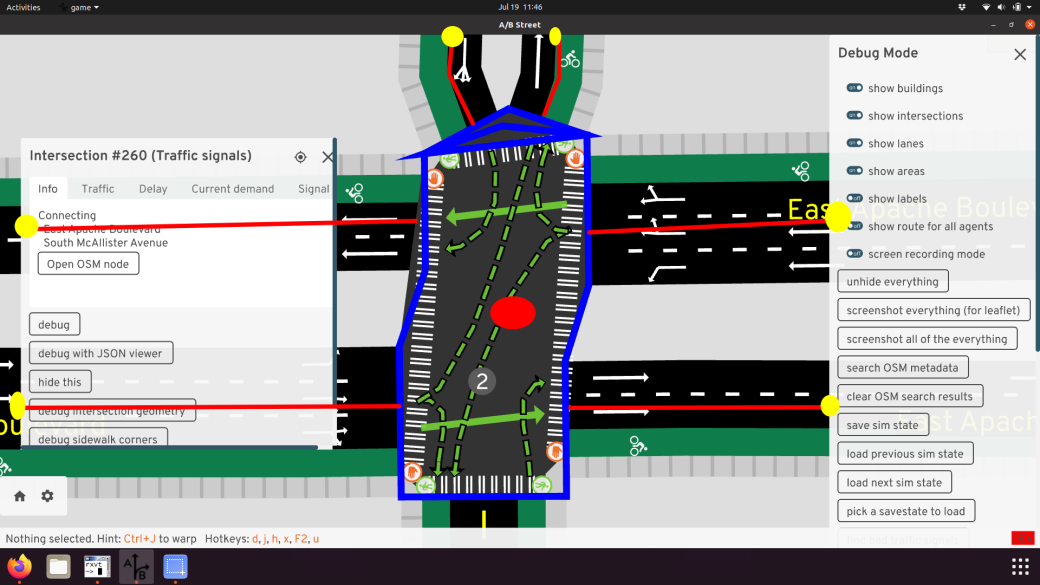
This article has a clever idea to break ties using distance from the center.
Finding the short roads
The algorithm described relies on knowing short roads to merge. Conveniently, there's a proposed OSM tag junction=intersection that describes road segments that're physically located in the interior of intersections. So far, I've been manually tagging this and using it as the trigger to merge a junction. But of course, ideally heuristics would instead discover these cases automatically.
The simplest start is to just define a threshold, like 5 meters, and try to merge any road shorter than that. The road's original length could be used, or -- perhaps more usefully -- we can first generate intersections normally and use the trimmed road length. After merging a short road, perhaps some other ones nearby change their trimmed length, so merging should happen in a fixed-point loop, until no road has changed.
So far, I haven't made good progress with this heuristic. Merging happens in too many places, or in a strange order, and causes assertion failures. Much of the time, this exposes actual bugs, but exposing dozens at a time is hard to handle, so that's why the slower approach of manually opting in a few intersections to merging still remains.
In the spirit of a more gradual rollout of merging code, I've also attempted heuristics just focused on common patterns of complex junctions with 2 or 4 pieces, resulting from one or two divided highways crossing. Sometimes just looking for two or four traffic signal nodes close to each other reveals really complex situations that break:
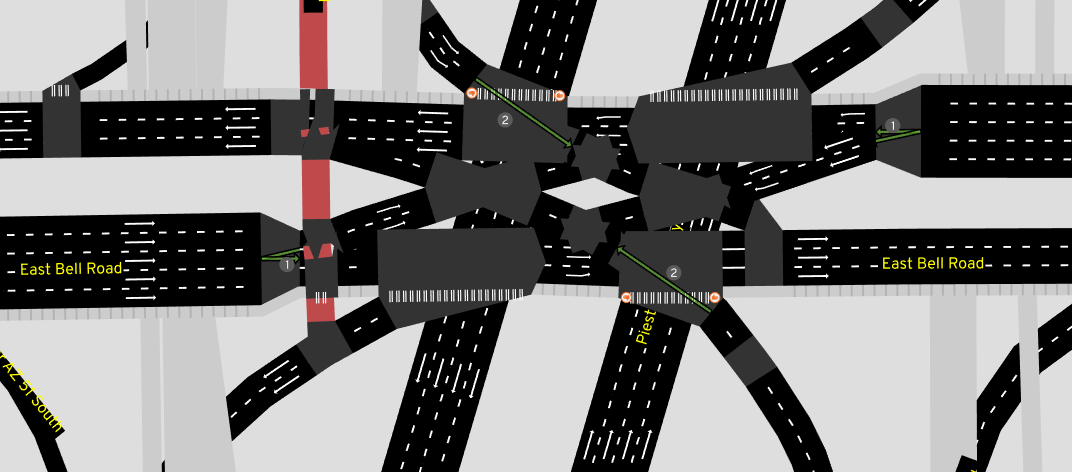
Phantom collisions
There's a particularly insidious edge case not handled yet:
How could we handle this? Is it necessary to consider collisions between roads one or two hops away in the graph, in case they might be thick enough to interfere?
Conclusion
Given how much time I've sunk into automatically generating decent geometry from an OSM schema absolutely not meant for this, I hope you don't fault me for wanting to try some radically different ideas. There've been some OSM proposals over the years to just explicitly draw roads and intersections as areas -- the street area and area:highway pages describe these ideas the best. These proposals don't seem to have caught on, but I think they're worth an attempt.
I've also toyed around with designing a schema to map roads and intersections from scratch, but that's an article to write on a rainier day...
Appendices
Related work
I've found a few other active projects aiming to render details about lanes:
- https://github.com/enzet/map-machine
- http://blog.imagico.de/navigating-the-maze-part-1/ (and don't miss part 2!)
- https://github.com/BjornRasmussen/Lanes (there are some nice demos in the OSMUS Slack somewhere)
- micro-map of Neukölln in Berlin, see this blog for an introduction
Tricks and tooling
Iterating quickly on these algorithms and preventing regressions are often at odds. These are some parts of my development workflow that help balance a bit.
First, how do you automatically test this? Expressing properties about the output -- like no road and intersection polygons should overlap -- would be a start, but it's a tough standard to reach. It's easy for a human to subjectively judge output and spot regressions. So, screenshot diff-testing it is! For a select few maps, I take a bunch of screenshots covering the whole map and store them as "golden-files." After importing new OSM data or changing the code, I take more screenshots, then automatically compare them with imagemagick's compare tool and manually inspect any differences.
The RawMap editor serves as an interactive tool for quickly adjusting the input -- what if this road center-line curved less sharply, what if the width implied by tags was a little different, what if this road was marked for merging? But at the same time, just previewing the intersection geometry doesn't reveal all problems -- sometimes the turns generated at a consolidated intersection are wrong, or the traffic signal heuristic turns out poorly. The full A/B Street UI already has tools to explore these things. So this UI also has a mode to load a second map and quickly flip between the two:
Something I've always wanted is an interactive debugger -- the ability to step through the code, print things, and more importantly, dump some kind of extra output files to visualize intermediate shifted polylines or something. I've never figured out an IDE setup for this, but it'd be very worthwhile.
Hall of Lovecraftian horrors
Here's my list of stress test cases. Avert your eyes...
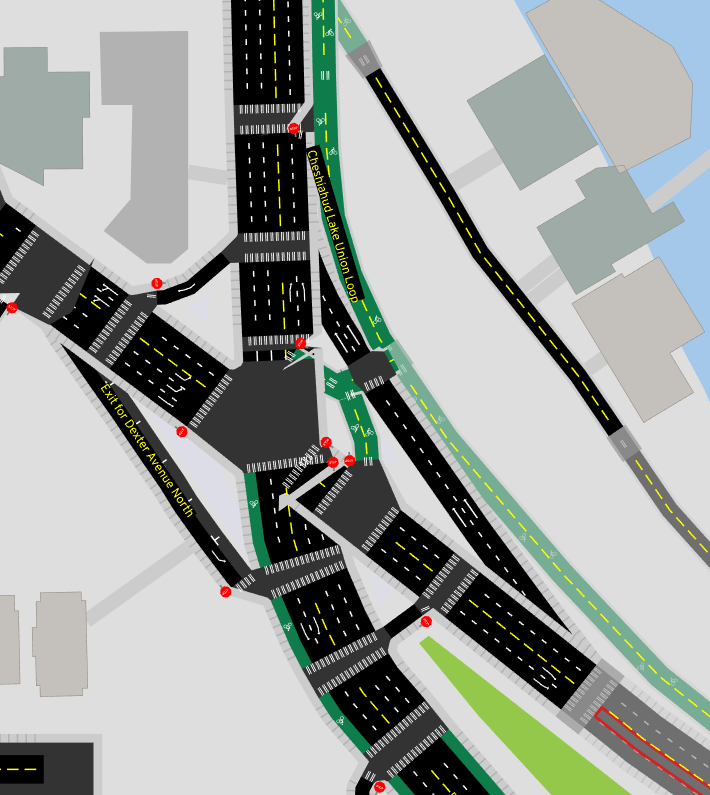
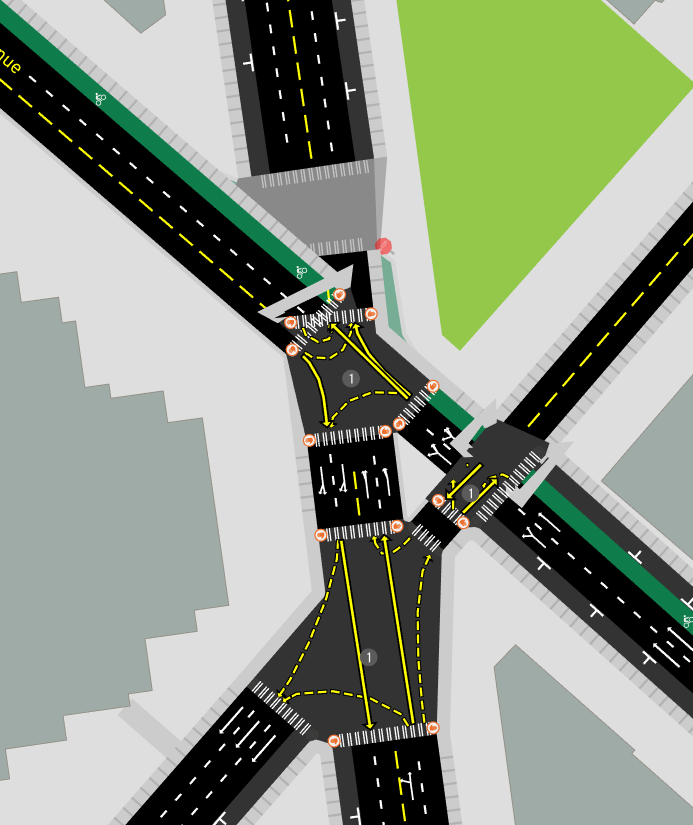
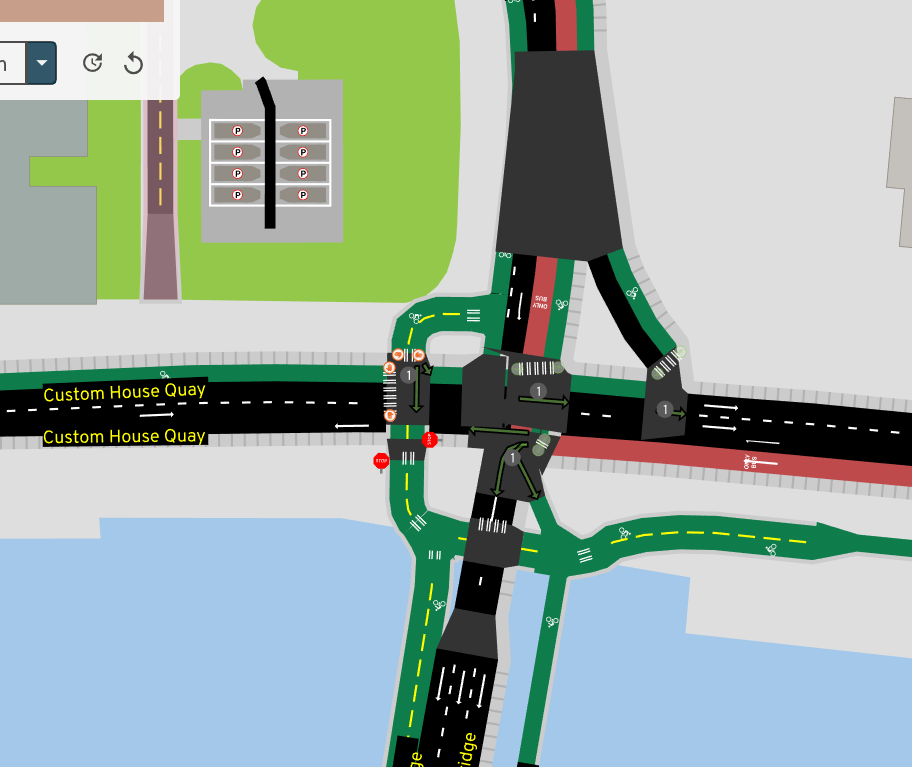
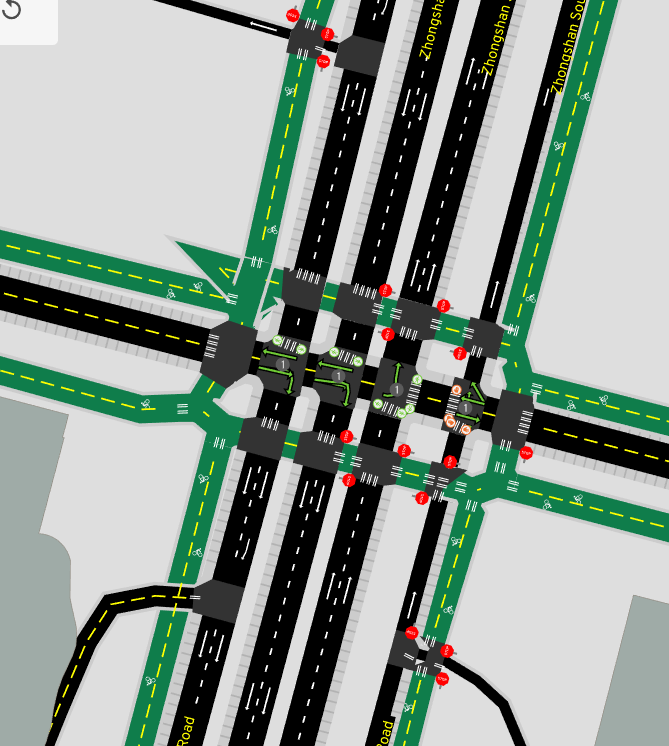
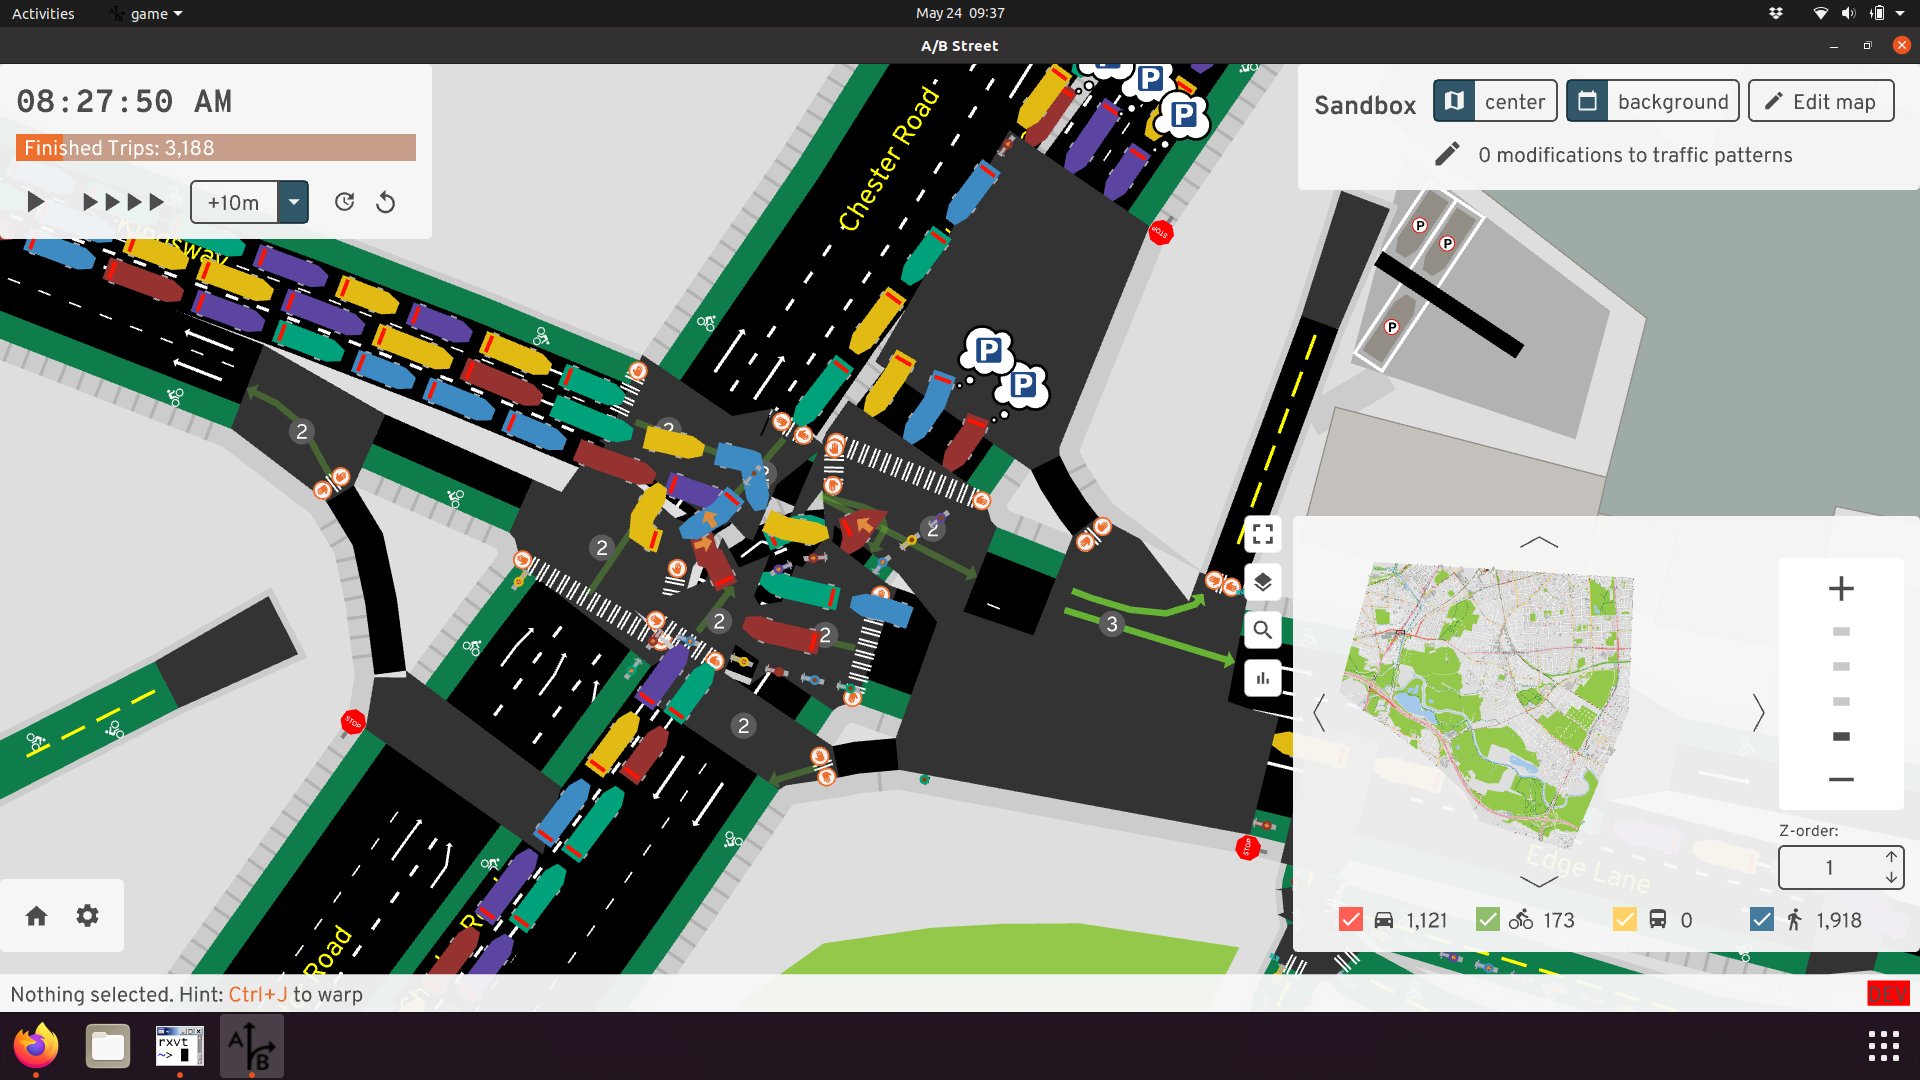
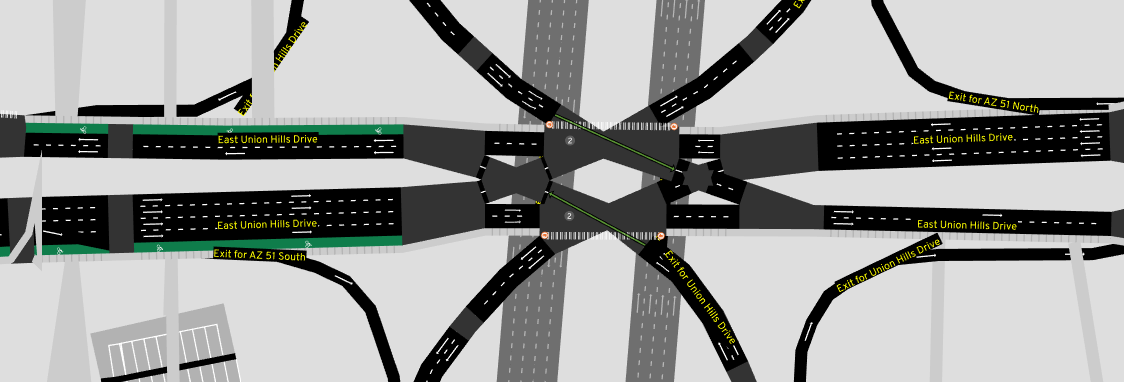
A radically simpler approach?
I think many people's first instinct to solve the problem of forming an intersection polygon from thickened roads is to use boolean operations. Just find the intersection between all of the road polygons. Or maybe, find the intersection between any pair of road polygons, then union all of those pieces.
Early on, I tried some variations of this. One difficulty was a lack of a robust boolean geometry library in Rust, but if bindings to a native GEOS library were acceptable, maybe this was possible. But also, this simple idea doesn't work for three-way intersections:
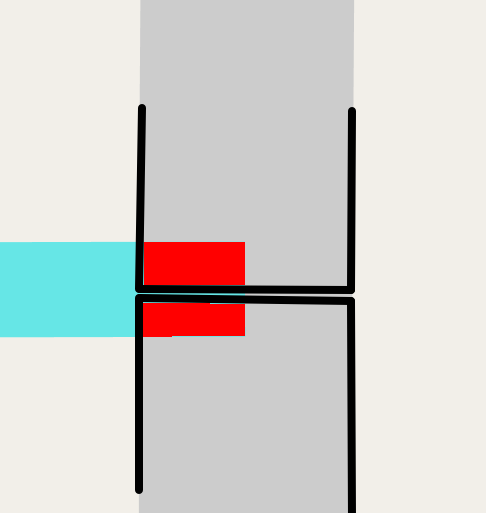
The two vertical road pieces don't even intersect at all, except right at their boundary. We'd need to special-case that, at least.
Other data sources
I've come across a few cities that seem to have a vector dataset describing road polygons or curbs. I haven't tried working with any of these before, but it would be a useful exercise to start with one of these as the base, and snap OSM road segments to this to get metadata about lanes and connectivity, but not geometry.
- Seattle Streets Illustrated
includes some kind of CAD basemap that looks amazingly realistic
- From some old emails with King County GIS, this is based on an impervious surface layer with a license preventing it from being released as public data
- Actually, https://data.seattle.gov/dataset/Pavement-Edge-zip/gy82-cq84 appears to be the curbs for Seattle! Possibly the data is from 1999, updated maybe in 2011.
- https://distanciamiento.inspide.com appears to have detailed sidewalk polygons for Madrid
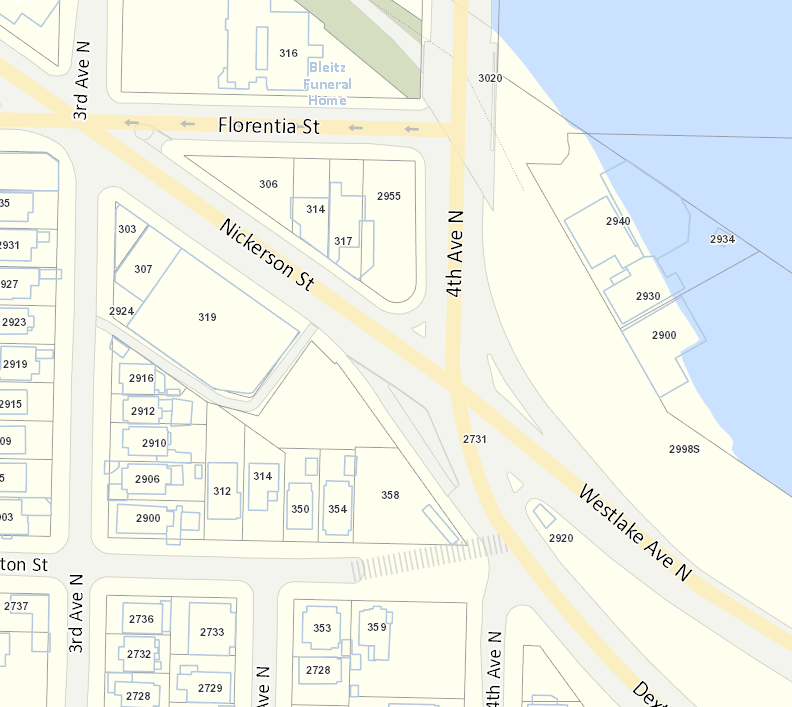
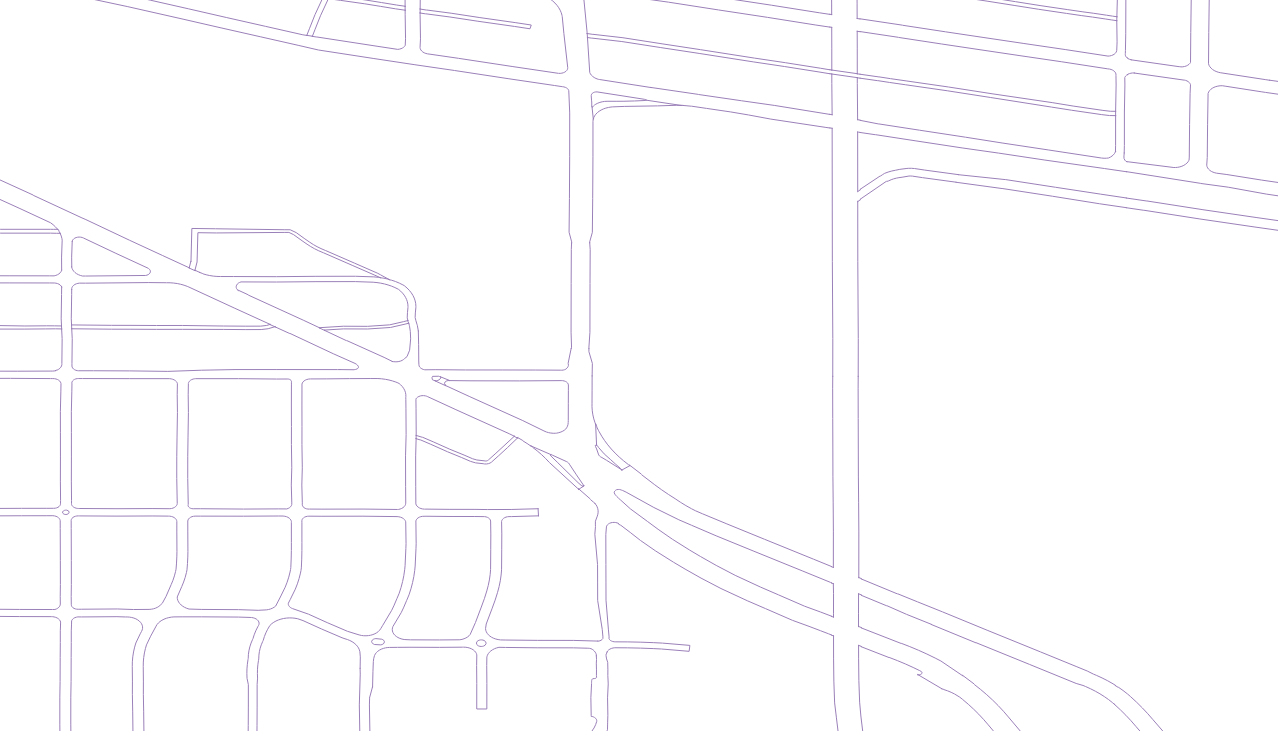
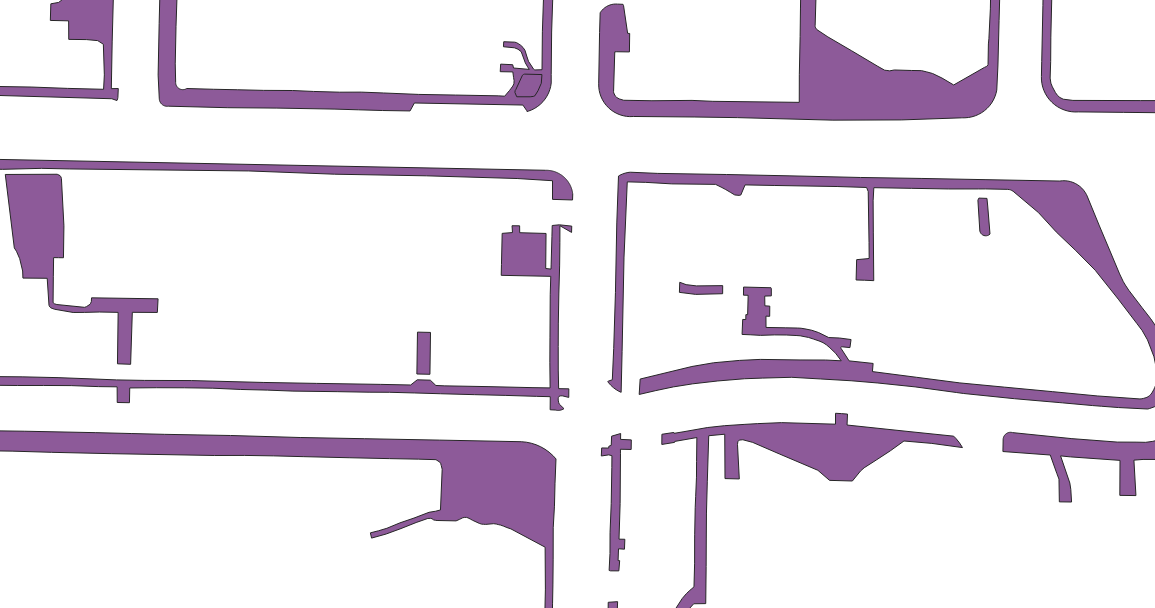
These vector datasets feel like some sort of holy grail, but all of the work described in this article is still useful, because:
- Not every city has this kind of public data
- If road edits need to legitimately widen or shrink a road, it's not obvious how to modify these curbs. But then again, just rechannelizing lanes, subject to the area that's already been paved, is kind of the main type of edit in A/B Street...
Map model details
A/B Street builds a rich representation of a city map using OpenStreetMap (OSM) and other sources. This chapter describes how.
TODO: Integrate pictures from these slides.
This recorded presentation covers some of this.
The map
A single city is broken down into different pieces...
A/B Street comes with a few maps, each defined by a bounding/clipping polygon for some portion of Seattle. Each map has these objects:
- Roads: A single road connects two intersections, carrying OSM metadata and containing some child lanes.
- Lanes: An individual lane of traffic. Driving (any vehicle), bus-only, and bike-only lanes have a direction. On-street parking lanes don't allow any movement, and they have some number of parking spots. Sidewalks are bidirectional.
- Intersections: An intersection has references to all of the incoming and
outgoing lanes. Most intersections have a stop sign or traffic signal policy
controlling movement through it.
- Border intersections on the edge of the map are special places where agents may appear or disappear.
- Turns: A turn connects one lane to another, via some intersection. (Sidewalks are bidirectional, so specifying the intersection is necessary to distinguish crosswalks at each end of a sidewalk.)
- Buildings: A building has a position, OSM metadata, and a front path connecting the edge of the building to the nearest sidewalk. Most trips in A/B Street begin and end at buildings. Some buildings also contain a number of off-street parking spots.
- Area: An area has geometry and OSM metadata and represents a body of water, forest, park, etc. They're just used for drawing.
- Bus stop: A bus stop is placed some distance along a sidewalk, with a pointer to the position on the adjacent driving or bus lane where a bus stops for pick-up.
- Bus route: A bus route has a name and a list of stops that buses will cycle between. In the future, they'll include information about the frequency/schedule of the route.
- Parking lot: A parking lot is connected to a road, has a shape, and has some internal driving "aisles." The number and position of individual parking spots is auto-generated.
Coordinate system
A/B Street converts (longitude, latitude) coordinates into a simpler form.
- An (x, y) point starts with the top-left of the bounding polygon as the origin. Note this is screen drawing order, not a Cartesian plane (with Y increasing upwards) -- so angle calculations account for this.
- The (x, y) values are f64's trimmed to a few decimal places, with way more
precision than is really needed. These might become actual fixed-point
integers later, but for now, a
Pt2Dskirts around Rust's limits on f64's by guaranteeing no NaN's or infinities and thus providing the fullEqtrait. - A few places in map conversion compare points using different thresholds, usually below 1 meter. Ideally these epsilon comparisons could be eliminated in favor of a fixed-point integer representation, but for now, explicit thresholds are useful.
Invariants
Ideally, the finalized maps would satisfy a list of invariants, simplifying the traffic simulation and drawing code built on top. But the input data is quite messy and for now, most of these aren't quite guaranteed to be true.
- Some minimum length for lanes and turns. Very small lanes can't be drawn, tend to break intersection polygons, and may lead to gridlocked traffic.
- Some guarantees that positions along adjacent lanes actually match up, even
though different lanes on the same road may have different lengths. Examples
include the position of a bus stop on the sidewalk and bus lane matching up.
- Additionally, parking lanes without an adjacent driving lane or bus stops without any driving or bus lanes make no sense and should never occur.
- Connectivity -- any sidewalk should be reachable from any other, and most driving lanes should be accessible from any others. There are exceptions due to border intersections -- if a car spawns on a highway along the border of the map, it may be forced to disappear on the opposite border of the map, if the highway happens to not have any exits within the map boundary.
Connectivity
For a single mode, each lane is connected to two intersections. Turns connect two lanes. There are no turns between sidewalks and driving/bike/bus lanes.
All buildings and parking lots have driveways. This must connect to a sidewalk, allowing pedestrians to enter/exit that object. The driveway OPTIONALLY connects to the nearest driveable lane. This allows cars to enter/exit that object for parking.
Public transit stops are located somewhere on a sidewalk. They're associated with a driveable position where the bus or train stops. In the future, this will need to account for dedicated surface-level platforms and for underground transit stations, likely associated with a building.
There's a concept of "parking blackholes." If you treat every road as bidirectional without access restrictions, then the graph is connected. But the more detailed view has to factor in one-way roads and things near the map border. These blackholes influence where cars will try to look for parking (since we don't want them entering a blackhole and getting stuck) and also, for temporary/unintentional reasons, where pedestrian<->bicycle transitions will happen.
Importing
This chapter describes the process of transforming OSM extracts into A/B Street's map model. These are implementation details; you may be looking for the user guide to importing a new city.
The steps are:
- A large .osm file is clipped to a hand-drawn boundary region, using
osmium - The
convert_osmcrate reads the clipped.osm, and a bunch of optional supplementary files, and produces aRawMap - Part of the
map_modelcrate transforms theRawMapinto the finalMap - Other applications read and use the
Mapfile
The importer crate orchestrates these steps, along with automatically
downloading any missing input data.
The rest of these sections describe each step in a bit more detail. Keeping the docs up-to-date is hard; the best reference is the code, which is hopefully organized clearly.
Don't be afraid of how complicated this pipeline seems -- each step is relatively simple. If it helps, imagine how this started -- just chop up OSM ways into road segments, infer lanes for each road, and infer turns between the lanes.
From OSM to RawMap (convert_osm crate)
The first phase of map building reads in data from OSM files and a few others,
producing a serialized RawMap.
Only major steps are described; see the code for the rest.
extract.rs
Read .osm, extracting the points for road-like ways, buildings, and areas
- Areas usually come from a relation of multiple ways, with the points out of order. Gluing all the points together fails when the .osm has some ways clipped out. In that case, try to trace along the map boundary if the partial area intersects the boundary in a clear way. Otherwise, just use a straight line to try to close off the polygon.
- Also read traffic signal locations and turn restrictions between OSM ways
split_ways.rs
Split OSM ways into road segments
- OSM ways cross many intersections, so treat points with multiple ways and the points at the beginning and end of a way as intersections, then split the way into road segments between two intersections.
- This phase remembers which road segment is the beginning and end of the OSM way, for per-lane turn restrictions later
- Apply turn restrictions between roads here. Since OSM ways cross many intersections, the turn restrictions only apply to one particular road segment that gets created from the way. Make sure the destination of the restriction is actually incident to a particular source road.
clip
Clip the map to the boundary polygon
osmiumoptions preserve ways that cross the boundary- Trim roads that cross the boundary. There may be cases where a road dips out of bounds, then immediately comes back in. Disconnecting it isn't ideal, but it's better to manually tune the boundary polygon when this happens than try to preserve lots of out-of-bounds geometry.
- Area polygons are intersected with the boundary polygon using the
clippingcrate
Road/intersection geometry: RawMap to InitialMap
The remainder of map construction is done in the map_model crate. There's one
intermediate structure between RawMap and Map, called InitialMap.
make/remove_disconnected.rs: Remove disconnected roads- Just floodfill from some road, assuming all roads are bidirectional, to get different partitions.
- Remove roads from all but the largest partition
make/initial/mod.rsandmake/initial/lane_specs.rs: Interpret OSM tags to figure out what lanes are on each side of each road, also figuring out the total width of the road.make/initial/geometry.rs: Figure out the polygon for each intersection, and trim back road center-lines to end at a face of the polygon.- For every road touching the intersection, get the polyline of each side,
based on the road's width
- See appendix for how to shift polylines
- Sort all the polylines by the angle to the intersection's shared point
- Intersect every polyline with every other polyline
- More specifically -- the second half of each polyline, to get the correct collision point
- Look at the perpendicular infinite line to the collision point on the shifted polyline, then find where it hits the original center line. Trim back the center line by the max distance from these collisions.
- Compute the intersection's polygon by considering collisions between adjacent roads' polylines
- Deal with short roads and floating point issues by deduping any adjacent points closer than 0.1m
- For every road touching the intersection, get the polyline of each side,
based on the road's width
InitialMap to Map
Still in the map_model crate.
map.rs'smake_half_map: Expand roads to lanes, using the list of lane types from beforemake/turns.rs: Generate turns for every intersection.- Vehicle turns (for cars, bikes, buses)
- Consider every pair of roads in the intersection. Try to match up lane types -- if there's a bike lane on both roads, don't add a turn from driving->bike or bike->driving. If there's not, then fallback to transitions between different lane types.
- Classify the turn based on the difference between the angle of the
incoming lane's last line and the outgoing lane's first line
- For straight turns, use the Cartesian product to link every incoming
with every outgoing lane. If the indices dont match up, the turn becomes
a
LaneChangeLeftorLaneChangeRightturn. This is used later for intersection policies to prioritize turns appropriately. - Right and left turns only originate from the one lane on the appropriate side
- For straight turns, use the Cartesian product to link every incoming
with every outgoing lane. If the indices dont match up, the turn becomes
a
- Walking turns for pedestrians
- Consider pairs of adjacent roads around the intersection
- Make a crosswalk to the other side of the road, assuming there's a sidewalk on both sides
- Make a shared sidewalk corner over to the adjacent road
- If the adjacent road doesn't have a sidewalk on the close side, then consider skipping that road and making a crosswalk over to the next road. An example of this is a crosswalk over a highway on/off ramp.
- Consider pairs of adjacent roads around the intersection
- Verify all the turns so far are unique
- Filter by the OSM turn restrictions ("only straight" between road1 and road2)
- Try to apply the OSM per-lane restrictions ("straight or left" from lane 3)
- The number of lanes in the OSM metadata might not match up with how many lanes created
- Some of these OSM tags are just completely wrong sometimes. If the filter makes an incoming lane lose all of its turns, then ignore that tag.
- Vehicle turns (for cars, bikes, buses)
make/parking_blackholes.rs: Find well-connected roads near "blackhole" lanes.- Starting from most driving/biking lanes, most other lanes are reachable. Some aren't -- such as one-way highways inevitably leading from or to a border. These are "blackholes" -- pathfinding to or from here may fail.
- Find the largest strongly-connected component (SCC) in the driving graph. From every other lane (a blackhole), floodfill both forwards and backwards to find the nearest driving lane part of the main SCC.
- Later, if a car needs to park by a building on a blackhole road, it'll instead start searching for parking at the redirect. This prevents it from being forced to instead exit the map through a border.
make/buildings.rs: Match buildings up with sidewalks- Find the closest sidewalk polyline to each building's center. Then draw a straight line for the front path between the edge of the building and the sidewalk point.
- Filter out buildings too far away from any sidewalk
- The front path might cross through other buildings; this is probably not worth fixing.
make/buildings.rs: Same for parking lots- Similar process to match parking lots to nearest sidewalk and driving lane
- Try to place parking spots along both sides of parking aisles
- Filter out overlapping spots
make/bridges.rs: Find what roads lie beneath bridges, and update their Z-order accordingly for later drawing.stop_signs.rs: Instantiate default stop sign policies- Rank incoming roads by OSM priority (arterial beats residential)
- If there's only one rank, then make an all-way stop
- Otherwise, the highest rank gets priority and others stop
- Check if there are any conflicts based on this. If so, then fall-back to an all way stop.
traffic_signals.rs: Instantiate default traffic signal policies- Apply the first predefined policy that works.
- 4-way 4 stage, 4-way 2 stage, 3-way 3-stage, degenerate policy for 2 roads, 2-stage for 4 one-ways
- Fallback to a greedy assignment that just randomly starts a new stage, adds all compatible turns, and repeats until all turns are present priority in some stage.
- Apply the first predefined policy that works.
pathfind/mod.rs: Prepare pathfinding- A/B Street uses contraction hierarchies (CH) for fast routing, using the
fast_pathscrate. pathfind/vehicle.rs: For cars, bikes, buses- There's a separate CH for cars, buses, and bikes, since they can use slightly different sets of lanes.
- Building the CH for buses and bikes is much faster than the one for cars, because the algorithm can re-use the node ordering from the first CH.
- Every lane is a node in the graph, even if it's not an appropriate lane type -- it might change later, and reusing orderings is vital for speed.
- If two lanes are connected by a turn, then there's an edge in the graph.
- The edge weight is the length of the lane and turn. Later this could take into account speed limit, penalize lane-changing and left turns, etc.
pathfind/walking.rs: For pedestrians- Only sidewalk lanes are nodes in the graph -- sidewalks can't ever be changed in A/B Street, so there's no concern about reusing node orderings.
- All turns between two sidewalks become edges, again using length
- When actually pathfinding, we get back a list of sidewalks. The actual paths used in the traffic simulation specify forwards or backwards on a sidewalk. Looking at adjacent pairs of sidewalks lets us easily stitch together exact directions.
- A/B Street uses contraction hierarchies (CH) for fast routing, using the
make/bus_stops.rs: Match bus stops with a sidewalk- Also precompute the position where the bus stops on the adjacent driving or bus lane.
- This "equivalent position on another lane" process has a few weird cases, since two lanes on the same road might have different lengths. Right now, the same distance from the start of the lane is used, with clamping for shorter lanes. Ideally, the position would be found by projecting a perpendicular line out from one lane to the other.
make/bus_stops.rs: Finalize the list of bus routes- Between each pair of adjacent bus stops, run pathfinding to verify there's actually a path for the bus to follow. If any are disconnected, remove the bus route
- Remove bus stops that have no routes serving them.
pathfind/walking.rs: Precompute the CH for pedestrians who will use buses- Nodes in the graph are sidewalks and every bus stop
- There's an edge with weight 0 between a bus stop and its sidewalk
- There's also an edge with weight 0 between bus stops that're adjacent via some route. Ideally this weight would account for the time until the next bus and the time spent on the bus, etc.
- Later when figuring out which bus to use for a pedestrian, the resulting list of nodes is scanned for the first and last bus stop along the same route.
Development tricks
- Separate phases for fast incremental development
- Don't reimport all data from OSM every time there's a change to part of the map construction code!
- For slow steps that don't change often, make them separate binaries -- hence
convert_osmbeing separate from the rest.
- Don't be afraid of manual intervention
- The data isn't perfect. It's easy to spend lots of time fiddling with code to automatically handle all problems
- Instead of automatically resolving problems, prefer good tooling for finding and specifying fixes
- Be careful of derivative structures that could get out of sync with OSM. Prefer contributing real fixes to OSM.
- Screenshot diff testing
- When working on the code for intersection geometry, it's easy to check a few example cases get fixed by some change. But what if another part of the map regresses somehow?
- Take screenshots of the entire map, keep the checksums under version control, look at the diffs visually, and manually verify any changes.
- Implementation details: One huge gif or png is too slow to read and write,
so take a bunch of tiled screenshots covering everything. Amusingly,
rendering to a file with
gliumis slow unless compiling in release mode (which isn't an option for quick incremental development). So instead, pan to each section of the map, render it, call an external screenshot utility, and move on -- just don't wiggle the mouse during this process!
- Different IDs for objects make sense during different phases
- For the final product, lanes and such are just a contiguous array, indexed by numeric IDs.
- But sometimes, we need IDs that're the same between different boundary polygons of maps, so that player edits can be applied anywhere. Using (longitude, latitude) pairs hits floating-point serialization and comparison issues, so referring to roads as (OSM way ID, OSM node ID 1, OSM node ID 2) works instead.
Appendix: PolyLines
Add some pictures here to demonstrate how polyline shifting works, the explode-to-infinity problem, and the bevel/miter fix.
Live edits
A key feature of A/B Street is the player editing the map and seeing how traffic responds. The possible edits include:
- Change lane types (driving, bus, bike, parking -- sidewalks are fixed)
- Change speed limits
- Reverse a lane
- Change a stop sign policy (which roads have a stop sign and which have priority)
- Change a traffic signal policy
The map conversion process outlined above takes a few minutes, so reusing this process directly to compute a map with edits wouldn't work at all for real gameplay. Instead, the process for applying edits is incremental:
- Figure out the actual diff between edits and the current map
- This is necessary for correctness, but also speeds up a sequence of edits made in the UI -- only one or two lanes or intersections actually changes each time. Of course when loading some saved edits, lots of things might change.
- For any changed roads, make sure any bus stop on it have a good pointer to their equivalent driving position for the bus.
- For any modified intersections, recompute turns and the default intersection policies
- Recompute all the CHs for cars, buses, and bikes -- note sidewalks and bus
stops never change
- This is the slowest step. Critically, the
fast_pathscrate lets a previous node ordering be reused. If just a few edge weights change, then recomputing is much faster than starting from scratch. - While making edits in the UI, we don't actually need to recompute the CH after every little tweak. When the player exits edit mode, only then do we recompute everything.
- This is the slowest step. Critically, the
A list of lanes and intersections actually modified is then returned to the drawing layer, which uploads new geometry to the GPU accordingly.
A/B Street's map model as a platform
A/B Street's representation of a city, built mostly from OSM and lots of heuristics, is likely useful to other projects. This doc brainstorms what it would look like to properly expose it to other users.
To sum up what the map model provides: geometry + semantics.
Use cases
- Different UIs (particularly 3D / VR) for exploring cities as they are or as they could be, like Streetmix 3D and Complete Street Rule
- Importing slices of a city as assets into a game engine like Godot
- Imagine a hackathon where people easily build games based on the real world
- Like https://developers.google.com/maps/documentation/gaming/overview_musk but open
- A new OSM viewer/editor, particularly focused on POIs
- Something focusing on 15-minute neighborhoods, with isochrones and nearby amenities
TODO: Give a quick Python example of what interacting with the end goal could look like.
Just data is not enough
At first glance, the existing Map structure could be written to some format
with a nicely documented schema. This would certainly be useful, but it's not
nearly enough. Interpreting the data sometimes requires lots of code, which
already exists -- so why not expose it to users as well?
Examples in OSM where I wish "standard libraries" existed to interpret the data:
- The simple task of detecting intersections between ways
- Figuring out what lanes a road has from tags
- Gluing multipolygons together
- Inferring turns at an intersection, subject to the several types of turn restrictions
A/B Street solves these problems (or at least it tries to), but by itself, the resulting data isn't always useful. So some examples of where a library would be needed too:
- Pathfinding. ABST does lots of work especially to handle "live" map edits and cheaply regenerate contraction hierarchies. Also, pathfinding requires obeying OSM turn restrictions that span multiple roads -- this prevents even plain old Dijkstra's from working correctly.
- Getting geometry in different forms. Lanes are stored as a
PolyLine, but what if a consumer wants the thickenedPolygon, either as points, or maybe even pre-triangulated vertices and indices?
How would an API/library work?
The traditional approach is to link against part of A/B Street as a library and call it through language-specific bindings. The more language-agnostic option is defining an API (maybe JSON or protobuf) and having clients run a local A/B Street server, making HTTP requests to it. This is like the "sidecar" pattern in microservice-land.
Compatibility
Really have to think through this carefully. Some examples of big changes on the horizon:
- Additive: separate cycleways and tramways. Likely no schema change.
- Modify: traffic signals will get more complex
- Modify: we'll likely try again to merge tiny intersections together, which would get rid of the current guarantees that a road/intersection is associated to one particular OSM object
Layering
Clients should be able to opt into different data layers. For example, A/B Street strips out OSM building tags right now to keep filesizes small. But an OSM viewer would want to keep this (and likely discard the large contraction hierarchies). So some pieces of the map model need to be teased apart into optional pieces, and probably loaded in as separate files.
The bigger vision
Depending what other open source projects are on board, the general idea is to start assembling an ecosystem of libraries/tooling to make it easier to build new things off of open GIS data.
The end state might look like this. A few separate applications would exist, all running both natively and in the browser:
- A/B Street the game, more or less in its current form
- A new OpenStreetMap viewer, likely focused on visualizing roads and points-of-interest in detail
- The street parking OSM editor, and other OSM editors specialized for mapping certain things
- A new app focusing on 15-minute neighborhoods, using isochrones to show
amenities available nearby
- Ideally, allow editing current land use / zoning, to let people explore how new policies might get closer to a 15-minute neighborhood.
- Possibly GOAT does all of this already, and this new thing shouldn't be built
- A new app for creating story maps, showing events that occur over time, with lots of detail about the surrounding environment
All of these would make use of some common libraries, which should be extracted out cleanly from A/B Street today:
- the map model and OSM importer
- the widgetry UI library
- some common code for specifically interacting with maps in widgetry
- a tool to generate a traffic demand model from OSM data, optional census data,
etc
- This has been initially prototyped
- the discrete-event traffic simulation that A/B Street uses today
- core geometry/utility libraries
But note only the first application would use things like the simulation library. The point of more cleanly modularizing these pieces is to make it easier for new people to build different pieces, without having to understand and be coupled to everything else. Also, as appropriate, these pieces should use common data formats (like shared-row) to be interoperable with Streetmix, Complete Streets, etc.
A/B Street's Traffic Simulation
This article describes how cars, bikes, buses, and pedestrians are modeled in
A/B Street. All code lives in the sim crate.
This recorded presentation covers some of this.
Discrete event traffic simulation, laggy heads, and ghosts
By Dustin Carlino, last updated September 2021
A/B Street's traffic simulation isn't based on any research papers or existing systems, so this article aims to motivate and explain how it works. This article focuses on how the different agents (drivers, bicyclists, and pedestrians) move around. If you're wondering how we figure out where these agents should go or what time they decide to take trips, go read about travel demand models.
I'm not aiming to survey how other traffic simulation models work here. In short, some focus on "macroscopic" patterns, like the volume of traffic along a particular highway over time. A/B Street is more on the "microscopic" side, modeling individual agents making decisions over time. Many such models use "discrete-time" simulation, where every agent senses and reacts to the world every time-step (0.1 seconds or so). A/B Street actually started with this -- see the appendix for more background. But early on, I switched to a discrete-event simulation instead. So, let's jump into that!
Note: I'll provide references to the current implementation. Someday I'll write that article describing how to build a traffic simulation from scratch...
Starting simple: Pedestrians
Imagine a simple movement model for pedestrians. Usually they exist at some point along a sidewalk and can move in one direction or the other. At intersections, different sidewalks are connected by crosswalks, and pedestrians can also move bidirectionally on those, after waiting for the right time to cross.
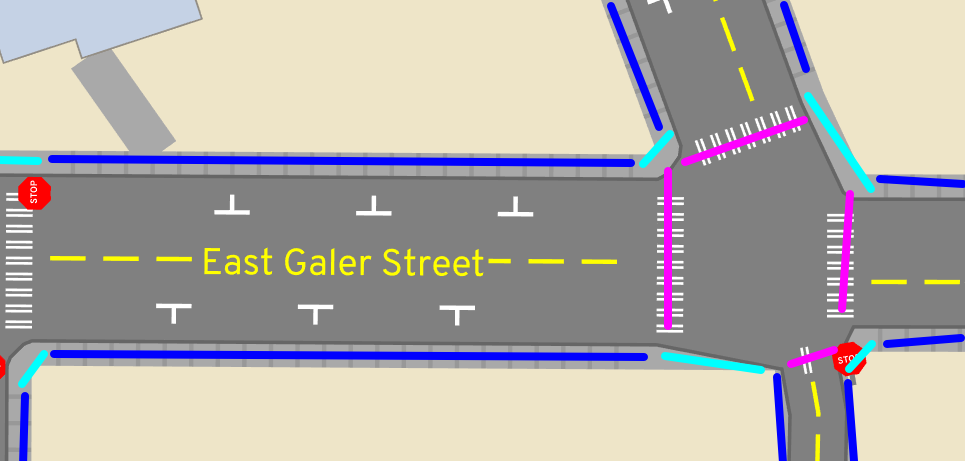
We'll make a few assumptions about pedestrians. They follow the sidewalks and crosswalks perfectly, never deciding to honor their inner Pythagorean. They travel at a fixed speed and change that speed instantly -- no smooth acceleration. That fixed speed could depend on both their preferred walking speed and on the current sidewalk's elevation gain. These poor robotic pedestrians never stop to smell the flowers, write an angry neighborly note, or pet a pupper -- they just walk, or wait. Online dating is also so pervasive in this simulation that pedestrians ghost -- through each other, that is. There are more interesting models of pedestrian movement like the social force model where people change speeds in crowds, but A/B Street is focused on sad American cities where you don't often see many people walking in one place. So there's no collision between pedestrians at all; they just pass through each other, temporarily losing their individuality for rendering purposes:
In the world of discrete timesteps, you could imagine each pedestrian has very simple logic. At any moment, they just continue walking one direction or the other at their fixed speed along a sidewalk or crosswalk. Or they pause at the end of a sidewalk, awaiting their turn at a stop sign or traffic signal.
Discrete events
Don't the constant updates every time-step seem wasteful? Most of the time, a pedestrian is in a steady-state -- walking or waiting. Since they walk at a fixed speed, we can just linearly interpolate their exact position at any moment in time if we want to draw them.
Instead of looping through every agent every time-step, in a discrete-event system, we just have one giant priority queue of events, scheduled to happen at some time in the future. Each agent remains in a certain state for a period of time, and schedules an event to transition themselves to a different state.
In the case of pedestrians, this works like this:
- A pedestrian begins at 30 meters distance along their first sidewalk. They want to walk forwards on the sidewalk, so they calculate the distance to the end of the sidewalk -- say another 70 meters -- and divide that by their preferred speed, scheduling an event an appropriate amount of time later -- say 10 seconds.
- For the next 10 seconds, that pedestrian is in the
Crossingstate, which has aDistanceIntervalstating that they're moving on a certain sidewalk from 30 to 70 meters. TheTimeIntervalsays that this state is occurring from time 0 to 10 seconds. We can linearly interpolate to find their position for drawing. - At 10 seconds, the scheduler wakes up the pedestrian. They're now at the end
of the sidewalk, so they look at the intersection and ask to cross. There's
a traffic signal, and the almighty hand says NOPE, so they hand over control
to the intersection and just mark themselves as
WaitingToTurnstate. No events are scheduled to update them. - But the intersection remembers the list of waiting agents. Some time later, the light changes, and the intersection "wakes up" all of the agents who now have a green.
- Our pedestrian calculates a new
Crossingstate for the crosswalk. This state too happens over some distance and time interval. - At the end of the crosswalk, the pedestrian immediately enters another
Crossingstate for the next sidewalk.
We can visualize this with a finite-state machine:
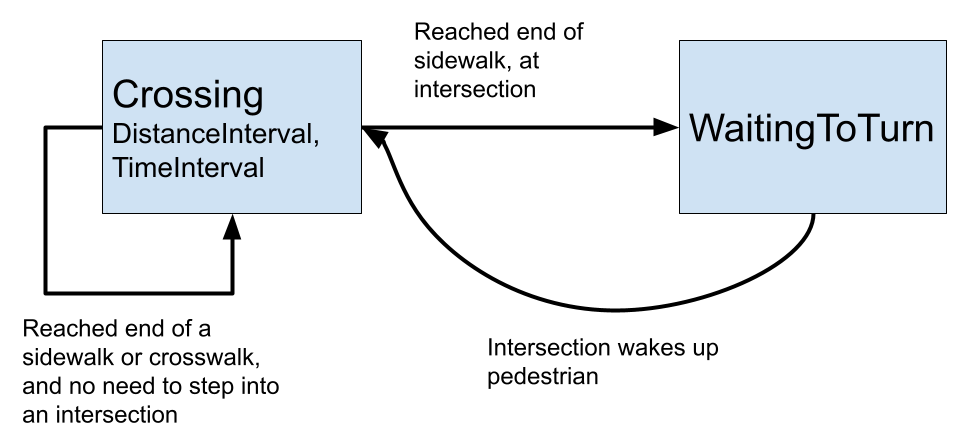
Code references here.
Vehicles
Discrete events are obviously much simpler for pedestrians, but there were some pretty drastic assumptions there that won't work for vehicles. It takes a few more tricks for A/B Street to model cars, bikes, and buses (I'll just use "vehicle" from here on.)
First let's understand what vehicles can do. They travel in one direction along individual lanes, and they queue behind each other -- no ghosting. At intersections, they wait as needed, then move along a "turn," destined for a target lane. There are two major differences from reality that we'll take as assumptions.
First, vehicles instantly change speeds -- no smooth acceleration from rest, or modeling of safe stopping distance. So if a vehicle starts at the beginning of an empty lane, they instantly jump from rest to the maximum speed limit for that road. They travel at that maximum speed limit until the moment their front bumper strikes the boundary between road and intersection, then they stop immediately. This doesn't model highway driving at all, where things like jam waves are interesting to study and require more realistic kinematics and a model of driver reaction time. But A/B Street is focused on in-city movement, and the essence of scarcity I want to model is capacity on lanes and contention at intersections. What happens in between isn't as important. I think you'll find that the overall traffic patterns emerging in A/B Street still look compellingly realistic.
The second article of funny business is lane-changing. Let's assume that vehicles don't change lanes in the middle of a road. Instead, vehicles shift left and right while moving through intersections. So if somebody needs to use a left turn lane, then at the intersection one road back, they'll choose to slide over during their turn. Any conflicting movements with other vehicles is handled at the intersection already.
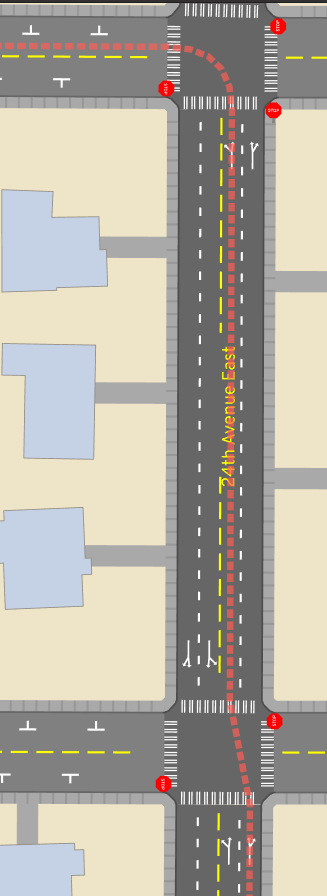
This also means there's no over-taking. If a car gets stuck behind a bike moving slowly uphill, so be it.
We'll try to relax this second assumption later.
The state machine
So let's figure out how to model these vehicles. The approach used by
pedestrians, with Crossing and WaitingToAdvance states doesn't quite work,
because nothing would stop vehicles from plowing into each other. So let's
introduce a third state -- Queued. When a vehicle enters a new lane, it enters
the Crossing state as usual, calculating the "best-case" time to cross the
entire length of the lane at the max speed limit. This assumes nobody's in the
way! But when this state ends, we can only transition the vehicle to the
WaitingToAdvance state if they're the "lead" vehicle in the current lane's
queue. If they have a "leader" vehicle, then they enter the Queued state and
register as a "follower" of this "leader" in the queue.
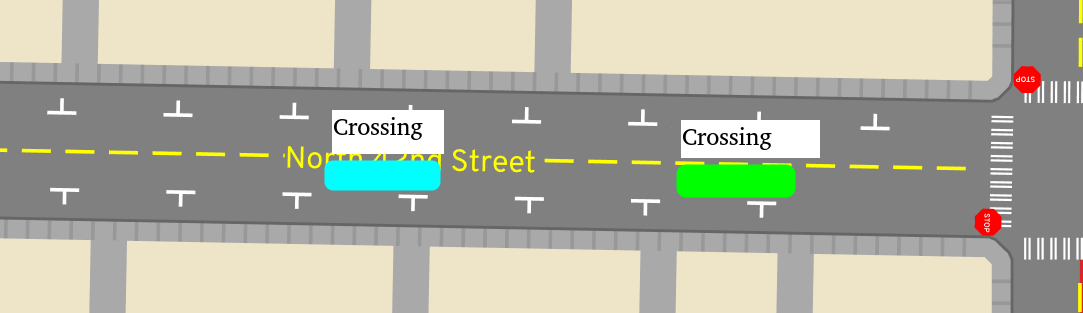
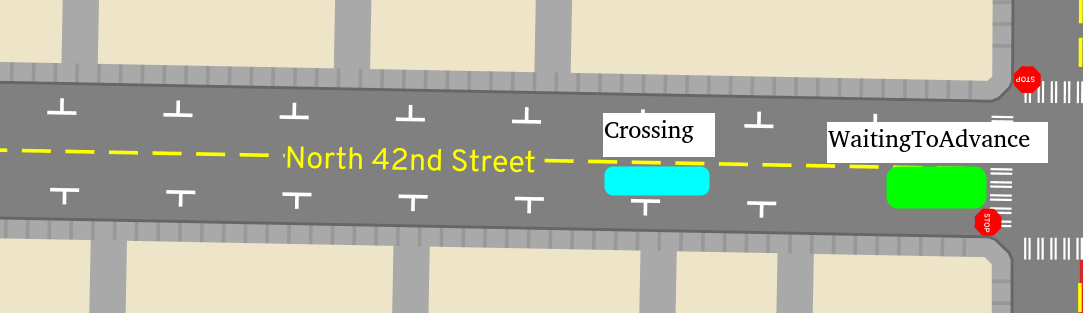
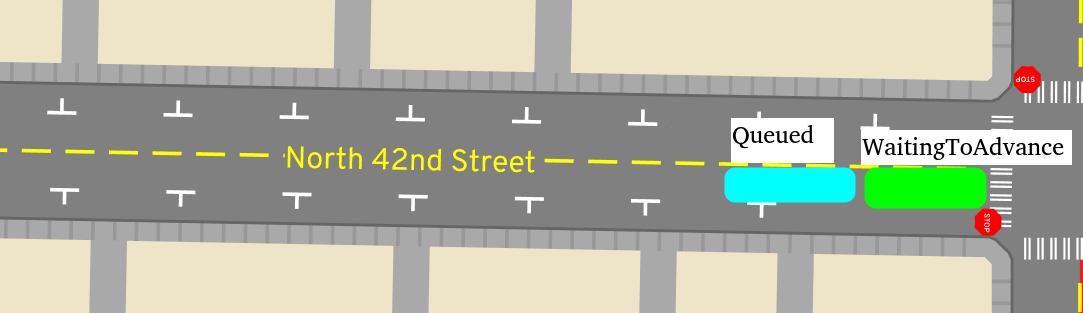
Note that somebody might enter Queued well before they're near the
intersection, like if they're following a slower vehicle. Queued just means
the faster vehicle has already spent the "best-case" time to cross the road at
the full speed limit.
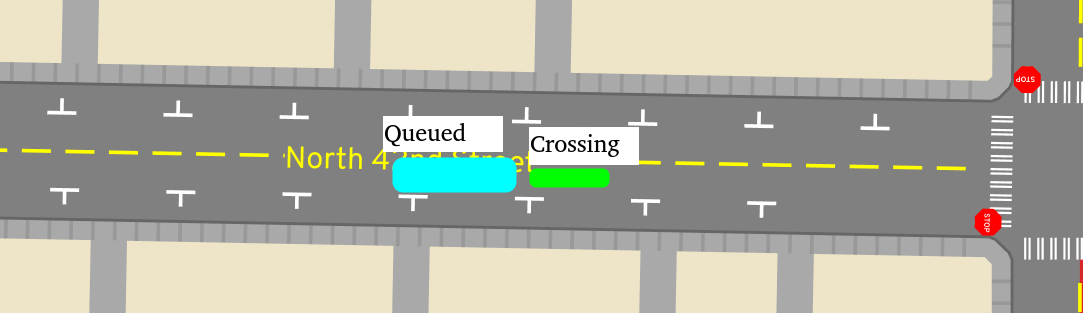
When the vehicle at the very front of a lane enters the intersection and fully
vacates their old lane, then they "wake up" their follower. Since the Queued
follower has been following along as closely as possible, they instantly
transition to WaitingToAdvance, since we know they're at the end of the lane.
"Fully vacating" the lane means the back of the vehicle clears the lane; see the
section below.
We can again understand all of this with a finite-state machine:
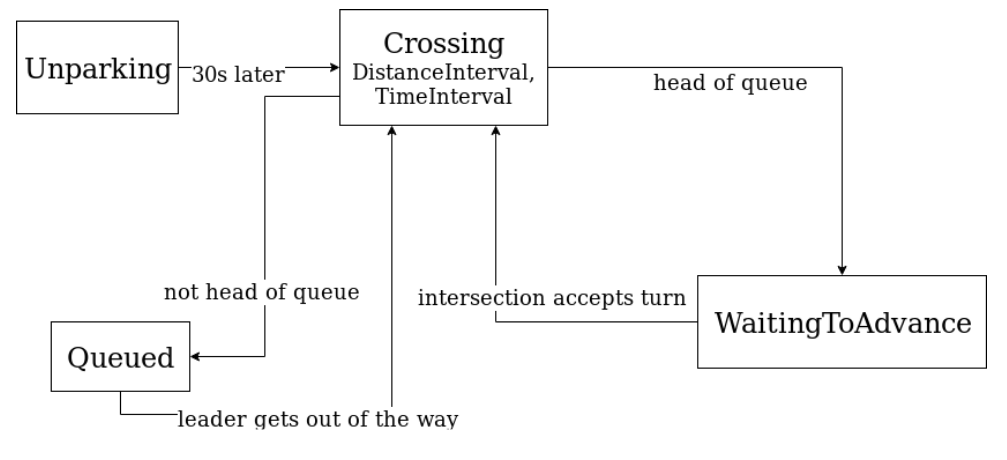
Code references here and here.
Exact positions
Most of the time, we don't care exactly where on a lane some vehicle is. But we do need to know for drawing and for a few cases during simulation, such as determining when a bus is lined up with a bus stop in the middle of a lane.
To calculate exact positions, we walk along each lane's queue from front to back. The key idea is that leaders bound the position of followers, and we can "lazily evaluate" the position of followers. This means that calculating one vehicle's position costs as much as calculating the entire queue's in the worst case, but that's usually fine -- for drawing, we want everyone anyway.
The process is simple. We use each vehicle's state to determine the "best-case"
position of their front bumper. WaitingToAdvance means the vehicle is at the
very end of the lane. For vehicles still Crossing, we linearly interpolate the
time and distance intervals. Then as we walk from front to back, we maintain a
"bound" for the next vehicle's position. This is based on the front position of
the current vehicle, plus the vehicle's length and a fixed following distance
(which, note, is not based on speed).
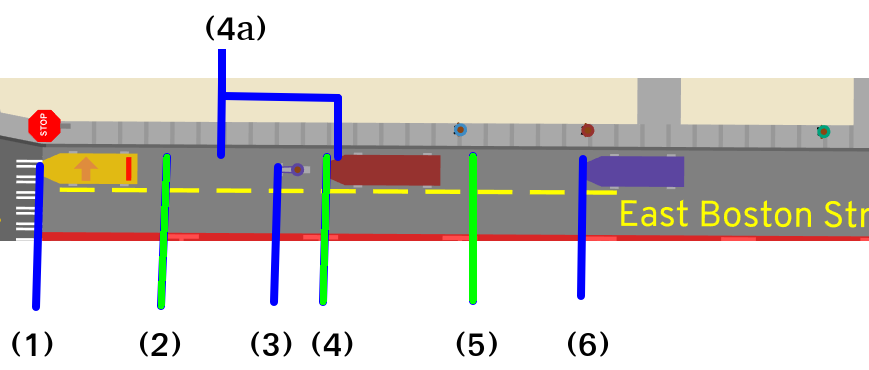
Let's walk through the example above, from front (the left side) to back. The
yellow car is WaitingToAdvance at the intersection, so their front position
(1) is the full length of the lane. Based on the length of that car and a
following distance of 1 meter, the bound imposed by this first car is at (2)
-- nobody following could possibly be beyond this position.
The second vehicle in the queue is the bike. Based on their Crossing state,
which says they're crossing from 0 meters along the lane to the full length of
it from 30 seconds to 90 seconds, we linearly interpolate and get their front
position (3). This position is smaller than the bound of (2), so no
adjustment is needed.
The third vehicle is the red car. Based on their Crossing state,
optimistically they would be at position (4a) by this time. But since
they're following the bike, then they're bound by position (4), so that's
where this algorithm places them. The bound for the next vehicle is then (4)
plus the vehicle's length and a following buffer, giving us (5). The final
vehicle hasn't reached that position yet based on its Crossing state, so it's
unaffected by that bound and is just at (6).
Code here.
Laggy heads
Vehicles aren't infinitesimal dots; they have a length, so each one has a front and back. This means we have to be a little careful about defining when a vehicle has left a lane and its follower should be considered the "first" in the queue:
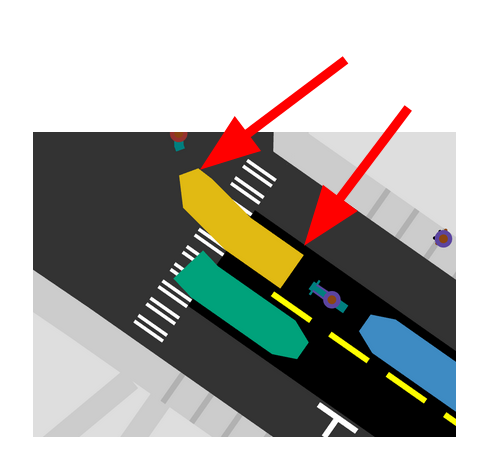
To model this, every lane's queue may have a "laggy head." (Naming things is
hard...) The head of this queue may be the bike, but because the yellow car is
still the laggy head, the bike remains Queued. When the yellow car enters the
intersection, we need to determine when its back will clear the lane, letting
the bike wind up at the very front. Optimistically we assume the yellow car will
travel through the turn as fast as possible, so we can calculate the time to
cross the car's length, and schedule a check there. When that check happens, we
calculate the exact position of the yellow car -- maybe it's queued behind other
vehicles making the same turn, or blocked by other vehicles in its target queue.
If it's advanced far enough, then we unregister the yellow car as a laggy head
and wake up the bike, who changes from Queued to WaitingToAdvance. If the
yellow car's back end is still sticking out into the lane, then we schedule
another check a fixed 0.1 seconds. This retry policy is quite aggressive and
will slow down the simulation as traffic jams start to form.
This logic to determine when a vehicle's back has fully cleared a lane is unfortunately complicated by the presence of short roads and turns, a currently unsolved problem in the underlying map model. A long vehicle like a bus may partly be overlapping several lanes and turns at a time, meaning we have to carefully calculate when the back of the bus has cleared each piece.
Performance
It's been a very long time since I've measured the performance of this discrete-event simulation, so these numbers are rather out-of-date:
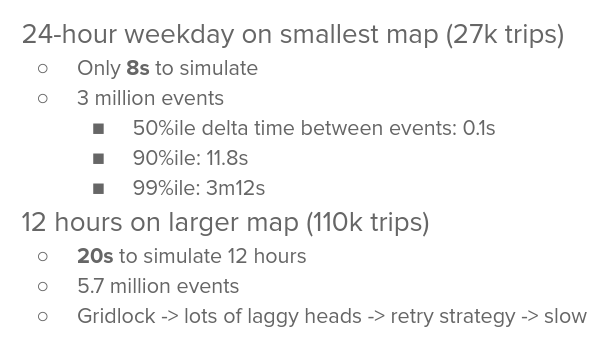
One of the reasons the simulation is more performant than discrete time-steps is by how much time the simulation advances between updates. With discrete time, it's always a fixed amount -- 0.1 seconds usually. With discrete events, it depends when the next event is scheduled -- the later that event occurs, the faster the overall simulation proceeds. On a nearly empty map with really long roads, a single agent only needs a few updates to complete its trip -- very loosely, an update at the beginning and end of each lane and turn in its path. As more vehicles queue along the same lane at the same time, we increase the number of updates to process all of them, but it's still less than updating every agent every 0.1 seconds.
There are a few big opportunities to improve performance, by requiring less updates when vehicles are stuck waiting at intersections or stuck behind laggy heads. From some older investigation, it's clear that a huge amount of processing is spent on agents trying to start a turn and on checks that a laggy head has cleared a queue.
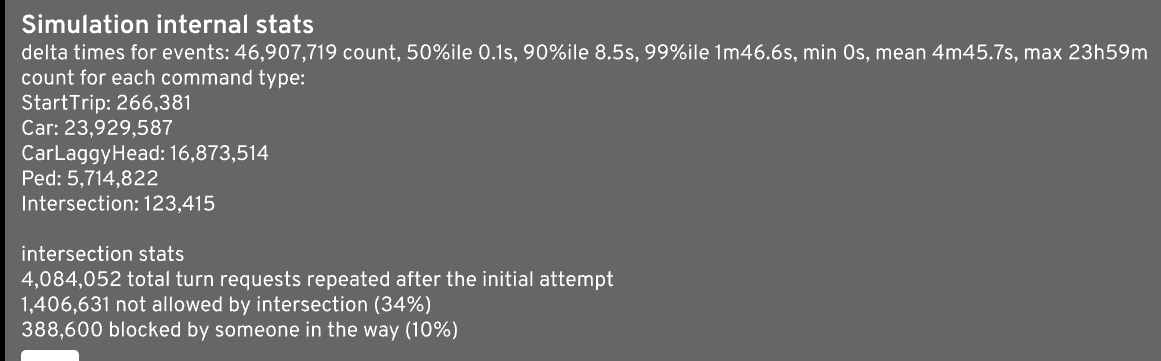
Lane-changing
For a long time, A/B Street had no dynamic lane-changing or over-taking. As described earlier, vehicles use the conflict handling at intersections to change lanes in order to pick the lane required for a turn ("mandatory lane-changing") or that's likely to be fastest ("discretionary lane-changing"). But that finally changed in June 2021.
Background
The lane-changing implemented right now is only discretionary, meant for cars to over-take slower vehicles. In a previous project, I tried implementing mandatory lane-changing. But the process could fail -- if there wasn't room for a vehicle to start changing lanes, it would just continue on the current lane and miss the turn it was supposed to take. That forced rerouting. Since the lane-changing process is scoped to happen on a single road -- which seems pretty necessary to manage complexity, and also prevent changing lanes in the middle of an intersection -- this meant that clusters of short roads in the map model really caused major problems. Many vehicles repeatedly attempted lane-changing maneuvers required by pathfinding, but impossible to actually pull off in the simulation. This greatly skewed results -- some agents experienced really high trip times as they repeatedly rerouted and kept attempting difficult maneuvers.
I considered making the process infallible -- vehicles would slow down and eventually stop, until they forced their way into another lane. I suspect this could also lead to lots of unrealistic gridlock, but I never tried it.
So that's why there's only discretionary or "opportunistic" lane-changing for now.
Step 1: deciding to change lanes
The current implementation will now be described. The process starts when a
vehicle transitions from Crossing to Queued. The follower will compare its
ideal speed to that of its leader. If the leader is still Crossing and has a
slower speed, then the follower will try to over-take. If the leader is also
Queued, then there's probably no opportunity to over-take -- the follower is
probably just hitting the end of a chain of vehicles waiting for an
intersection.
Next the vehicle will pick a lane to use for over-taking. There's currently no support for crossing a road's center line and temporarily using a lane in the opposite direction. The target lane must also be compatible with the vehicle's path, so if there's a turn coming up, nothing will happen.
Finally, the vehicle will attempt to initiate the lane-changing. There's a bunch of checks in the code that I won't repeat here. In summary, we require a fixed 1 second duration to perform the manuever. During this, the vehicle will exist in two queues. Committing to the move requires completion before reaching the end of the road, and nothing in the way in the target lane.
Step 2: performing the lane-changing
The vehicle enters the ChangingLanes state, which works almost exactly like
Crossing. The vehicle immediately "warps" to their target lane. They exit
their original lane, replacing themselves with a "ghost" in that queue. The
ghost follows the leader vehicle and shares the same length as the actual
vehicle. This ghost prevents another vehicle from advancing too close to the
slow leader and "clipping" into the vehicle changing lanes.
Future work
There are many limits with the current approach.
First, vehicles should be able to change lanes twice and return to the original lane, actually passing a slower vehicle. I got a proof-of-concept working. The idea is to "acquire a lock" on both lane-changing movements at the same time, so that a vehicle doesn't start to over-take and then wind up unable to return to the original lane. This involves inserting a ghost in front of the slow vehicle, but there are some unsolved conceptual problems that I've... completely lost context on.
Once full over-taking works, letting vehicles cross into incoming traffic to over-take would be the next step. This will require calculating what part of that opposite direction queue should be blocked off for the duration of the movement.
There are some smaller things to polish:
- A lane-changing vehicle can visually "clip" into the slow leader, due to the vehicle's front position no longer being bound by the slow leader. See here for a bit of detail.
- Start the first step before a vehicle enters
Queued. This is the reason why cars will follow a bike for a few seconds before trying to pass. This could be done by calculating the time at which a faster follower will intersect a slower leader, and scheduling an event to possibly initiate lane-changing then. - Once a vehicle decides it wants to pass somebody, it only checks if there's room in the target lane once. If there happens to be somebody in the way, it gives up. We could schedule more retries, possibly based on how busy the target lane is. But if this is too aggressive, at some point we degrade to the performance of time-steps.
Appendix: discrete-time simulation
A/B Street's first traffic model was discrete-time, meaning that every agent reacted to the world every 0.1s. Cars had a more realistic kinematics model, accelerating to change speed and gradually come to a halt. Cars did a worst-case estimation of how far ahead they need to lookahead in order to satisfy different constraints:
- Don't exceed any speed limits
- Don't hit the lead vehicle (which might suddenly slam on its brakes)
- Stop at the end of a lane, unless the intersection says to go
After fighting with this approach for a long time, I eventually scrapped it in favor of the simpler discrete-event model because:
- It's fundamentally slow; there's lots of busy work where cars in freeflow with nothing blocking them or stopped in a long queue constantly check to see if anything has changed.
- Figuring out the acceleration to apply for the next 0.1s in order to satisfy all of the constraints is really complicated. Floating point inaccuracies cause ugly edge cases with speeds that wind up slightly negative and with cars coming to a complete stop slightly past the end of a lane. I wound up storing the "intent" of an action to auto-correct these errors.
- The realism of having cars accelerate smoothly didn't add value to the core idea in A/B Street, which is to model points of contention like parking capacity and intersections. (This is the same reason why I don't model bike racks for parking bikes -- in Seattle, it's never hard to find something to lock to -- this would be very different if Copenhagen was the target.) Additionally, the kinematics model made silly assumptions about driving anyway -- cars would smash on their accelerators and brakes as hard as possible within all of the constraints.
And if you made it this far, have a poem about discrete event simulation (and also compilers) that I wrote many years ago...
Travel demand
A/B Street simulates people following a schedule of trips over a day. A single trip has a start and endpoint, a departure time, and a mode. Most trips go between buildings, but the start or endpoint may also be a border intersection to represent something outside the map boundaries. The mode specifies whether the person will walk, bike, drive, or use transit. Without a good set of people and trips, evaluating some changes to a map is hard -- what if the traffic patterns near the change aren't realistic to begin with? This chapter describes where the travel demand data comes from.
See these slides for this this recorded talk for up-to-date information as of March 2022.
Scenarios
A scenario encodes the people and trips taken over a day. See the code.
See here for details how vehicles are initially placed and used by the driving trips specified by the scenario.
Data sources
Seattle: Soundcast
Seattle luckily has the Puget Sound Regional Council, which has produced the Soundcast model. They use census stats, land parcel records, observed vehicle counts, travel diaries, and lots of other things I don't understand to produce a detailed model of the region. We're currently using their 2014 model; the 2018 one should be available sometime in 2020. See the code for importing their data.
TODO:
- talk about how trips beginning/ending off-map are handled
Berlin
This work is stalled. See the code. So far, we've found a population count per planning area and are randomly distributing the number of residents to all residential buildings in each area.
Proletariat robot
What if we just want to generate a reasonable model without any city-specific
data? One of the simplest approaches is just to spawn people beginning at
residential buildings, make them go to some workplace in the morning, then
return in the evening. OpenStreetMap building tags can be used to roughly
classify building types and distinguish small houses from large apartments. See
the proletariat_robot
code
for an implementation of this.
Census Based
Trips are distributed based on where we believe people live. For the US, this
information comes from the US Census. To take advantage of this model for areas
outside the US, you'll need to add your data to the global population_areas
file. This is one huge file that is shared across regions. This is more work up
front, but makes adding individual cities relatively straight forward.
See the code for the very simple activity model using the census data.
Preparing the population_areas file
See this script for updating or adding to the existing population areas. Once rebuilt, you'll need to upload the file so that popdat can find it.
Grid2Demand
Collaborators at ASU are creating
https://github.com/asu-trans-ai-lab/grid2demand, which does the traditional
four-step trip generation just using OSM as input. The output of this tool can
be directly imported into A/B Street. From the scenario picker, choose "Import
Grid2Demand data" and select the input_agents.csv file.
abstr
Robin Lovelace is working on an R package to transform aggregate desire lines between different zones into A/B Street scenarios.
Desire lines (for the UK)
The UK has origin/destination (aka desire line) data, recording how many people travel between a home and work zone for work, broken down by mode. We have a tool to disaggregate this and create individual people, picking homes and workplaces reasonably using OSM-based heuristics. See the pipeline for details about how it works. The code that parses the raw UK data is here. If you have similar data for your area, contact me and we can add support for it!
Custom import
See here.
Modifying demand
The travel demand model is extremely fixed; the main effect of a different random number seed is currently to initially place parked cars in specific spots. When the player makes changes to the map, exactly the same people and trips are simulated, and we just measure how trip time changes. This is a very short-term prediction. If it becomes much more convenient to bike or bus somewhere, then more people will do it over time. How can we transform the original demand model to respond to these changes?
Right now, there's very preliminary work in sandbox mode for Seattle weekday scenarios. You can cancel all trips for some people (simulating lockdown) or modify the mode for some people (change 50% of all driving trips between 7 and 9am to use transit).
Research
- https://github.com/replicahq/doppelganger
- https://github.com/stasmix/popsynth
- https://zephyrtransport.github.io/zephyr-directory/projects/
- https://activitysim.github.io
- https://github.com/BayAreaMetro/travel-model-one
- https://github.com/RSGInc/DaySim
- https://github.com/arup-group/pam
- https://spatial-microsim-book.robinlovelace.net/smsimr.html
- https://github.com/DLR-VF/TAPAS
- https://sumo.dlr.de/docs/Demand/Activity-based_Demand_Generation.html
- Watch Dogs: Legion has a synthetic population of London, generating individual detail lazily from real statistical data
Future ideas
UK data sources
Currently A/B Street is using 2011 flow data -- specifically WU03UK (the location of usual residence and place of work by method of travel to work).
There are some others to consider:
- WF01AEW_oa from
here
has even more granular home<->work zones
- Need to compare to WF01BEW
- https://www.nomisweb.co.uk/sources/ukbc could be used to understand how many people work at different places
- NTEM has forecasted OD pairs
- QUANT and SPENSER are two other population and activity/time-use datasets, used by another project I'm working on called RAMP
Use cases
What're all the uses of an accurate travel demand model? And when might it be helpful to represent synthetic people with more info than just their daily trips?
- the obvious: traffic simulation
- Ungap the Map's mode shift calculation -- look for short driving trips, then check the network to see if there are common gaps that might prevent cycling. Do we need to understand the demographics of people taking these "possible to switch" trips?
- the LTN tool's impact predicton -- without using traffic simulation, just calculate routes before and after changes
- Equity and health analysis
- If we think some interventions might cause higher traffic (and thus noise/air pollution and safety issues) on major roads, who lives near the affected area?
Validation / calibration
How do we judge whether a given travel demand model is "good"?
For comparing two different models, one idea is to "re-aggregate" individual trips from each of them and see if overall counts look similar. For example, partition the map into zones (maybe using zones that one of the models being compared used originally, or maybe making up new ones), count the trips between zones, and compare between models -- grouping by departure time and mode, or not.
This comparison could sanity check that roughly the same number of people live and commute to the same places. But it's not a very satisfying judgment, because it's not really what we're trying to measure. I think the validation that makes sense is to plug the model into an analysis we actually care about and where we have real observations. One of the simplest -- and most useful for LTN impact prediction, particularly -- is just estimating traffic volumes at different roads and intersections.
Gridlock
Here "gridlock" refers to the general problem of trips getting permanently stuck, preventing the full simulation from completing. Most of the work is tracked here.
The general lesson is: you can't code your way around all edge cases. The data in OSM often needs manual fixes. It's often useful to spend coding effort on tools to detect and fix OSM problems.
Problems
The choices in the movement model matter. Some gridlock is inherent to any system with queueing and conflicting turns. But in reality, people wiggle around partly blocked turns. And some of this comes from the treatment of the front/back of vehicles.
- Short roads in OSM causing very weird geometry
- Intersection geometry being too large, requiring too much time to cross
- Unrealistic traffic patterns caused by everyone trying to park in one big garage (downtown) or take some alley (the UW soundcast issue)
- Too many people try to take an unprotected left turn (often at a stop sign)
- Bad individual traffic signals, usually at 5- or 6-ways
- Groups of traffic signals logically acting as a single intersection
- Separate traffic signals along a corridor being unsynchronized
- Vehicles performing illegal sequences of turns
- Vehicles are stuck with their plan and not reacting to traffic by changing route
- Real traffic would result in a gridlock without a deliberate actions to avoid it. Such actions range from individual decisions of drivers to police manually controlling traffic. Intelligent avoidance of gridlock is not simulated and is extremely hard to simulate.
- Vehicles will wait in lane filled with already waiting vehicles, even if there is a completely empty lane allowing travel in desired direction. It makes easier for entire lane between crossings to fill, contributing to gridlocks. Note that while this and other clearly stupid behaviors are clearly unrealistic, it is not trivial to implement more realistic and more efficient decisions.
- Issues caused by the unrealistic
lane-changing model
- Two turns that go to the same lane (one going "straight", the other often a lane-change) conflict. The conflict is coarse, at the granularity of the entire intersection. So if vehicles are piled up in two lanes trying to merge into one, then one group is likely to go through as expected, but the second group will wait for the first to completely clear the intersection. Until then, it looks like a conflicting turn is being done.
Solutions
Divide into implemented or not.
- Synchronizing pairs of signals
- Uber-turns
- for interpreting OSM turn restrictions
- for synchronizing a group of signals
- for locking turn sequences
- Once a vehicle starts an uber-turn, prevent others from starting conflicting turns on nearby intersections. Until groups of traffic signals are configured as one, this is necessary to prevent somebody from making it halfway through a sequence then getting blocked.
- Cycle detector
- block-the-box protection
- the manual list of overrides
- likely shouldn't apply during uber-turns
- is it always fine to block the box at degenerate intersections?
- hacks to allow conflicting turns at really broken intersections
- manually timing signals
- penalties for lane choice to make lane usage realistic
Not implemented
- Dynamic rerouting
- Allow multiple vehicles through intersection at once if there is enough space
on lane where given vehicle is going. Currrently vehicles travel through
crossings one by one (or, with
--disable_block_the_boxenabled - will enter crossing even if leaving it will be impossible). - Last resort: if someone's waiting on a turn >5m, just go.
- Uber-turns
- Group both stop sign and traffic signal intersections when looking for uber-turns. Even a single traffic signal surrounded by tiny roads with stop signs is causing problems.
Strategy for resolving
Because there are so many different causes all tangled together, my approach is to simplify the simulation as much as possible. A problem is much easier to understand and fix when it's isolated. I've been trying this to get the downtown weekday scenario to complete. A list of different techniques to simplify, in no particular order:
- Use the
--infinite_parkingflag to just let everyone park directly in their destination buildings. This is useful since downtown has many large parking garages with high capacity, but I don't have a data source describing them. - Use the
--disable_turn_conflictsflag, which greatly reduces realism, but lets conflicting turns happen simultaneously. (Even with this and other flags, downtown still gridlocks!) It also disables traffic signals, so bad inferred timing isn't an issue. - Use the
--disable_block_the_boxflag to workaround short roads. - If you notice problems forming from cars stacking up behind slower cyclists,
there's no over-taking implemented yet. Use the scenario modifiers to convert
all biking trip to driving:
--scenario_modifiers='[{"ChangeMode":{"to_mode":"Drive","pct_ppl":100,"departure_filter":[0.0,86400.0],"from_modes":["Bike"]}}]' - If all else fails, use the scenario modifiers to bluntly cancel some percentage of all trips.
A quick method for "disabling" buggy short roads is to use edit mode and close the lanes. This forces traffic to reroute around the problematic area, which might create other problems, but it can be useful.
Fixing data used in simulation
Give more examples of changesets.
- upstreaming turn restrictions into OSM to prevent invalid U-turns and other crazy movements
- upstreaming lane count fixes into OSM to improve geometry
Multi-modal trips
A single trip consists of a sequence of TripLegs -- walking, operating a
vehicle (car or bike), and riding the bus. Depending whether a trip begins or
ends at a border or building, there are many combinations of these sequences.
This is a way to categorize them into three groups. I'm not sure it's the
simplest way to express all the state transitons.
Walking-only trips

Trips starting from a border

Trips starting from a building

Spawning code overview
As of January 2021, starting a traffic simulation works like this:
- Something creates a
Scenario, which defines a bunch of people. Each person has a schedule of trips, carrying them betweenTripEndpointsvia someTripMode, leaving at someTime. - When a scenario is instantiated, not much happens besides scheduling the trip
to start at the appropriate time and filling out
TripInfoinTripManager. Some state inStartTripArgshas to be plumbed forward in theCommand::StartTrip. - When the command gets run later,
TripManager::start_triphappens. The origin, destination, and mode flow throughTripSpec::maybe_new. TripSpec::to_planfurther validates these and attempts to repair impossible plans. EachTripSpecis turned into a list ofTripLegs.- Each
TripSpechas its own initialization logic to kick off the first leg of the trip. - Most trips have multiple legs. When the first car, bike, or pedestrian
reaches their goal,
TripManagergets called with some sort of transition function to initiate the next leg of the trip, or declare the trip finished. These transition functions also record stats from that leg of the trip, like total blocked time.
What're the different TripSpec cases, and what TripLegs do they get turned
into?
VehicleAppearing: Starts at a border. Drive, then maybe walk to the destination building.SpawningFailure: No trip legs; just create and immediately cancel the trip.UsingParkedCar: Starts at a building. Walk (to the parked car), drive, then maybe walk to the destination building (after parking again).JustWalking: Just walk between two buildings/borders.UsingBike: Starts at a building. Walk to the nearest bikeable lane, drive, then maybe walk to the destination building. (Note that starting a bike from a border usesVehicleAppearing.)UsingTransit: Walk, ride the bus, maybe walk again. No transfers yet; only rides one bus between two stops.
TripManager has a whole bunch of transition functions:
car_reached_parking_spot: drive -> walk, unless the destination building is where we parkedped_reached_parking_spot: walk -> driveped_ready_to_bike: walk -> bikebike_reached_end: bike -> walkped_reached_building: walk -> doneped_reached_bus_stop: walk -> wait or ride busped_boarded_bus: waiting -> ride busperson_left_bus: riding bus -> walkped_reached_border: walk -> donetransit_rider_reached_border: ride bus -> donecar_or_bike_reached_border: drive -> done
There are at least a few use cases motivating the cleanup of all of this structure:
- Capping trips through congested areas. Sometimes this just changes the driving route, but sometimes it needs to cancel trips, convert driving trips to walking/transit, or delay the trip's start.
- Multiple public transit rides in a single trip, aka transferring
- Handling live map edits in the middle of a trip
Live edits
When the player edits the map, there's an efficient process for applying the edits at the map model and rendering layer. In the middle of a simulation, it's less obvious how to apply all edits. Most of the time currently, edits cause the simulation to reset to midnight. Applying edits to the sim without reset is important for running machine learning experiments and for improving the gameplay experience (by having more immediate feedback about the consequences of a change).
The UI has a dirty_from_edits bit to track when changes have been applied
without reset. This lets us tell the player that by the end of the day, any
score / results are tentative, because their edits might have a different effect
earlier in the day.
What works today
Changes to traffic signals are simple -- incremental_edit_traffic_signal
happens at the map layer, and then handle_live_edited_traffic_signals at the
sim layer just resets the current stage to 0 if the previous configuration had
more stages.
TODO: Recalculating paths
Many of the edits will influence routes. For trips that haven't started yet, there's nothing to do immediately. Paths are calculated right before the trip starts, so slight changes to the start/end of the path due to map edits (like where somebody starts biking, for example) are captured naturally.
For currently active trips, in some cases, rerouting would be ideal but not necessary (like if speed limits changed). In other cases -- like changing access restrictions, modifying lane types, closing intersections -- the route must be recomputed. As a simple first attempt, we could just cancel all active trips whose path crosses an edited road or intersection. Later, we can figure out rerouting.
And actually, the only other case to handle is ChangeRouteSchedule, which
should just be rescheduling the StartBus commands.
TODO: Parking
What happens if you modify a parking lane while there are cars on it? For now, just delete them. Trips later making use of them will just act as if the car never had room to be spawned at all and get cancelled or fallback to walking.
A better resolution would be to relocate them to other parking spots. If the owner is home, it'd be neat to have them walk outside, move the car, and go back in. But this greatly complicates the simulation -- the edited lane is in a transition state for a while, it modifies schedules, the person might not be around, etc.
Parking
In some areas, lots of traffic is caused by people circling around the block in search of parking. And often, a great deal of space in a city is spent on street parking, surface lots, and garages. So, A/B Street attempts to model parking as a step at the beginning and end of every driving trip.
Types of parking
Every parking spot can be categorized as public or private. Anybody can use public spots, but only trips beginning or ending at a particular building can use private spots inside of it. There's no modeling yet of time limits or fees.
On-street parking acts as one lane of the road. The full length of the lane gets
divided up into spots with a per-city configurable length, called
street_parking_spot_length, with a default of 8 meters. This is the only type
of parking that players can edit in-game, by changing lane types. Street parking
is always public.
Parking lots are also always public. OSM includes the service "aisles" running through the lot, and A/B Street automatically packs in individual spots, winding up with an estimate of the capacity.
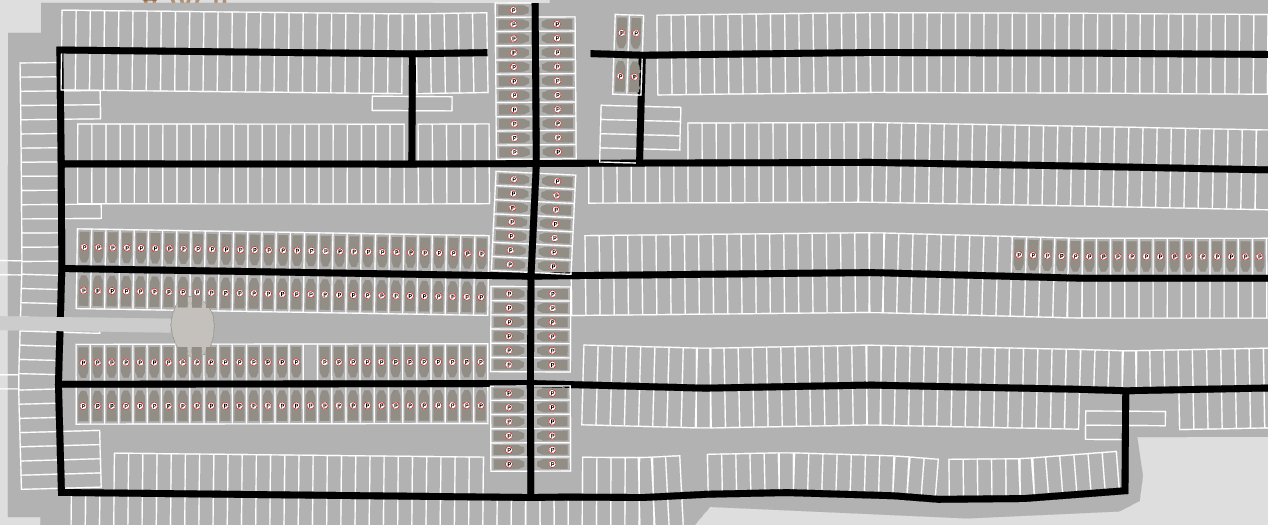
Off-street parking is part of a building. Physically this could mean a parking garage, a small private lot behind some apartments, or a few spots in a carport and driveway -- there's no distinction in A/B Street. Off-street parking can be public or private.
Data sources
On-street parking comes from OSM, using the parking:lane tags. This field is rarely mapped; see here to help with that. Different cities can optionally configure some percentage of residential roads to automatically infer a parking lane or two.
Parking lots only come from OSM. Individual spots and capacity is almost never mapped, so A/B Street doesn't use that data.
Public off-street parking is only configured for Seattle right now, and comes from this dataset.
I've yet to find any data that would help estimate private off-street parking.
For now, this is per-city configuration, called FixedPerBldg. We could
definitely do better by estimating building size. There's an exception for two
Seattle maps currently -- the number of off-street spots is set to equal the
number of driving trips that originate from that building over the course of the
entire day. This is also unrealistic, but was some attempt at improving those
two maps.
Simulation
This seems like a good place to preface that A/B Street doesn't have any kind of car-sharing, ride-share, or even multiple people in one car yet.
Seeding cars
See seed_parked_cars for reference.
When a simulation starts at midnight, where are cars initially placed? That process first figures out how many cars are needed per building through the day. If 100 driving trips originate from that building, you might think the building needs 100 cars nearby. But many of these trips might actually arrive at the building earlier using a car, in which case, when the same person later departs, they'll take their car.
After this count per building is produced, we place each car as close as possible to its building, only going far away as we run out of capacity. We always prefer seeding a car inside a building than on the street or in a lot. The list of cars to seed is shuffled, so that roughly helps with fairness -- we don't fill in all of one building's cars first, then go the next -- that would arbitrarily place one building's cars closer.
There's also a detail in this randomization process about the available spots. The consequence is this: when a player makes a few changes to the amount of street parking in an area, the effects shouldn't percolate everywhere and change how cars are seeded far away -- unless the change adds/removes so much capacity that the effect really would spill out that far.
How people pick a spot
When a car gets to the last lane before its target building, it starts looks for a free spot. If there's one on the current lane, it goes for it. If not, it uses a breadth-first search, using distance, to explore from its current lane until it finds a free spot. To avoid many cars in one area all contending for the same spot, the distance used in the search has some randomized scaling applied. Omnisciently knowing where free spots are located far away isn't realistic, but attempting some kind of human-realistic random walk seems even harder to get right.
Infinite parking
If you pass --infinite_parking on the command line, every building gets
unlimited public spots. This effectively removes the effects of parking from the
model, since driving trips can always begin or end at their precise building
(except for blackhole cases). This is useful if a particular map has poor
parking data and you need to get comparative results about speeding up some
trips. Often the A/B testing is extremely sensitive, because a parking space
close to someone's destination is filled up quickly, slowing down the trip.
Blackholes
Vehicles don't know how to turn left (or right for UK folks) from a driveway yet. This means that some buildings and street parking lanes near map boundaries might not be reachable from most of the map. Consequently, even though there might be parking there, the simulation ignores it, because it's "blackholed".
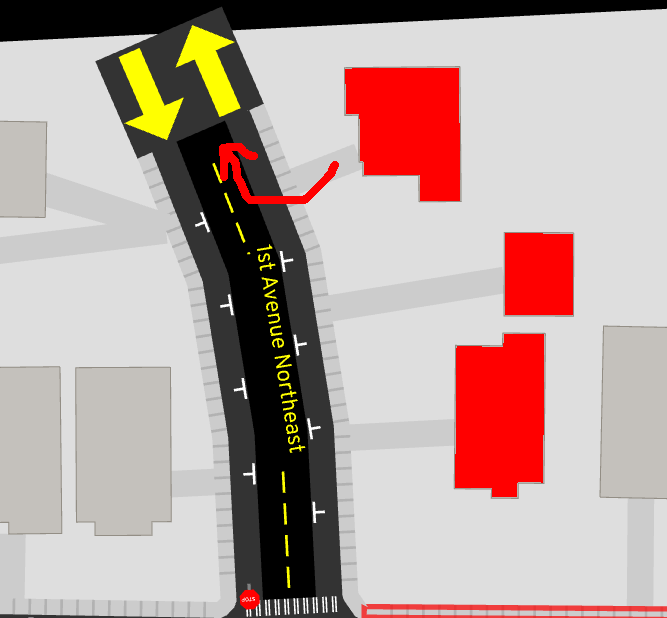
Data viz
There are 3 tools in the game that'll help you understand the effects of how parking is modeled.
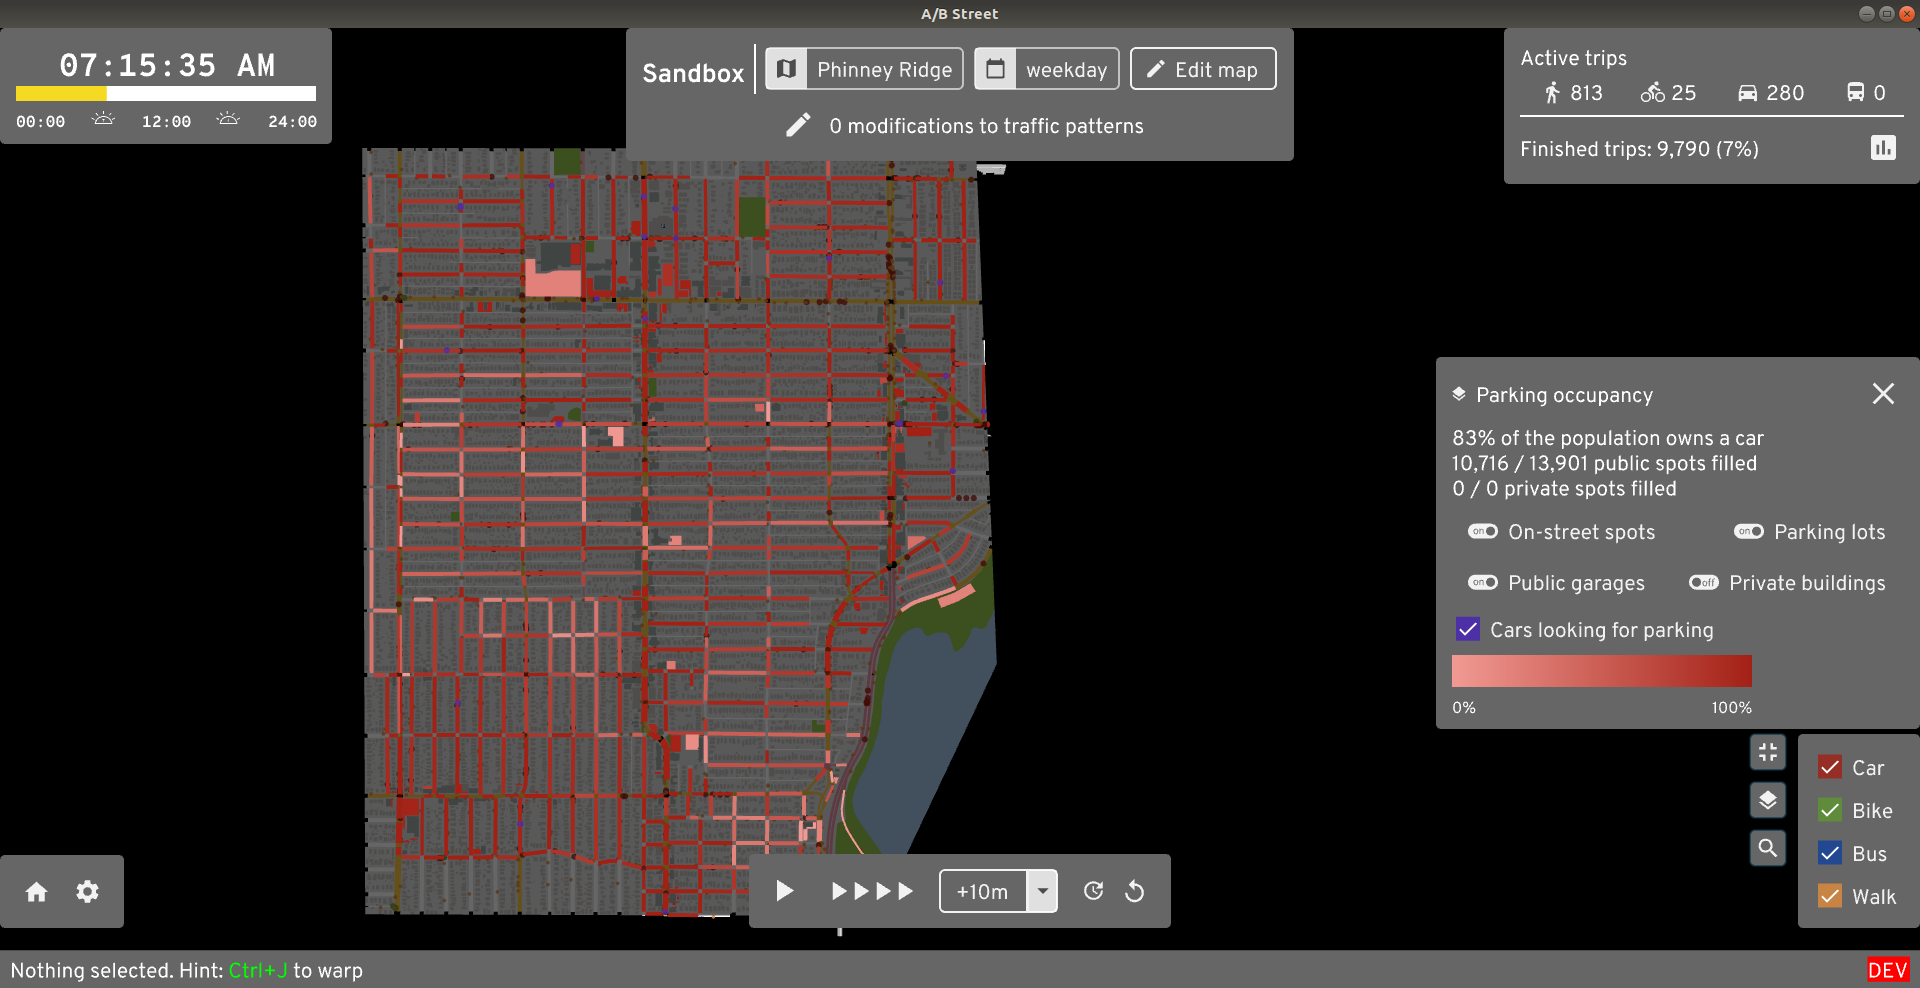
The parking occupancy layer shows where parking spots are currently available.
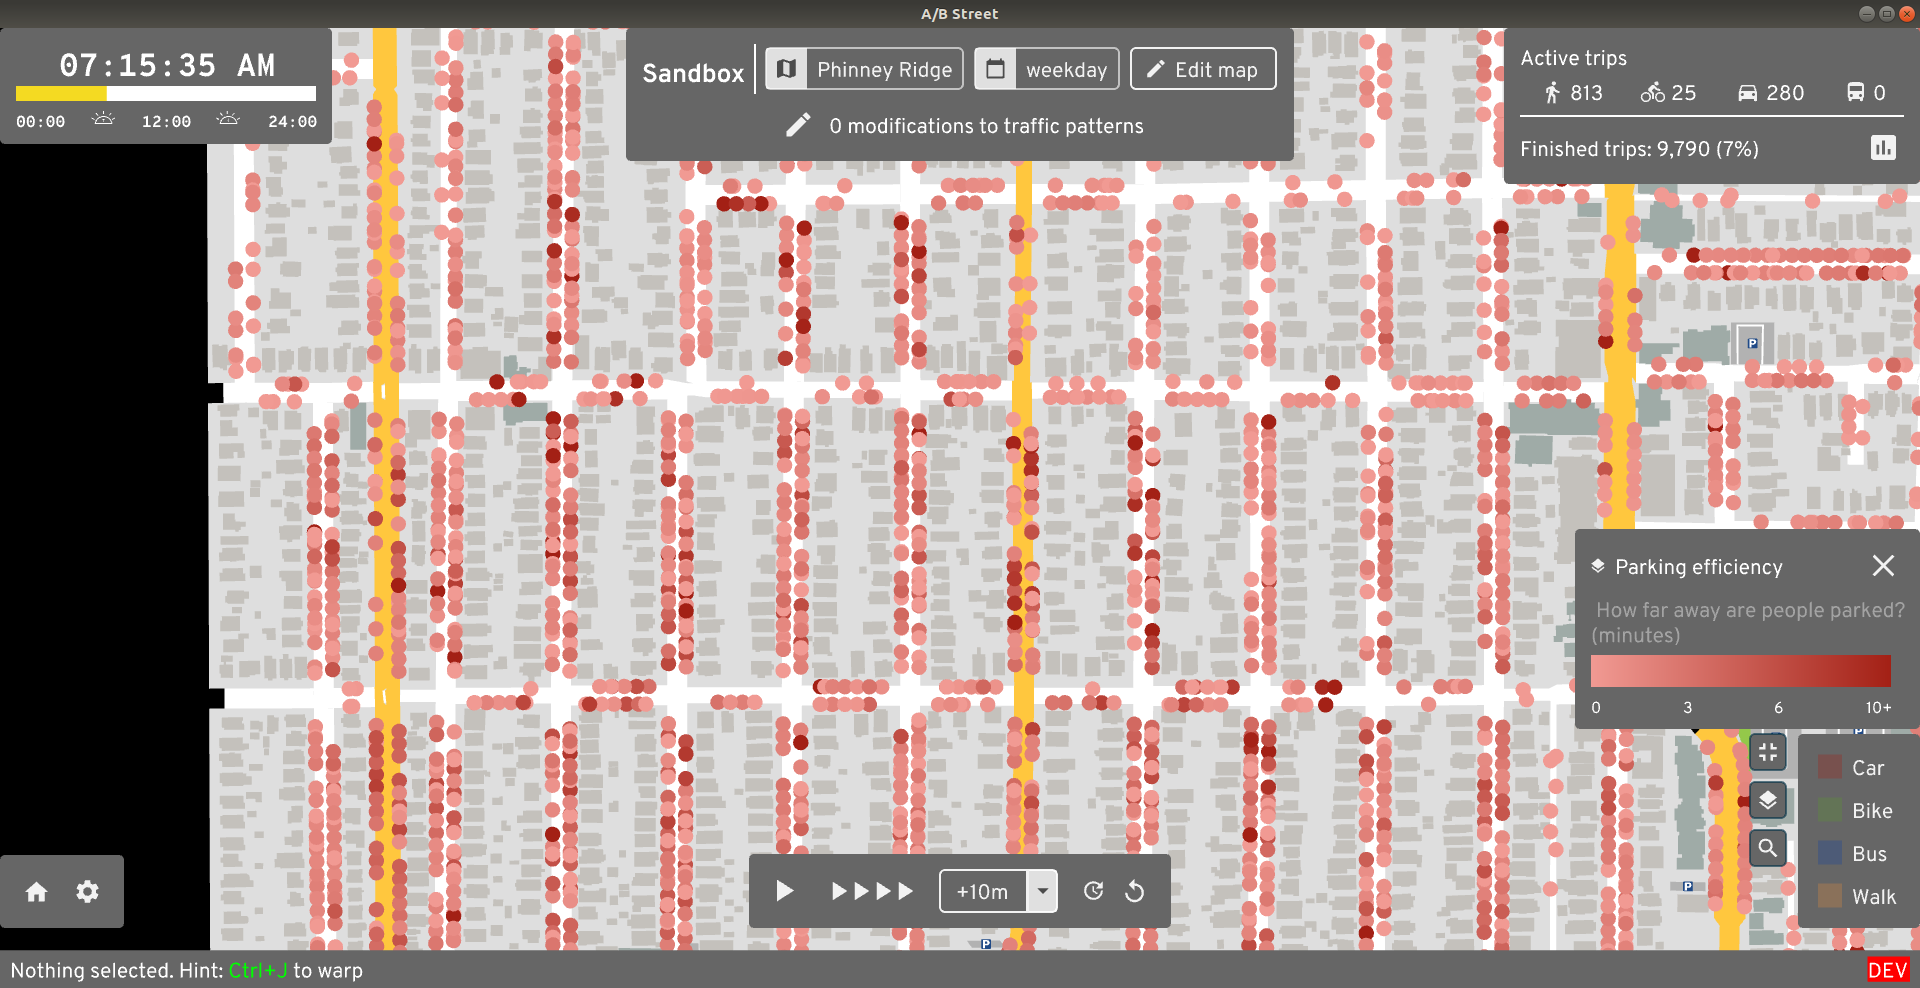
The parking efficiency layer shows how far away from their destination somebody was forced to park. If you see lots of dark red dots, then people wound up parking somewhere, then walking a long way to actually get to their building. This is probably unrealistic, likely due to bad guesses about capacity in different areas.
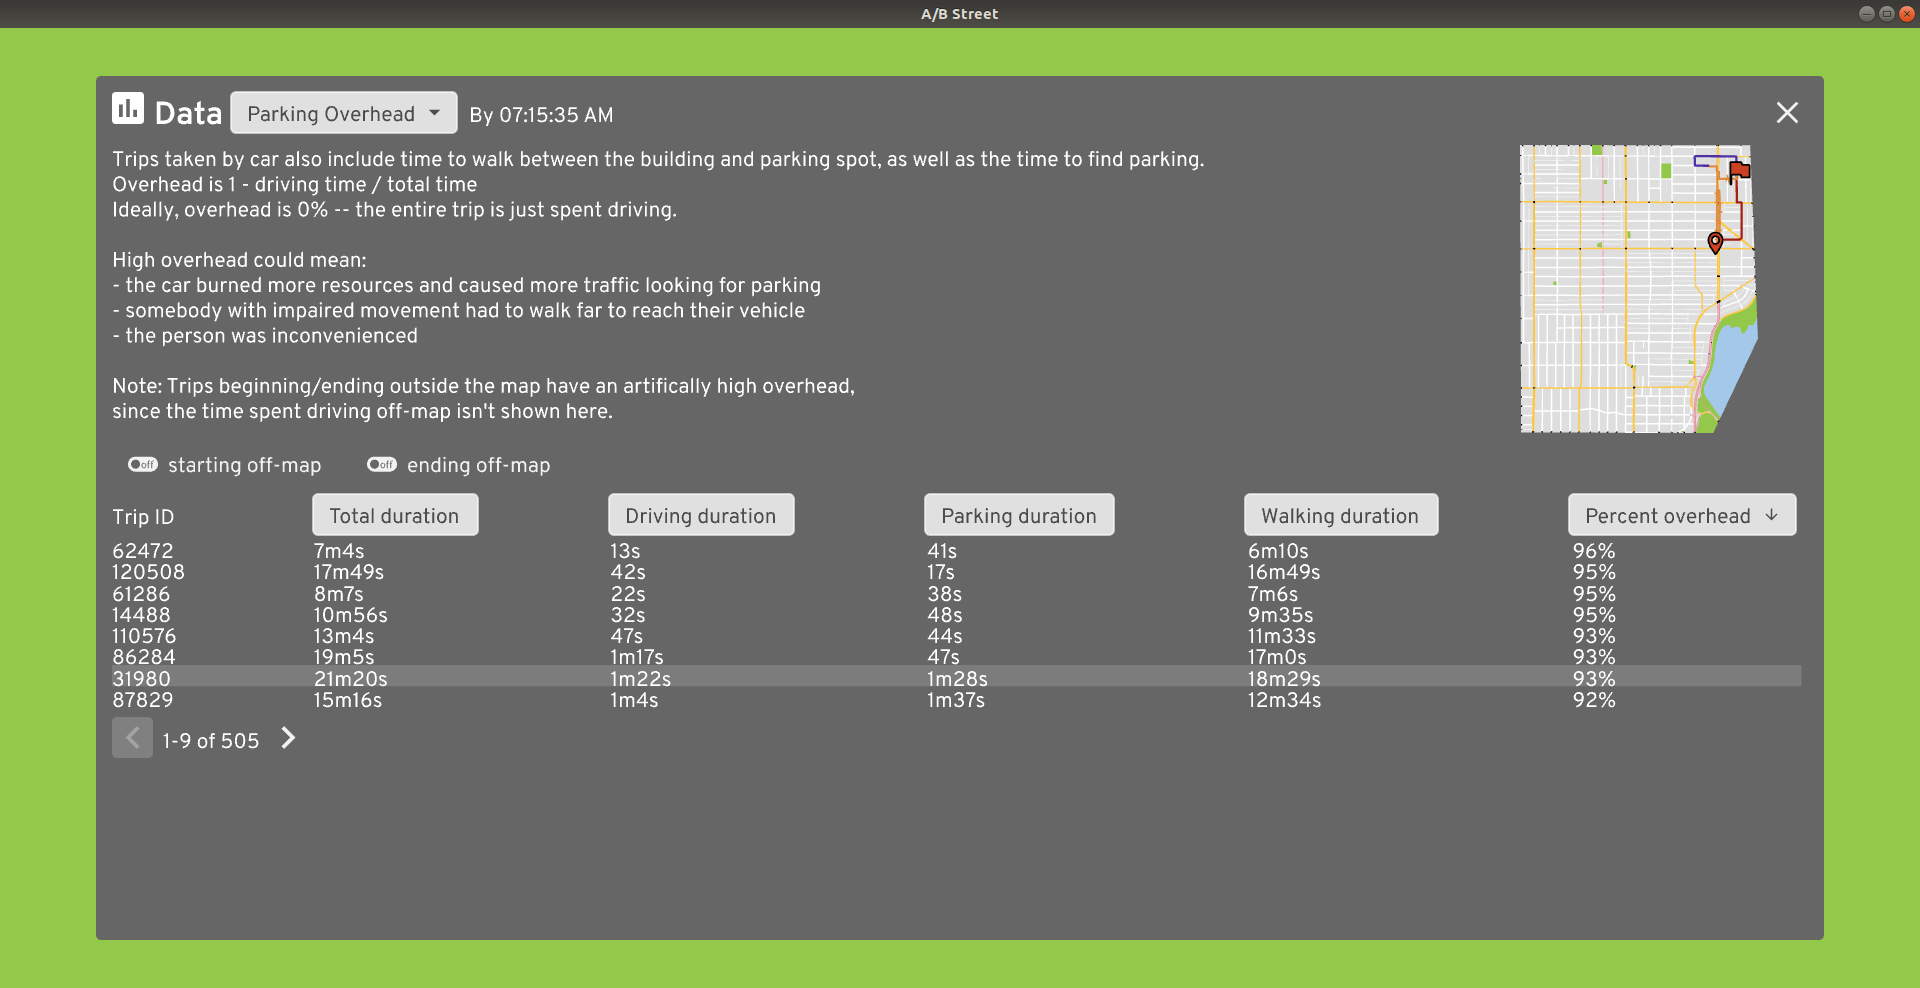
The parking overhead dashboard looks at every driving trip that included a parking phase. It measures how much of the total trip time was spent actually driving, vs looking for parking and covering any remaining distance by foot.
Project logistics
This has some background/logistics about the project.
Team
The core group:
Collaborators from other projects:
- Robin Lovelace on ActDev and demand modelling in R
- Xuesong Zhou of ASU's Transportation AI Lab on GMNS integration
Full credits
Programming:
- All contributors
- Trevor Nederlof 15m explorer and census
- Pandemic modeling by Orestis Malaspinas (orestis.malaspinas@hesge.ch)
- OSM expertise courtesy Mateusz Konieczny
- Lots of helpful PRs from Javed Nissar
- Lots of traffic signal and uber-turn work from Bruce
- osm2lanes by Michael Droogleever Fortuyn and Ben Ritter
Graphics / design:
- Logo by Ryan Pierson
- Graphic design advice from Starcat Games, Daniel Huffman, Brian Prince
- Character art by Holly Hansel
- In-game character faces adapted from Anokhee Jandhyala
- Game design advice from Christopher Klein
- Color and street rendering help from Tobias Zwick of StreetComplete
- Additional UX design and research from Trang Le, Mara Cruz, and Cindy Huang
Software dependencies:
- Lightning-fast pathfinding thanks to fast_paths by Andreas Barth (easbar.mail@posteo.net)
- Lots of help with rendering SVG and fonts from RazrFalcon and nical
- Elevation data from Eldan
Networking:
- Hackathon drop-ins from Democracy Lab events
- CUGOS and Julian Michael have been great sounding boards for ideas since the beginning
Product management / community outreach:
Data:
- Special thanks to all OpenStreetMap contributors!
- King County GIS
- Seattle Open Data
- Puget Sound Regional Council
- IPUMS NHGIS, University of Minnesota
- Ordnance Survey Terrain 50 data is OS data © Crown copyright and database right 2022
Contributing
Lots of people are interested in this project, with very diverse backgrounds. This page isn't meant to be prescriptive or limit options; it's just a starter.
Programming
The biggest hurdle here is that A/B Street is written in Rust, a language that may have a high entry barrier. If you're more comfortable in Python, R, or something else, there are still ways to contribute -- particularly producing input data for A/B Street to simulate.
Machine/reinforcement learning
If you're a researcher looking for a complex multi-agent simulation with lots of things to optimize, you've found the right place. We have a simple JSON API already you can plug into, but we'd love to improve this based on your use case. Particularly cool ideas could be auto-tuning traffic signal timing or calibrating travel demand scenarios to real-world throughput/delay measurements.
Transportation modelling
Do you sling around population and aggregated origin/destination data with R or Python? Great, help us generate realistic travel demand models! Work in whatever language you like best; we'll settle on a common format.
Working on A/B Street itself
You'll need to learn at least some Rust to start here. We can help you a bit with that, especially by recommending starter projects or giving feedback in PRs, but this requires a fair bit of independence.
There's so many different types of things to work on -- see our hiring page and Github issues.
Data visualization / analysis
A/B Street generates loads of individual data through the simulation, but deciding what's important, how to aggregate things, what filters/controls to give to the user, and how to communicate trade-offs is really hard!
We can export data however's useful -- there's a few CSV files that the UI can export today. You can work on analyzing and visualizing the data using whatever tools you like. To actually implement a new dashboard in A/B Street, we'll implement it in Rust, but we can implement/copy what you produce elsewhere.
Some examples where we need help:
- How to aggregate and compare the number of "risky events" somebody encounters on their trip, possibly using some kind of contingency matrix. See this PR for some discussion and open questions
- How to show roads with more/less traffic. See this discussion
Design
We wouldn't have made it to this point without loads of help from our UX designer. We could always use more help here. We use Figma for designs currently.
Graphics
From what I've seen, no other street map attempt to include lane markings and as much detail as A/B Street. This means there's not much cartography to take inspiration from. Some places we need help:
- Showing arterial vs small residential roads while zoomed in
- Conveying more information about buildings and land use -- is it a small house, some apartments, a shop, a mall, a multi-use development?
- Tuning the color-scheme, especially in a color-blind friendly way
- Visualizing low traffic neighborhoods
- Many people can't recognize the pedestrians and cyclists; how do we represent them better in our 2D top-down view? What should e-scooters look like?
Storyboarding
We didn't start A/B Street with a clear set of product requirements or a storyboard for how it should work -- and we've been paying the price of this all along. But newer tools like the 15-minute explorer or the idea for a low-traffic neighborhood planner are focused and young enough where we could properly plan out the features and UI.
Game design
A/B Street tries to be a game, but it falls pretty short. Want to help us improve the tutorial? Have some ideas how to split up levels in the challenge mode? Know how to write a story? Help us!
Or maybe you can imagine a new spin-off game reusing some of the work that exists today. That's how 15-minute Santa happened!
Using A/B Street
You have an idea for fixing something in your city
That's why we made this! Just go try and make the change, initially without help from us. Write down your experience and all of the problems you hit. Then tell us the problems and any ideas for fixing them.
Then write up a proposal and start advocating for it!
You're an advocacy group
If you want to use A/B Street to argue for some change in your city, get in touch! It's easiest if you:
- Tell us very clearly what you need
- Draw a study area
- Have a pretty specific idea of what roads/intersections you want to actually change
- Have an idea of how you want to communicate your idea; browse our proposals for inspiration
Researching car-free cities
Maybe you're studying urban planning and think our software can help. We have some of the tools to get you started -- importing a new map, changing road configuration and access, measuring comparative results. But you'll probably have to work with us directly to fix up the map data and get a proper demand model. You can help us by giving usability feedback about what's hard to do and ideas for things to add. We're not experts in planning -- if you can tell us how software can help you do your job better, let's talk!
Usability studies
Every so often, we conduct formal usability studies. You'll spend an hour on a videocall doing something in A/B Street and vocalizing your thought process and what problems you hit. We'll use your feedback to find and fix problems.
We only run these every now and then; just contact us to get on the list for the next round.
Reporting bugs
You're bound to hit problems using our software -- just file an issue when you do.
Improving data quality
A/B Street relies on having an accurate and up-to-date model of your city. What do you do when it's wrong?
Fix incorrect lane data
The most common problem is that a road has the wrong number of lanes, or turn/bike/parking lanes are missing. If you know how to edit OpenStreetMap already, go fix it. If not, you can use the lane editor in A/B Street to fix the problem and make the road match reality. Send us your edits, and we can help make the fix in OSM.
OpenStreetMap mapper
Are you already involved in OSM and want to validate your work? Use our tool to help you visualize lane tagging easily. Keep in mind there are some problems with this viewer that might not reflect problems with the data in OSM -- particularly separate foot/cyclepaths and weird intersection geometry.
Or maybe you think your city is incredibly well-mapped already -- I bet it's missing one thing. Please map street parking -- we need this to guess road widths.
Project logistics
Networking / marketing
Know an advocacy group or city authority who would want to use our work? Make the connection!
Project management
Organizing all of the information, ideas, and people involved with this project is hard. Just writing this page and website took way too many tears and caffeine! We could also use help prioritizing work and coming up with requirements for new ideas.
Write documentation
This website is easy to edit. We could especially use help writing a user guide -- describe how different tools in A/B Street work, or work through examples of how to do stuff.
Funding
Our funding is pretty nonexistent, but if we had some, we could hire more people and build useful things faster. Do you know how to write NSF grants? Have you thought of a business model compatible with our values but that would let us financially sustain ourselves? Do you think we should be an LLC, a B corp, a non-profit, something else? Help needed!
Funding
A/B Street is in need of funding. If you would like to support the development of A/B Street, e.g. to get a particular feature implemented or to get support using it to simulate changes in a particular city, get in touch.
Funding received:
- Contract with ActDev
The project has funded two open-source libraries needed by A/B Street, supporting the development of open source software for transport planning applications:
Project motivations
I thought it'd be helpful to explain what motivates my work in A/B Street. These are just my personal values; I don't intend to make a careful argument about these here. In no particular order:
-
Transparency and reproducibility: if city government uses data, modeling, or simulation to inform a decision affecting the general public, then anybody ought to be able to repeat that analysis.
- This means code and data should be open.
- Businesses like Sidewalk Lab's Replica and Remix still need to generate income, but it's unclear why governments use taxes to pay for something only they see.
- Decision making should be documented clearly. Why were the 35th Ave bike lanes scrapped? Was the amount of on-street parking on nearby residential roads factored in? Was there analysis of how trip time is impacted by parking in the neighborhood and walking a few blocks to a business on the arterial?
- I'm personally inspired by approaches like vTaiwan and PDIS
-
Accessibility leads to participation: There's overhead to taking small ideas to advocacy groups or inconveniently timed public meetings. If the planning process is easier to interact with, more people will participate.
- Seattle's Your Voice, Your Choice program is maybe an example of this
-
Short-term changes: ST3 is exciting, but 2040 isn't close. There are much cheaper changes that can be implemented sooner.
- Most of the edits in A/B Street are inspired by tactical urbanism; they could be prototyped with signs and paint.
-
The US is too dependent on cars: This has an unacceptable impact on the environment. Even ignoring that, many cities are out of room to build more roads. We can't keep scaling population like this.
-
Autonomous vehicles will NOT save the day: They can squeeze more throughput out of existing infrastructure, but only up to a point. They might encourage people to move and tolerate longer commutes. Mass transit and dense land-use patterns handle population growth better.
-
Compromise and trade-offs: I see lots of rhetoric calling for extreme, sudden change. I don't want to ban all cars from downtown Seattle, because that's not realistic. I want to focus on immediate steps forward. I want to come up with estimates about impacting drivers by a median 3 minutes in order to save a bus route 1 minute, and to shift public discourse towards that.
Project history
As of June 2020.
tldr: A/B Street has been in active development since June 2018, but the idea has been festering since I was about 16.
Retrospective
What poor judgments have cost me the most time?
- UI churn: I should've studied some UX on my own and started with a clear idea of how to organize everything
- OSM data quality: I should've gained the confidence to upstream fixes earlier
- Intersection geometry: I should've realized sooner that simulation robustness is more important than nice appearance.
- Geometry primitives: I sunk too much time into the polyline problem and f64 precision.
Trivia
- The name was almost "Unstreet" or "Superban" (superb urban)
- I hope you enjoy and/or are baffled by the release names
Backstory
I originally wanted to tell a much longer story here of how I came to work on A/B Street, but I'm not sure this is the right time yet. So consider this the quick version.
I grew up in Baton Rouge, where driving is effectively the only mode of transport. (I've gone back and made a point of taking long walks to confirm how antagonistically the city is designed towards walking.) Very early on, I fell in love with a Nintendo 64 game called Banjo Kazooie, which led me to the online fan communities of the early 2000's. I wanted to create games too, so I started learning programming via library books and lots of questions on IRC. Because I never had any confidence in art, I wound up working on roguelikes, which led to a fervent interest in pathfinding algorithms and collaborative diffusion. When I started driving in high school, I quickly realized how bad people were at it. I remember being stuck at the intersection of Florida Blvd and Cloud and first wondering if the pathfinding algorithms could help with traffic. Can you see where this is going?
I moved to Austin for college. One of the first days of class, I shuffled down the stairs of Gearing Hall past a crackly old speaker apocalyptically announcing the weather forecast (details add color, right?) into a seminar demanding a totally open-ended first assignment to do something interesting. After I left, somebody stopped to ask me for directions, but I didn't know campus well yet. I thought about how Google Maps gave really silly walking directions. So I decided I'd hand-draw a map of campus, showing all of the construction, how to cut through the labryinth that is Welch Hall on hot days, and where to find the 24/7 robot coffee machines, and hack together a routing engine to help people find the shortest path between their classes. The feedback I got on this assignment included something along the lines of, "I was really pretty impressed first that you would be so stupid as to actually try to do this..."
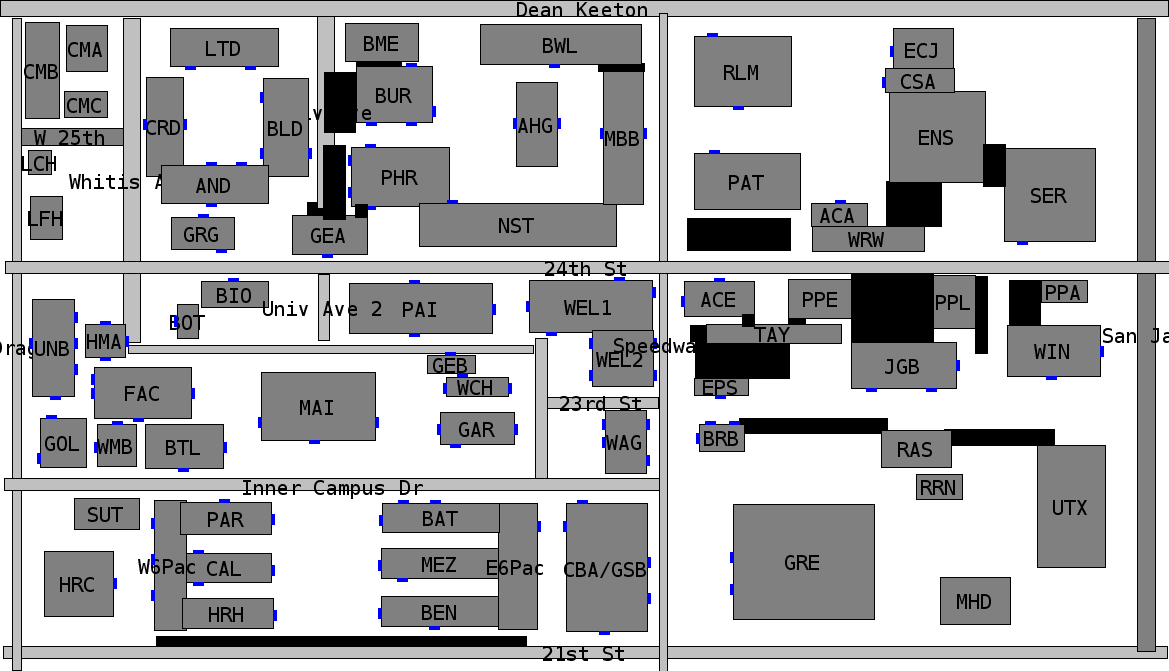
But I did, and that led me to discovering OpenStreetMap, which it turns out was pretty pivotal. (The first version of my campus map was seeded vaguely off an official paper map, but mostly I walked around and invented half-assed surveying methods on the spot.) Next semester, I joined a freshman research stream with somebody who had worked on AIM, UT's demonstration that autonomous vehicles wouldn't need traffic lights. Everything came together, and I started a 3 year journey of building AORTA, a traffic simulator for AVs. Guided by the research lab, I explored the really bizarre idea of letting AVs bid to turn lights green sooner and micro-tolling all roads to disincentivize congestion. Both of these mechanisms would be incredibly unfair to people without the spare cash to back up their high value-of-time, but I brushed this off by saying the currency could be based on carpooling, EVs, etc.
It was great to try research in college; I learned I really dislike munging data and compressing my work into 6 pages of conference paper LaTeX. So I moved to Seattle to work in industry instead, on something completely unrelated to transportation. Lots of things began unravelling for me in Seattle, but one of them was biking. In Austin, I had picked up mountain biking, and all but stopped driving; it was an amazing place to explore and commute by bike. Seattle was different. There were many more cyclists around, but the experience felt more stressful, the drivers more aggressive. I had plenty of near-misses. I kept commuting by bike, but the joy of it was gone. I started noticing how many cars were parked on narrow arterials and wondering why that was a fair use of space. I started paying attention to the public discourse around bike infrastructure in Seattle and feeling like the conversation was... chaotic.
Fast forward to late 2017. This is where I'll omit chunks of the story. I visited London, my first experience with a city that took public transit seriously. When I returned, lots of latent ideas stopped fermenting and started exploding. I threw together a prototype of A/B Street and started the arduous process at work of open-sourcing it and applying to a program to let me work it on for a few quarters. A few months later, I wound up quitting instead, and began to work on A/B Street in earnest.
Year 1 (June 2018-2019)
I skimmed through git and summarized roughly what I was working on each month, calling out milestones. "UI churn" is pretty much constantly happening.
-
June: polyline geometry and lanes, building paths, protobuf -> serde
-
July: pedestrians, bikes, parked cars, lane edits
-
August: porting AORTA's discrete-time driving model
-
September: multi-leg trips, buses, the first ezgui wizard, randomized scenarios
-
October: A/B test mode (and so per-map plugins), forking RNG for edit-invariance, intersection geometry
-
November: clipping / borders, using blockface for parking, time travel mode, test runner framework
-
December: bezier curves for turns, traffic signal editor, a first attempt at merging intersections, right-click menus, a top menu, modal menus
- the grand colorscheme refactor: a python script scraped
cs.get_defcalls at build-time
- the grand colorscheme refactor: a python script scraped
-
January: careful f64 resolution, ezgui screencapping, synthetic map editor
- grand refactor: piston to glium
-
February: attempting to use time-space intervals for a new driving model, new discrete-event model instead
- Feb 19-27: conceiving and cutting over to the new discrete event model
-
March: fleshing out DES model (laggy heads), first attempt to build on windows, gridlock detection
-
April: first public releases, splash screen and rearranging game modes
-
May: fancier agent rendering, attempting to use census tracts, finding real demand data
- milestone: discovered PSRC Soundcast data, much more realistic trips
Year 2 (June 2019-2020)
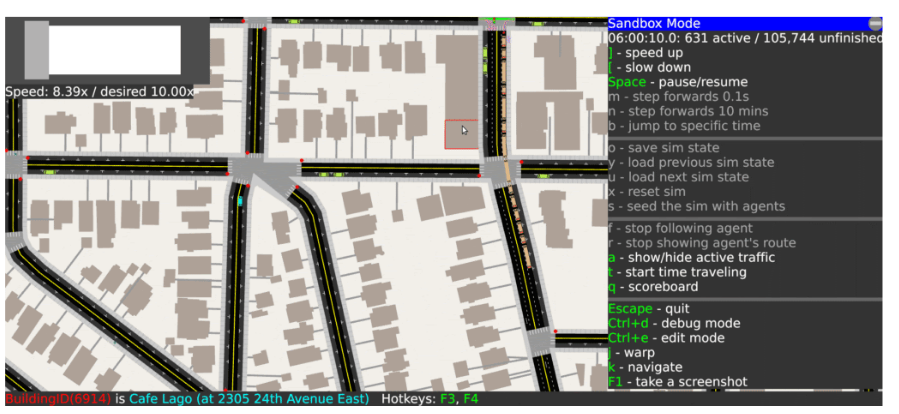
-
June: contraction hierarchies for pathfinding, stackable game states
-
July: OSM turn restrictions, misc (I think I was in Europe?)
-
August: pedestrian crowds, agent color schemes, parking blackholes, a big
raw_datarefactor to storePt2D, attended first hackathon -
September: offstreet parking, associating parked cars with buildings using Soundcast (before that, anybody could use any car!), implemented texture support for some reason, doing manual
MapFixesat scale to fix OSM bugs- milestone: got the smallest montlake map to run without gridlock
-
October: parking sim fixes, opportunistic lane-changing, starting challenge modes
-
November: prebaked sim results, time-series plots, undo for edit mode, traffic signal editor grouping turns
- milestone: Yuwen joins project
-
December: the UI reform begins (flexbox, minimap, trip timelines, cutting over to SVGs, info panels, scrolling), started naming releases sensibly
- Project leaked to HN, woops
-
January: UI reform continues, the modern tutorial mode appears
-
Feburary: UI and tutorial, all text now pure vectors, port to glow+WASM
-
March: lockdowns start in US, start grouping trips as a person, population heatmap, left-hand driving, info panel and typography overhauls. started engaging with Greenways, started effort to map traffic signals
-
April: Orestis joins and starts the pandemic model, trip tables, the optimize commute challenge, refactor for people's schedules and owned vehicles, trip time dat viz, MAJOR progress fixing gridlock at the sim layer
-
May: gridlock progress, upstreaming fixes in OSM, differential throughput and first real write-up, long-lasting player edits, dedicated parking mapper, maybe vanquished the HiDPI bugs, multi-step turn restrictions, random bios for people, and docs like this to prep for launch ;)
- milestone: relying on pure OSM, no more
MapFixes
- milestone: relying on pure OSM, no more
Year 3 (June 2020-2021)
- June: parking lots, real minimap controls, road labels
- June 22: alpha launch! r/Seattle, r/SeattleWA, r/UrbanPlanning, HN, GeekWire, The Stranger
- July: loads of bugfixes, map geometry improvements, UI cleanups,
access-restricted zones for private neighborhoods and no-through-traffic,
better traffic generation between home<->work for new maps, complete overhaul
to bus routes and introduction of light rail, commute pattern explorer,
importing Krakow and Berlin, smarter lane-changing, walkable shoulders for
roads without sidewalks
- KING 5 Evening interview
- August: Michael joins, multiple traffic signals can be edited together, started a headless JSON API, support for other languages in OSM data, started congestion capping, backwards-compatible and more robust map edits, two-way cycletracks, more cities imported, slurry of bugfixes and performance improvements
- September: full support for driving on the left, textured color scheme, rendering isometric buildings, editing traffic signal offsets, a big round of UI changes, infinite parking mode, trip purpose, alleyways
- October: unit tested turn generation, web version launched with async file loading, thought bubbles showing agent goals, slow parts of a trip highlighted, more UI overhauls, dedicated OSM viewer mode started, major simulation performance optimizations, major progress towards live map edits, automatically picking boundaries for arbitrary cities
- November: switched from Dropbox to S3, download new maps in-game, collision dataviz UI, day/night color switching, unit testing lane changing behavior, starting the 15 min walkshed tool, simplified simulation spawning code, recording and replaying traffic around a few intersections, refactoring to split out separate tools
- December: lane-changing fixes, blocked-by explorer in debug mode, non-Latin font support on web, saving player state on web, census-based scenario generation started, 15 minute Santa
- January: experimented with SUMO import, UI button overhaul, day/night mode, first separate cycleways
- February: better web loading and URL sharing, randomized parking, procedurally generated houses, actdev integration, geofabrik picker, new day theme, static routing penalties
- March: UK flow-based scenario generation, roundabout gridlock fixes, UI panel redesign, one-step OSM importer with UI, elevation data & layers
- April: pathfinding by roads, editing number of lanes, risk exposure, Tempe intersection consolidation
- May: GMNS signal timing import, cloud map importer, OSM turn lane fixes
- June: performance, first dynamic vehicle lane-changing, exiting driveways off-sides and across multiple lanes
- July: pathfinding refactor, Broadmoor blog post, mode shift tool, massive intersection consolidation breakthrough, deduplicating cycleways in OSM, bike lane separators, new day mode colors
The A/B Street "Almost" Postmortem
This was written September 2021, originally meant as a project postmortem. (Spoiler alert: we're still alive and kicking)
- Technical accomplishments & challenges
- Design accomplishments and challenges
- Project management
- The problem
- Epilogue
Technical accomplishments & challenges
The map model
To support a traffic simulation, A/B Street's map model isn't just a graph. It represents the physical geometry of roads and intersections and includes land-use semantics, like estimates of residential units and commercial spaces within each building.
One thing that's surprising to people with a GIS background is how from-scratch everything is. There's no QGIS, Leaflet, PostGIS, or map tiles. The map is just a single file with simple data structures and a clipped study area.
Render OSM in gory detail
OpenStreetMap represents streets loosely as a graph, with road center-lines and a pretty free-form key/value tagging system. It was designed for ease of mapping certain features, not for maintaining data quality, representing roads as physical space, or describing semantics of movement along the transportation network.
But A/B Street needed lots of this, and OSM is the most enticing data source available, so I wrote aggressive heuristics to extract meaning from the formless chaos. Perfect results are unattainable, but I'm quite proud of how far it's come and how robust it is to most cities I've imported.
- transforming road tagging into lanes
- The tagging schema described by the OSM wiki is complicated to begin with. But real mapping still diverges from this. I wound up fixing many discrepencies in Seattle, and made a dedicated tool to help other mappers validate their work.
- Because of A/B Street, I've mapped OSM tags that're just proposals or not widely used -- like street parking and cycleway:separation.
- Creating geometry from roads and intersections
- I believe A/B Street has the most advanced handling of complex OSM intersections of anything that's public
- OSM doesn't directly encode what movements are possible through each
intersection. A/B Street generates this for vehicles and pedestrians with
aggressive heuristics.
- OSM turn lane tagging is often flat-out wrong (not matching the lane count) or broken when ways are split before an intersection
- OSM has turn restriction relations that can span multiple road segments. This impacts graph pathfinding and traffic simulation in subtle ways.
- OSM includes parking lots and aisles, but A/B Street needs to know capacity, which is rarely mapped. So it procedurally generates individual stalls fitting the geometry.
- A traffic signal is just a node in OSM -- or worse, a bunch of individual
nodes for a complex junction. There's no way to describe its timing.
- A/B Street has reasonable heuristics for grouping movements together in stages for many different shapes of intersections. (I never did much work on automatically improving the timing, though.)
- I invented a JSON interchange format referencing OSM IDs to describe signal configuration.
- I worked with Dr. Xuezong Zhou's ASU group to import GMNS signal timing and match the movements to A/B Street's representation.
- The city of Seattle has still yet to release any public data about how signals are really timed, so for a while, I was manually mapping them with a notebook and stopwatch, and even convinced a few other people to join. (Of course this was futile; most interesting intersections depend on actuators, which can't be observed directly.)
- Built pathfinding into the map model for vehicles and pedestrians.
- Funded the creation of a new Rust contraction hierarchy library to achieve the performance necessary for a traffic simulation
- Some complex features: responding to map edits (that might reverse roads, close things off to some vehicles), handling complex turn restriction relations, modeling private neighborhoods and streets with no through-traffic, turning left or right out of a driveway, and elevation-aware cost functions for vehicles, pedestrians, making unprotected turns, etc
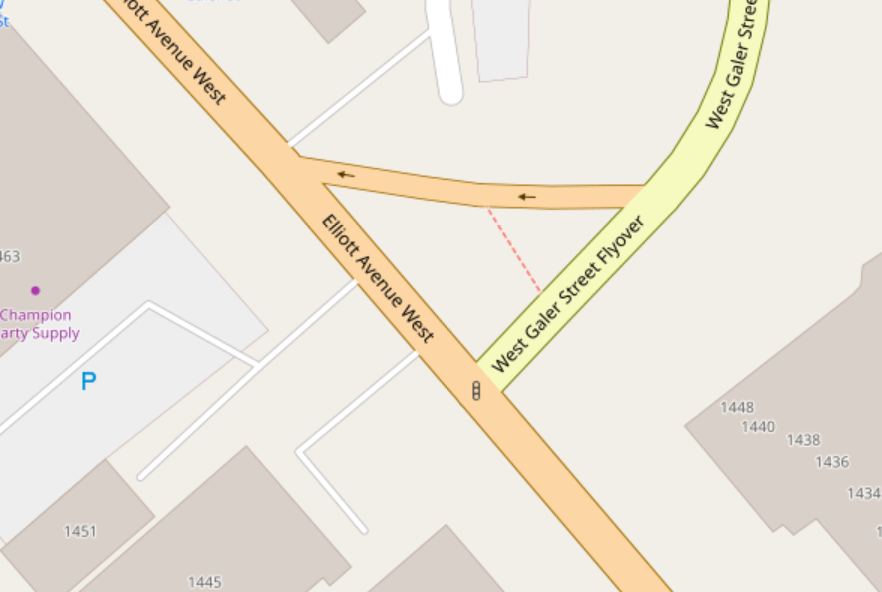 Do you have any idea what's on these roads?
 A/B Street shows the bus lanes and guesses road
width.
A/B Street shows the bus lanes and guesses road
width.
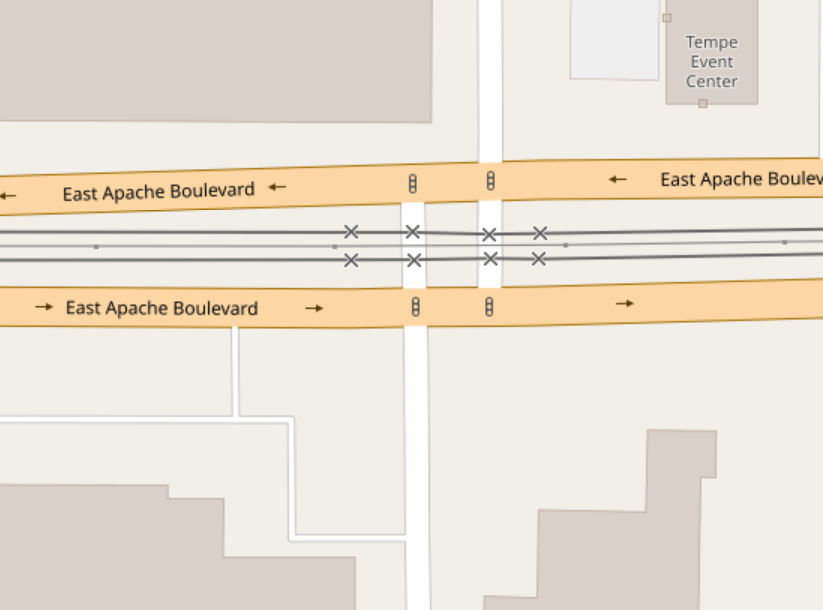 An arterial road with light rail crosses a minor
road in OSM
An arterial road with light rail crosses a minor
road in OSM
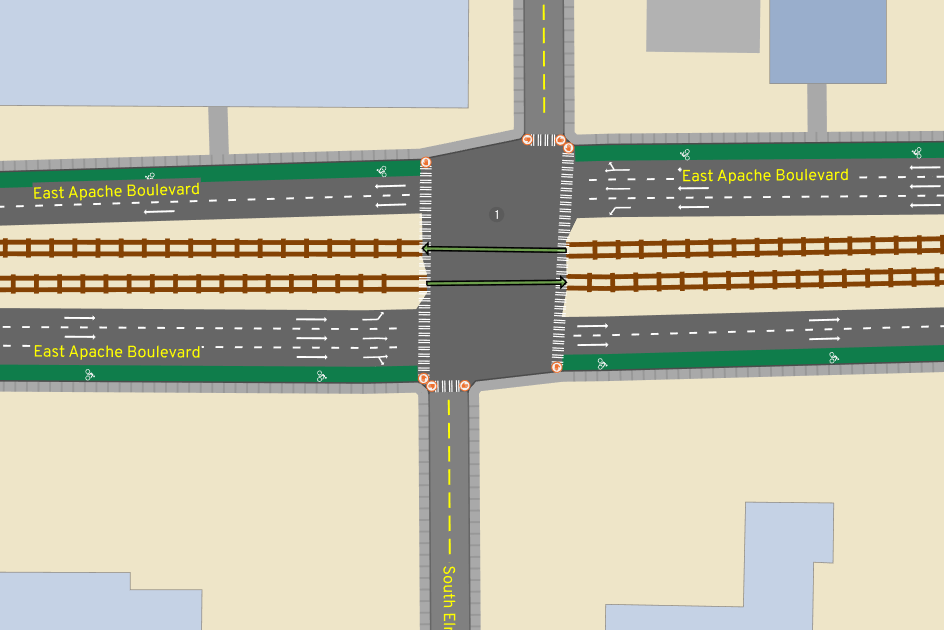 In A/B Street, one consolidated traffic signal
represents this situation
In A/B Street, one consolidated traffic signal
represents this situation
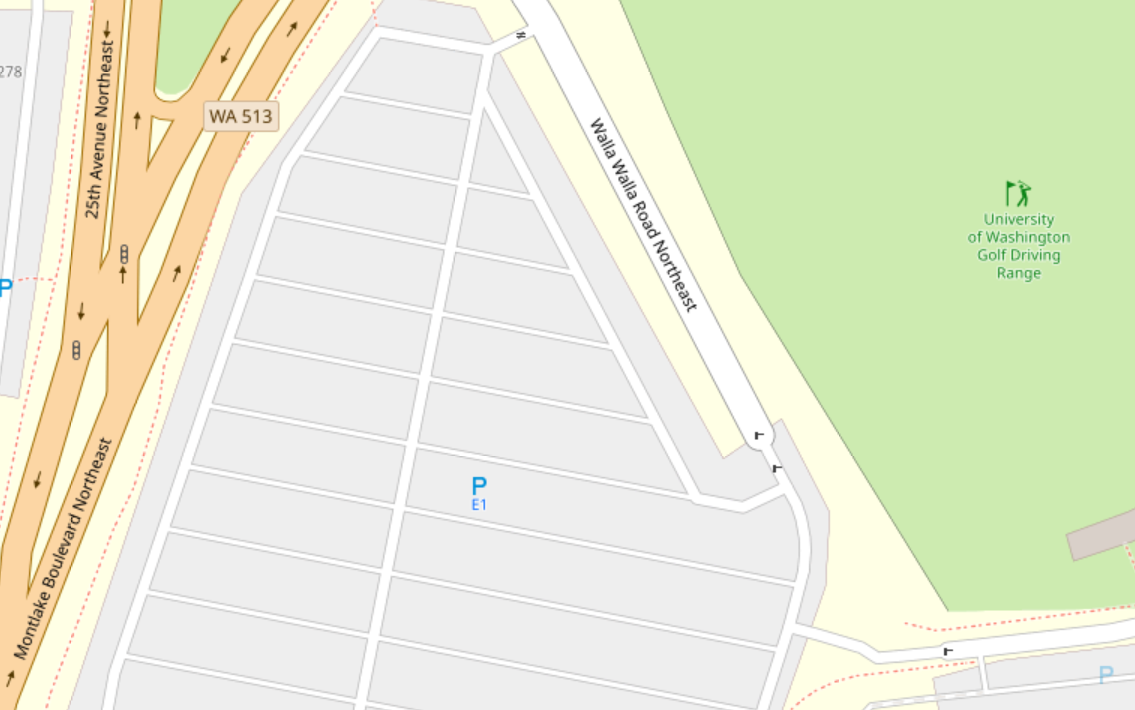 A parking lot in OSM
 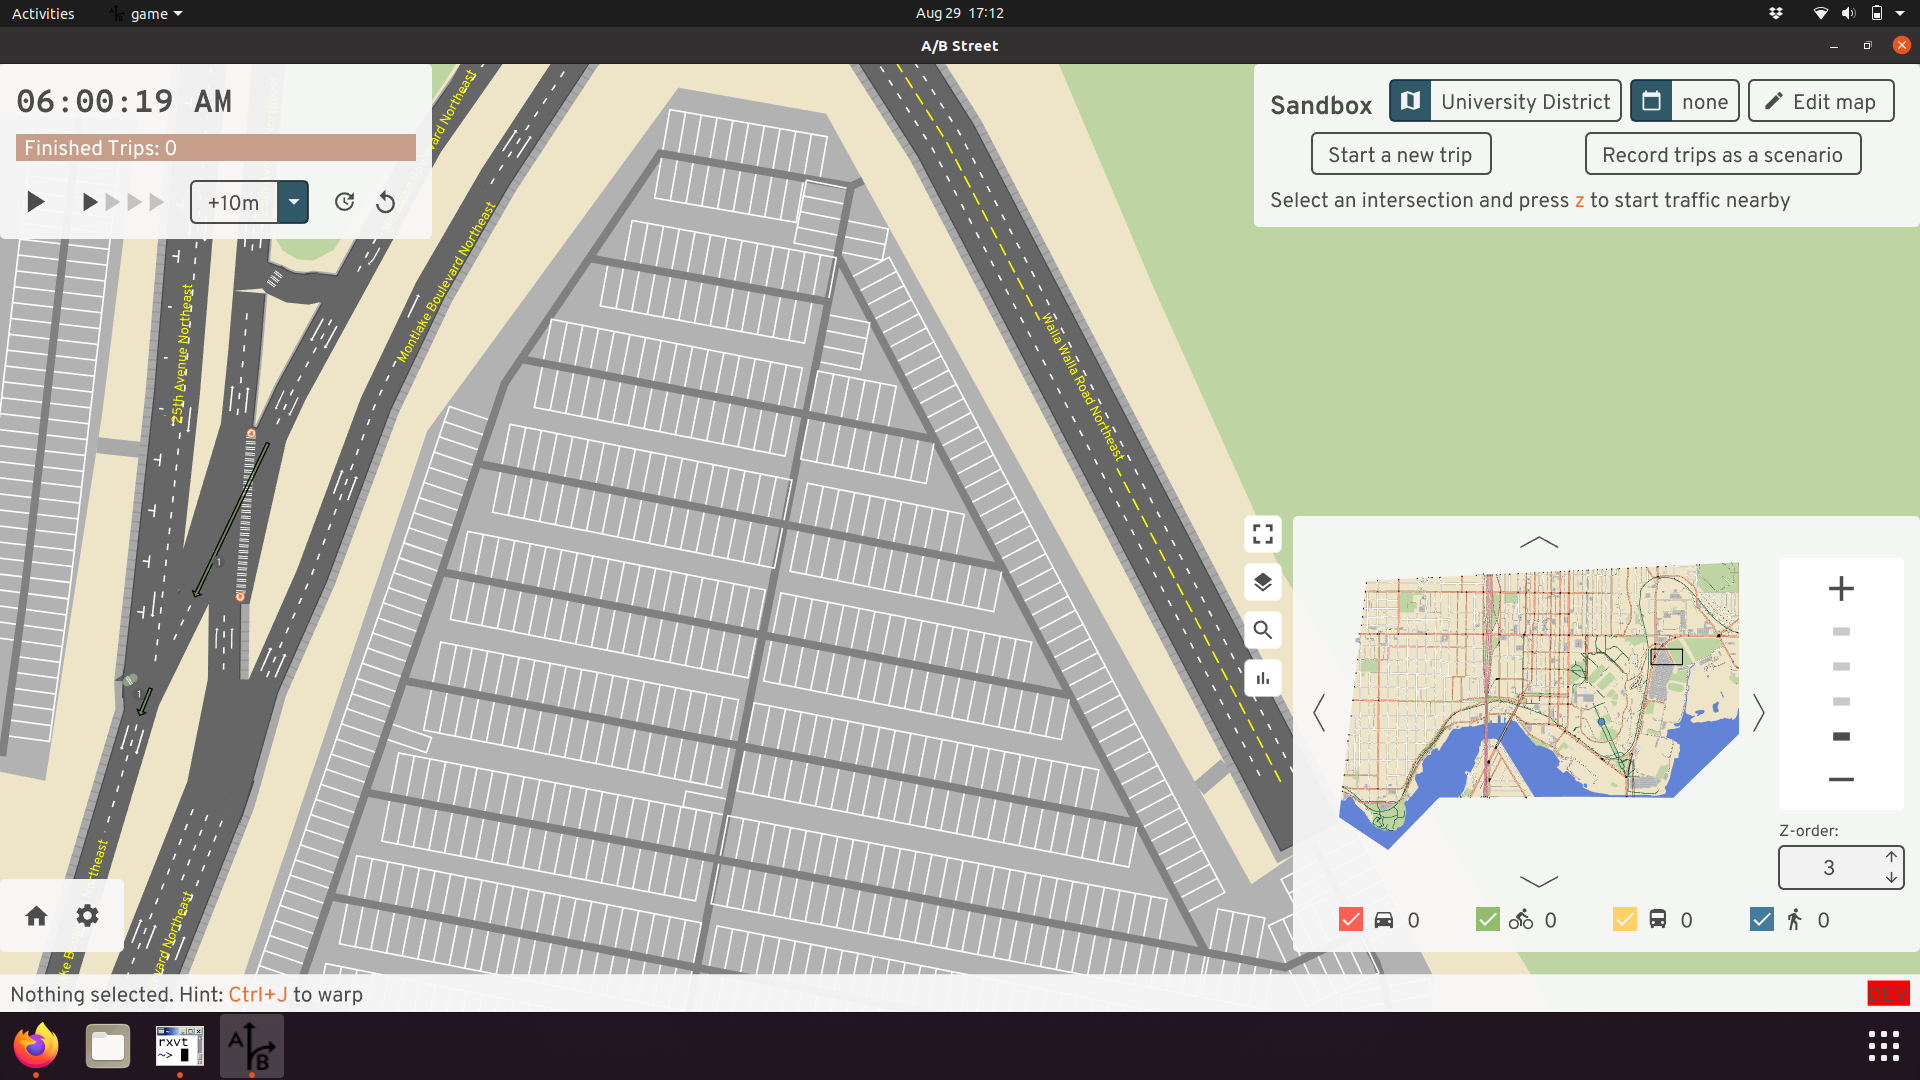 The
same lot in A/B Street -- 1500 spots, based on geometry
The
same lot in A/B Street -- 1500 spots, based on geometry
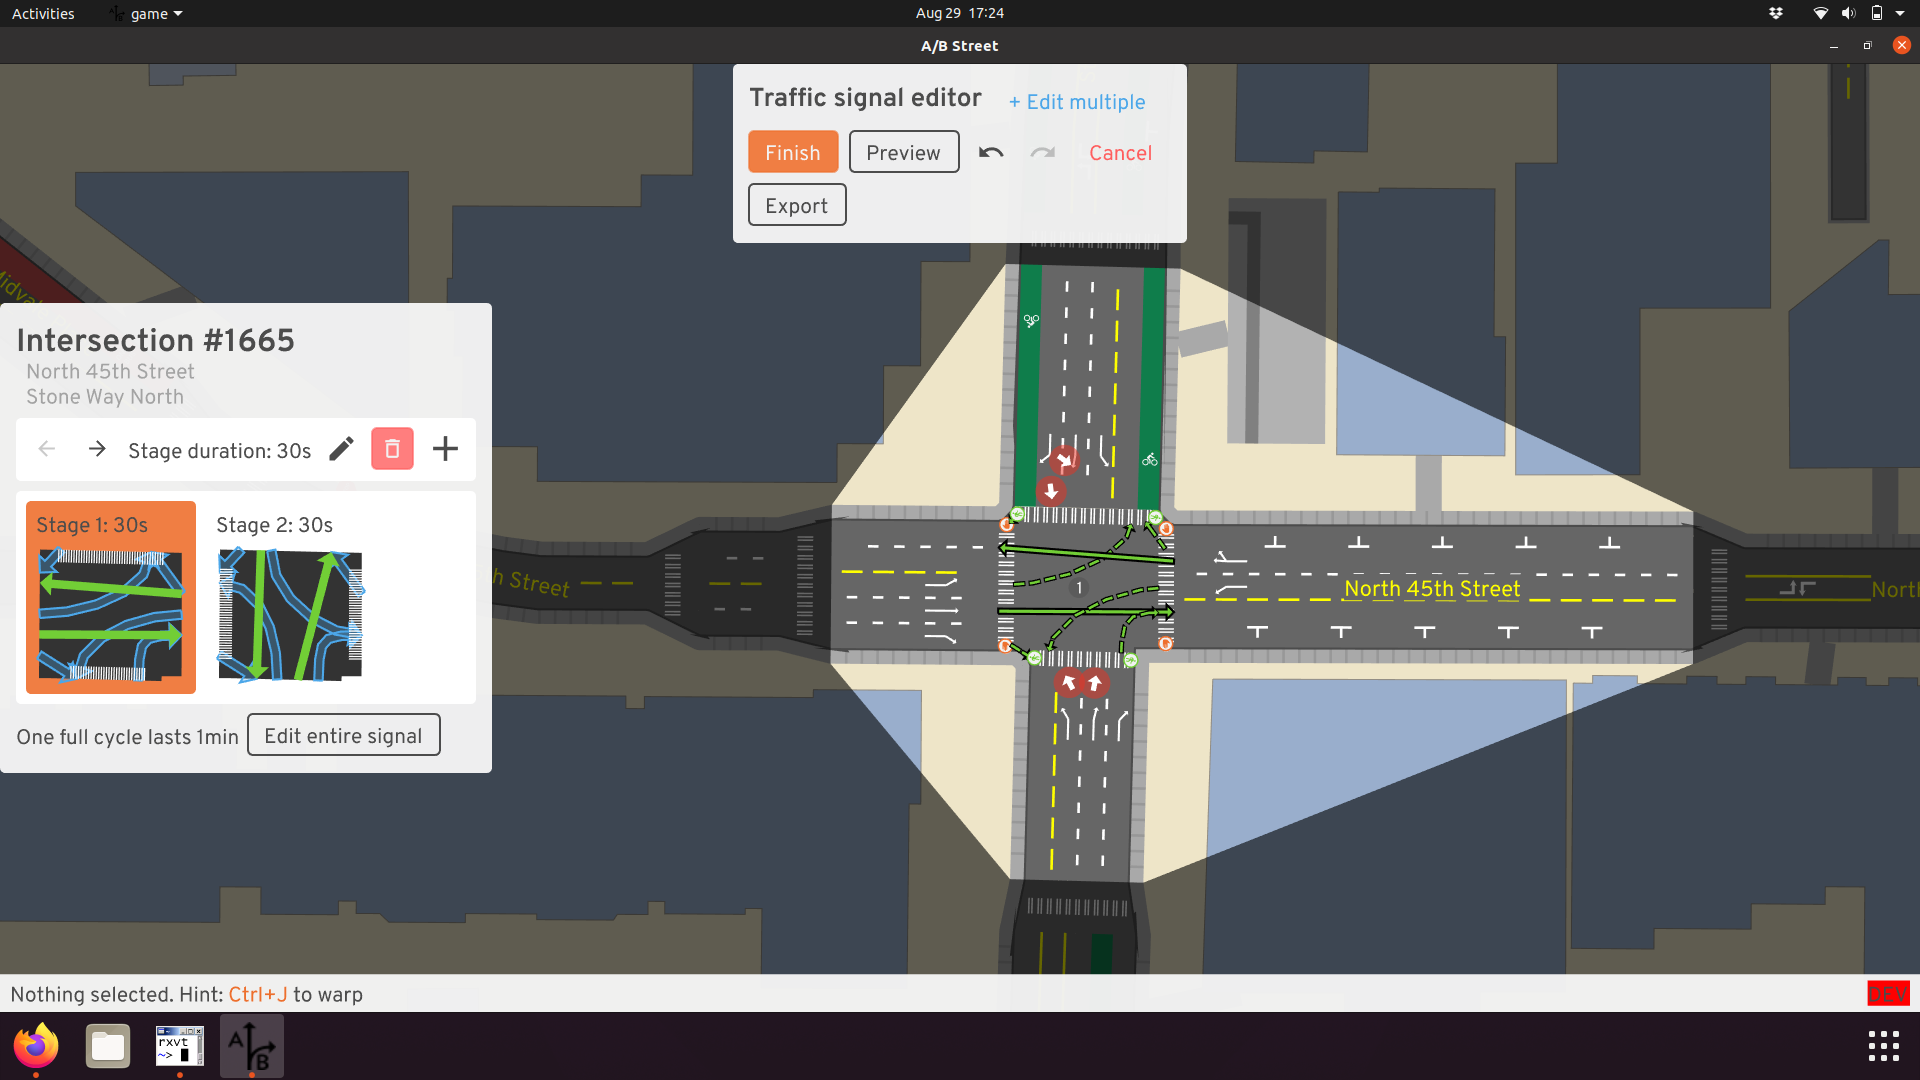 Is turning traffic backing up here?
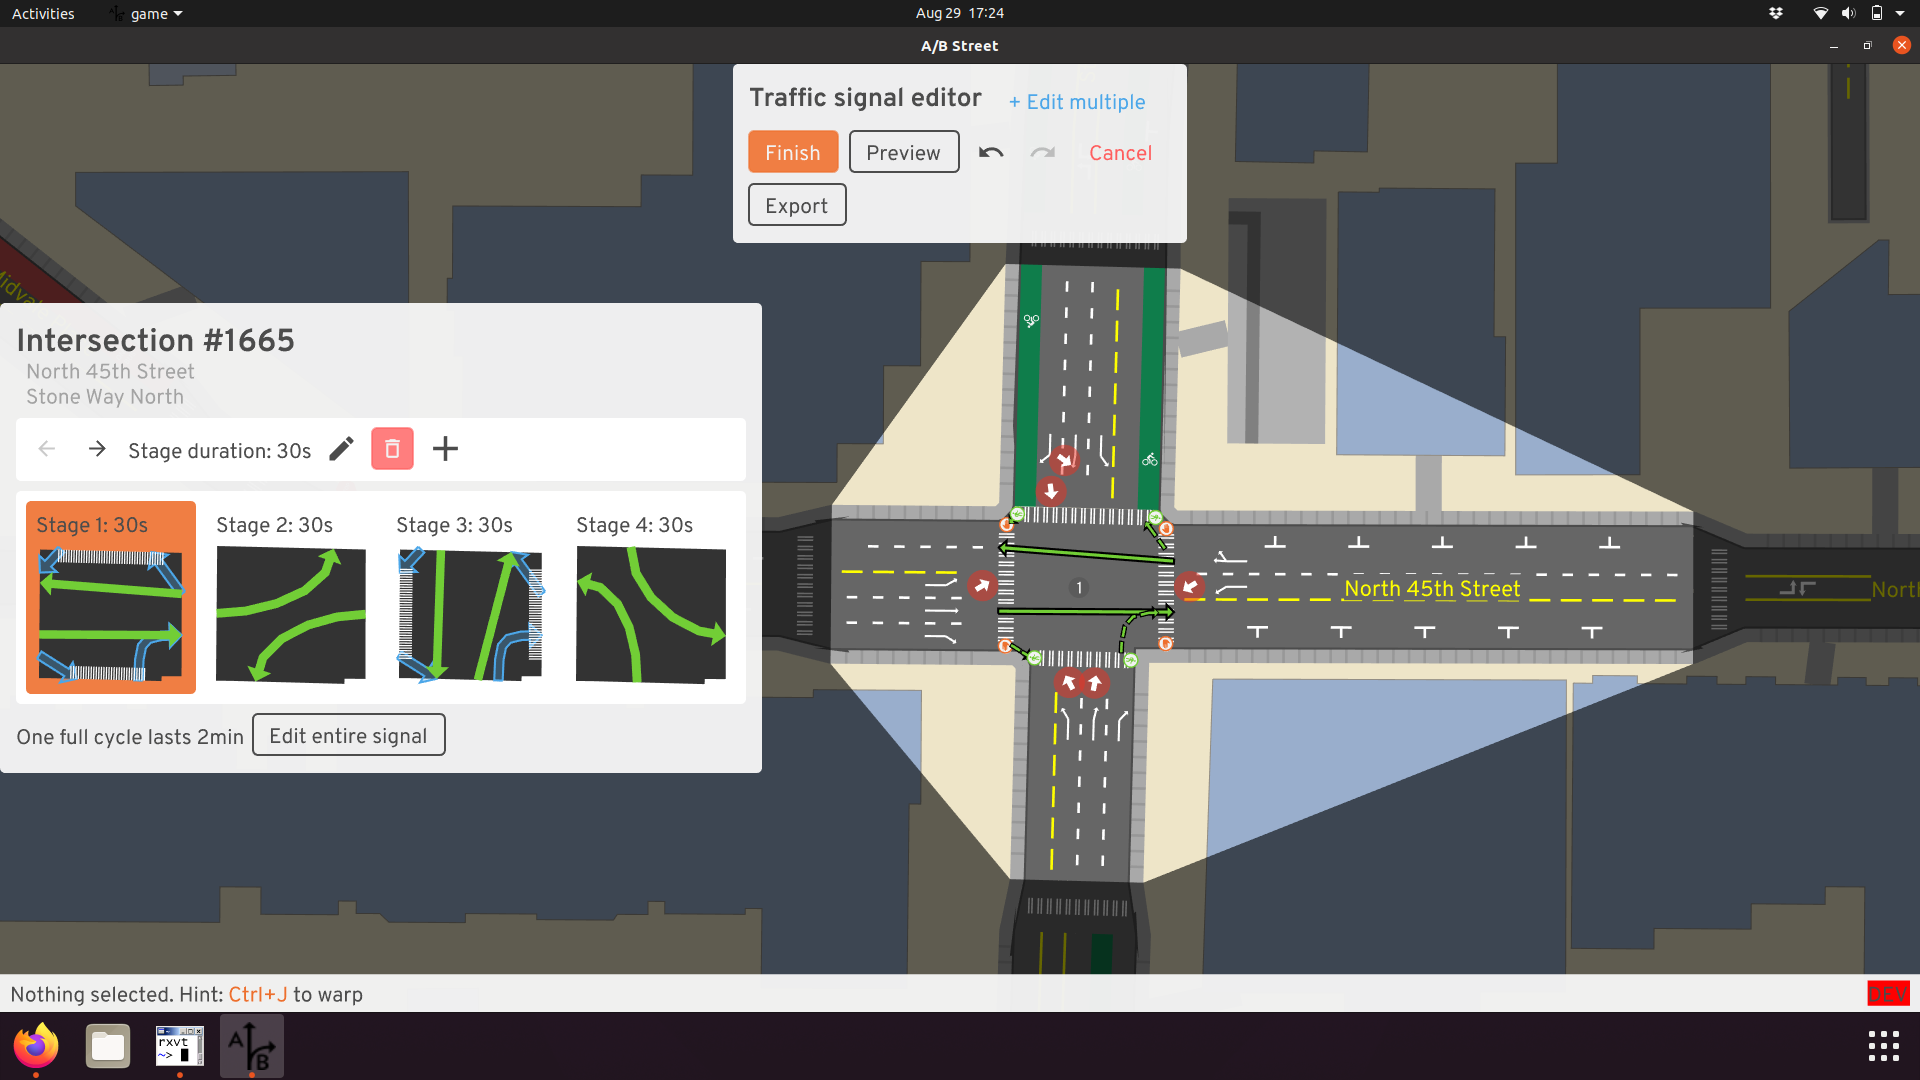 Add some protected left turns!
Joining data sources
A/B Street brings in other public data for some cities, joining it with the OSM-based map model.
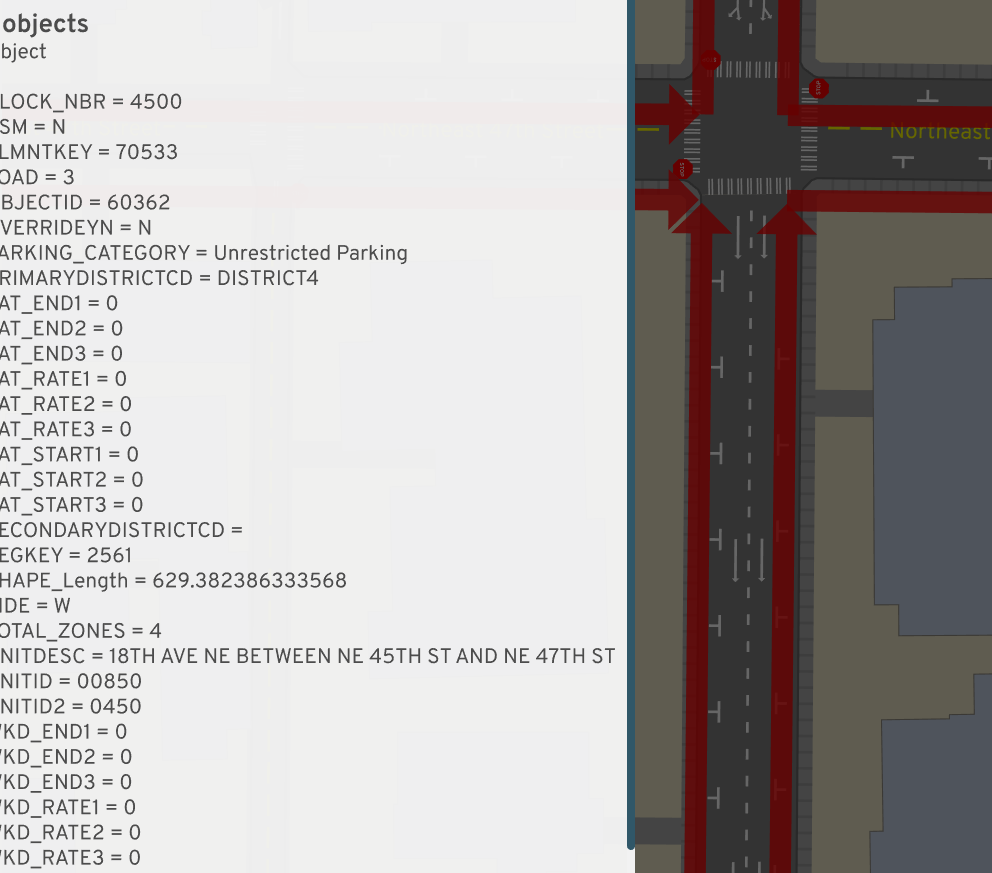 Blockface data in Seattle describes street parking
restrictions... in theory. Many segments disagree with OSM's splitting of roads,
and many blocks have incorrect data.
Blockface data in Seattle describes street parking
restrictions... in theory. Many segments disagree with OSM's splitting of roads,
and many blocks have incorrect data.
 LIDAR elevation data overlaid with the bike network
shows why Aurora would be such a nicer route to bike north from downtown than
Fremont
LIDAR elevation data overlaid with the bike network
shows why Aurora would be such a nicer route to bike north from downtown than
Fremont
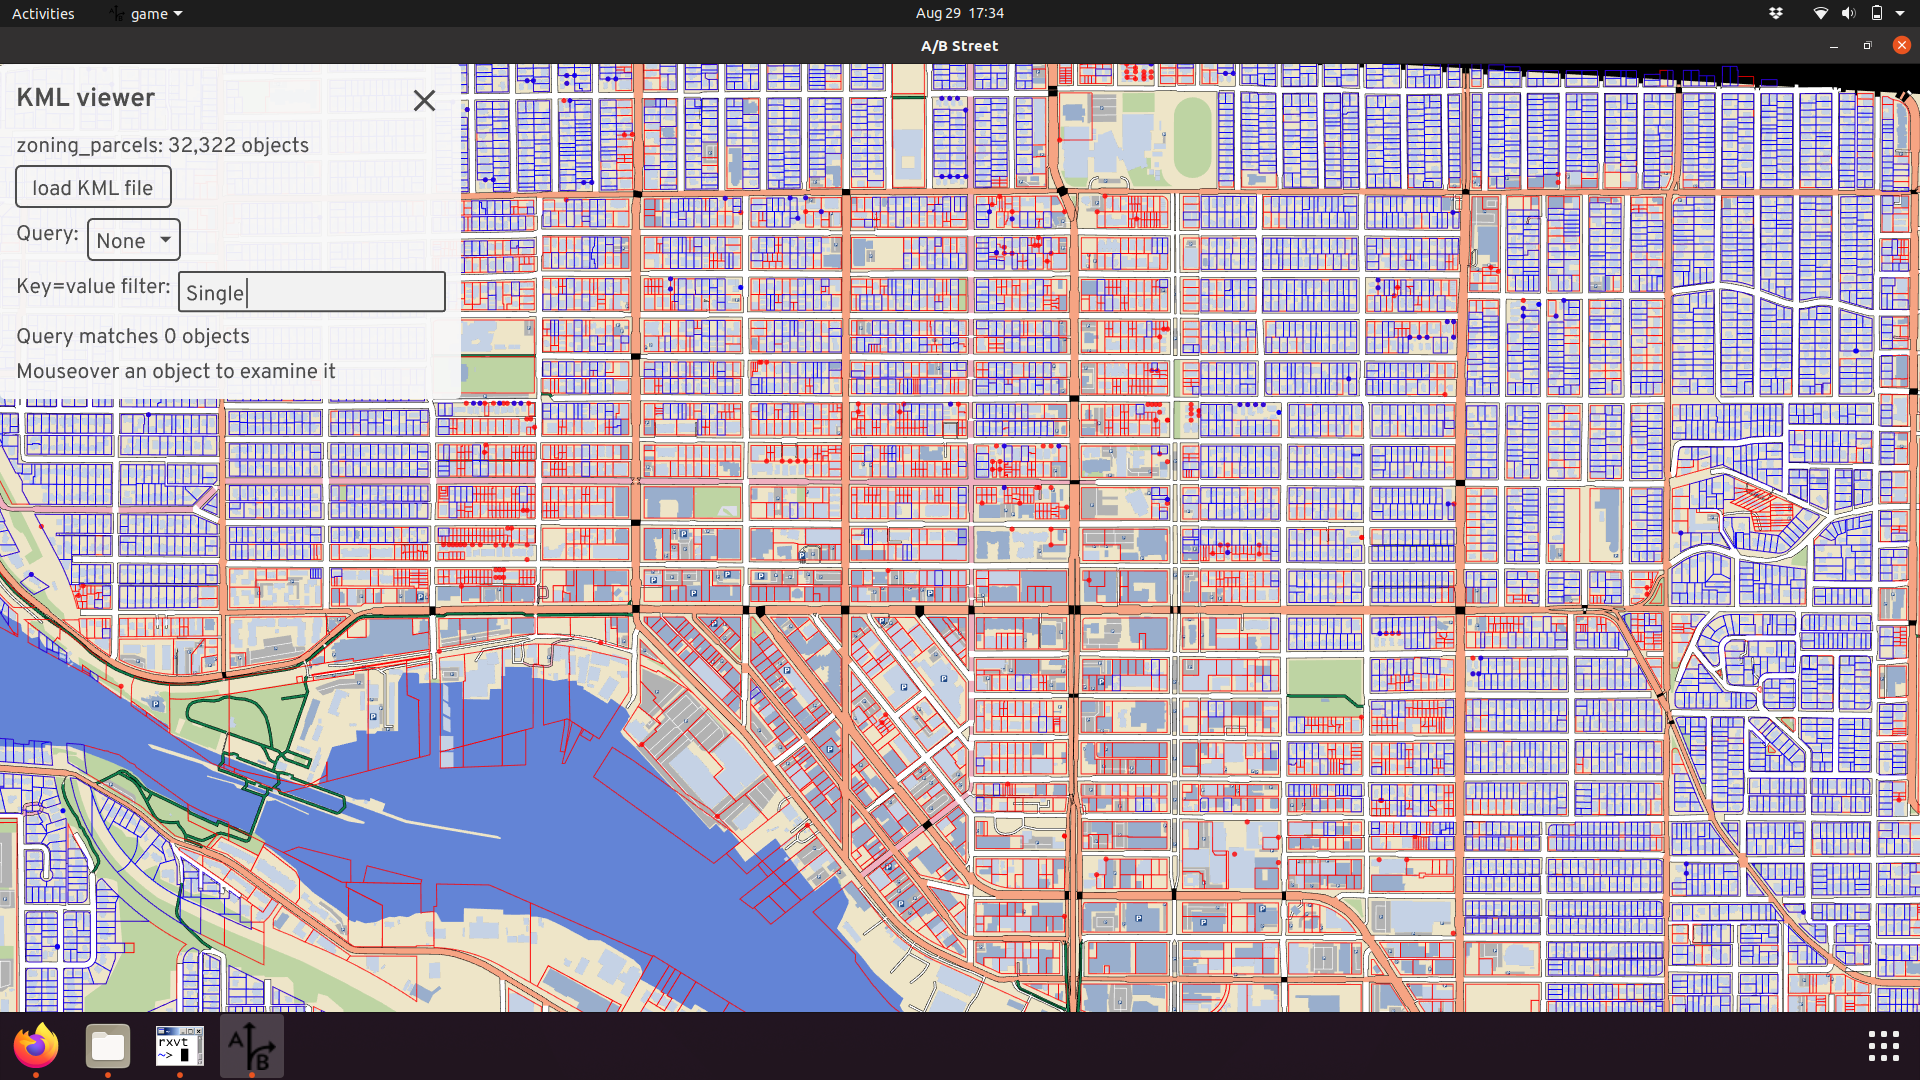 The sad blue sea of single-family parcels, from King
County parcel data
The sad blue sea of single-family parcels, from King
County parcel data
Map editing
It would be so simple if that map model representation was nice and immutable. But the whole point of A/B Street is to explore changes to the built environment. Aside from the UIs for this (which themselves went through many design iterations and usability studies), supporting this in the map model layer has been tough.
- Representing edits durably, even when a map is rebuilt from updated OSM data.
- Handling undo/redo. When you change the lanes of one road, it might invalidate the traffic signal policy nearby.
- When you widen or shrink a road, it affects intersection geometry. Especially when that intersection has been consolidated from several in OSM, there are some edge cases...
- Applying edits has to be fast -- jokes on loading screens are hard to write!
The map importer
At first, I was just importing a few parts of Seattle, so running a little tool was fine. But as word of the project spread, of course people wanted to see it in more places. (And in fact, the most solid audience for the project has been the OSM community -- mappers tend to already be very invested in OSM as a hobby, so they're willing to get past any clunky UX hurdles in order to play with something cool!) By now, I'm importing ~130 maps from ~80 cities. Anytime I update the OSM import code, I've committed to regenerating everything and at least not totally breaking a city!
I've only barely managed to stay on top of this growing scale. My faster laptop died for a few months and I scrambled to parallelize the import process in the cloud just to survive. Something that I haven't solved is expressing the complex importing process as a proper pipeline. Ideally it's a DAG of tasks depending on each other, with clear logging, progress tracking, parallelization, and error handling. One reason this is hard is expressing which parts of the graph to invalidate and recalculate. Should we grab new upstream OSM data? Just recalculat scenarios, leaving the maps alone? Only re-run one stage of the map import?
I'm pretty happy with how easy it is to import a new city. Originally you had to email me a boundary or compile the project yourself, but now the UI just asks you to draw a GeoJSON boundary, uses Overpass to grab fresh data, and runs the importer for you.
Software engineering
Testing
A huge challenge to maintaining maps over time is not breaking things, either from my own importing code or when grabbing new OSM data upstream. Writing tests to guarantee some kind of invariants in the map model layer (like no two roads overlapping each other, no disconnected bits of the graph, minimum road length, etc...) was something I wanted to do, but all of those are pretty impossible targets to meet with the messiness of OSM data. So I settled on regression tests and manual tool-assisted diffing. Screenshot diffing is one trick -- inspect an imported map once, take screenshots of it, then later compare to manually validate changes. There are also tests that re-run a full traffic simulation on maps known to work. They ensure gridlock isn't re-introduced, that overall travel time patterns don't change radically, etc.
There aren't tons of unit tests. Usually expressing the input and expected output for any of the interesting problems is just too hard manually. There are some hybrid solutions, like generating turns at an intersection. The input (a map's roads) isn't easy to understand by looking at some text encoding, but viewing in the UI is. Likewise, a human can't glance at output like "left turn from lane #5 to lane #84" and hope to understand it. But we can store the text output as goldenfiles and, when there's a diff, again use the UI to inspect the change.
Releases
At my previous job, there was quite a bit of hassle maintaining a production service without downtime. It was initially very freeing to just write software quickly without worrying about breaking people, but of couse that didn't last long after I started releasing public builds every week. The release process is mostly automated.
At first, I just shipped all map and scenario data with the .zip releases and bundled this in one big .wasm blob (yes, really). Of course this didn't scale as we increased the number of imported cities. So eventually I made the UI download each city only when needed. This required versioning the data -- the code in a release from weeks ago is probably binary incompatible with the current map data.
Originally I just threw all the files in my personal Dropbox, but moved to S3 at some point (every single public file in Dropbox needs its own URL, and I broke the Python tool spamming it with requests for hundreds of files...). I really wanted to just re-use some existing tool to sync with S3 (both for me uploading and for people downloading), but never found anything that met all my needs -- cross-platform without system dependencies, grouping files into per-city data packs, gzipping. So I rolled my own updater.
I'd still love to conceptually use real version control; maybe Git LFS is worth another try.
Simulation
Discrete event traffic simulation
Read the full article.
Although there's lots of academic papers out there describing car-following models and other "microscopic," agent-based traffic models, it's always seemed to me that they omit details about how to actually implement them. So, I rolled my own. Not claiming this is a good approach -- simulation results have to be met with much more skepticism -- but I'm very proud of the model.
A/B Street simulates the movement of individual people walking, biking, and driving. It doesn't do so in fixed time-steps (every 0.1 seconds, update everything). It uses a "discrete event" approach. Each agent is in a state, like traveling along a lane or waiting at an intersection, for some amount of time. Updates only happen when that state possibly transitions to another one, like when a vehicle reaches the end of a lane or a traffic signal "wakes up" people on a green light. Instead of updating every agent every 0.1 seconds, we just "skip ahead" to the next interesting time, per agent.
Actually making this work with on-demand rendering at any moment in time is one of the more clever things I've come up with. The model is quite fast (until gridlock happens...) and looks reasonably realistic in aggregate. Things like smooth acceleration are missing, but few people have seemed to notice. Making vehicles change lanes and over-take is one of the main limitations -- this is very hard to squeeze into the discrete event model, and only half-done.
 Drivers, cyclists, and pedestrians negotiate the traffic
signal at Greenwood and N 87th
Drivers, cyclists, and pedestrians negotiate the traffic
signal at Greenwood and N 87th
Parking
Some traffic simulators out there are only focused on highways, not even inner-city driving. Many don't include pedestrians and cyclists, or bolt them on as an after-thought. But I'll bet A/B Street is one of the only ones including a detail crucial to the experience of driving: parking. How many times have you heard a friend complain that it took 10 minutes to drive over, but 15 to find parking? Exactly.
Except in some maps that disable it, every driving trip in A/B Street begins and ends with somebody walking between their actual endpoint and a parking spot with their car. There's lots of estimation with the capacity along streets, in parking lots, and especially with private residences and businesses, but at least A/B Street tries. Maybe this pushes the rest of the field towards a bit more realism. Abstractions matter! Parking occupies a huge amount of space, and when your phone says driving somewhere is 20 minutes faster than taking a bus, it may not be giving you the full picture -- are you sure you won't circle around a dense neighborhood for 10 minutes finding that free spot? Abstractions matter. I hope I've done justice to Donald Shoup.
 Darker red dots are
vehicles parked farther away from their final destination
Darker red dots are
vehicles parked farther away from their final destination
Gridlock
In both the real world and in a traffic simulation, vehicles get a bit stuck. In the real world, this is usually resolved by humans slightly breaking strict abstractions like usage of distinct lanes, slowly creeping into a partially blocked intersection, or deciding to detour around a problem last minute. I've had a hard time capturing that robustness in simulation, so well, in most simulations on larger maps, vehicles get stuck. Like, permanently.
This has so many causes -- broken intersection geometry causing impossible turn conflicts, weird lane-changing behavior, vehicles being too cautious about partially blocking an intersection, pedestrians darting into non-existent crosswalks, hilariously Byzantine traffic signal timing, travel demand models sending all 80,000 trips to UW campus to a single tiny building... and so I've dumped countless hours into trying to fix them, with only very modest success. Sometimes it's trying to fix the data, or improve signal timing heuristics. Sometimes it's building in complex cycle detectors into the simulation to figure out when vehicles in a roundabout are all waiting for each other. Sometimes it works. Usually it doesn't.
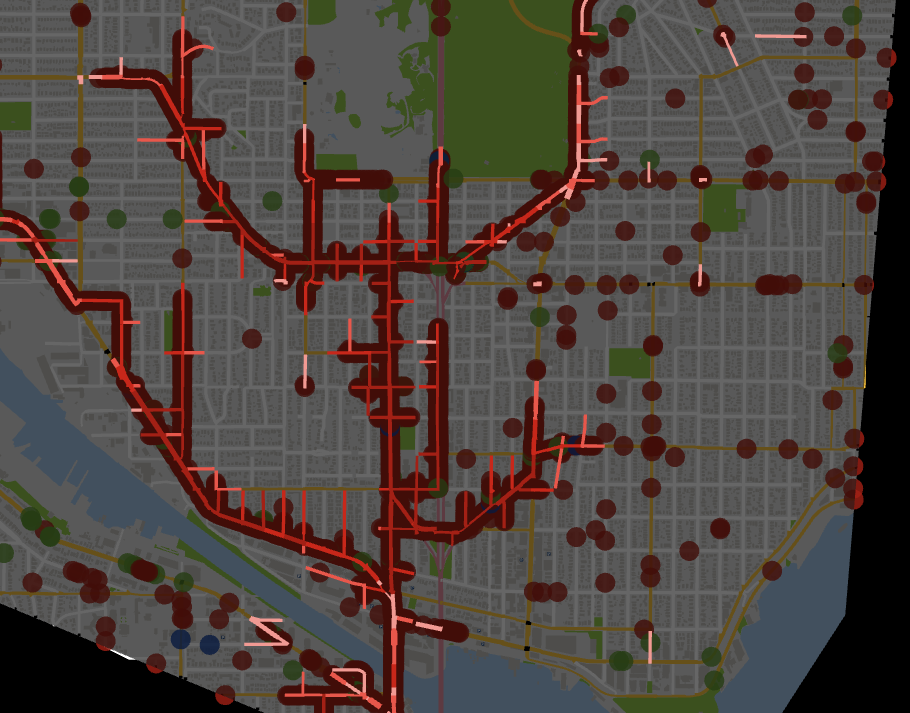 Traffic Seitan spreads from one broken Fremont bridge
Travel demand models
You can't run a traffic simulation if you don't know where people are going, when they're leaving, or how they're trying to get there. The naive approach of uniformly distributing some number of trips between all possible buildings is hilariously unrealistic. And the amount of complex modeling and specialized knowledge needed to properly do activity modeling or something simpler is overwhelming. I've tried as much as possible to punt on this -- importing Soundcast data for Seattle, relying on collaborators like grid2demand and abstr.
But inevitably, A/B Street has wound up with its own simple travel demand models. Mateusz started the proletariat robot model, using naught but OSM tags on buildings to estimate the number of people living and working, and using simple matching to send people to and from work, and nothing else. Such robots.
Then during the Actdev work, it became necessary last-minute to generate traffic using UK census flow data, which describes the number of people commuting between different polygonal areas for work, broken down by mode. The pipeline is simple.
We've also done a fair bit of work into data visualization to understand the outut of these travel demand models. Part of this even includes heuristics that automatically group buildings into "neighborhoods" -- roughly, tracing along arterial roads and finding everything in the middle.
 Where do trips starting from Broadview go, according
to Soundcast data?
Where do trips starting from Broadview go, according
to Soundcast data?
UI
widgetry: a UI + dataviz library from scratch
This is probably one of the more ridiculous things that's happened.
In ~2018 when I started, all of the rendering and GUI libraries for Rust appeared to not do what I needed. So I started with raw window event handling and OpenGL and... just went for it. It's not hard to start drawing a big slippy map with zooming and panning, nor is it tough to wire up a basic clickable button. But... widgetry has turned into something quite feature-full and has a decent API.
The journey there was quite circuitous. Most of the difficulty was not even knowing how the UI should work (or even having a clear picture of what the app was supposed to do...). But once Yuwen joined the project, this library started shaping up very quickly. And Michael has dumped in countless work into adding complex features to it, polishing the APIs and style, implementing massive design changes from Yuwen like the buttons...
The end result is pretty impressive -- it works on native and web (no system dependencies), everything's an infinitely scalable vector (including text), and it has loads of interactive dataviz widgets.
 A quick preview of interactive line plots, draggable
cards, and a canvas filled with vector goodies
A quick preview of interactive line plots, draggable
cards, and a canvas filled with vector goodies
Native and web
I never intended to target mobile or the web. But in January 2020ish, winit support for web landed, so I thought... why not? Initial support was surprisingly easy, but properly dealing with asynchronous file loading, loading screens, progress bars, and detangling native-only dependencies has been quite tough.
Design accomplishments and challenges
I think it's safe to say my own design skills are somewhat lacking:
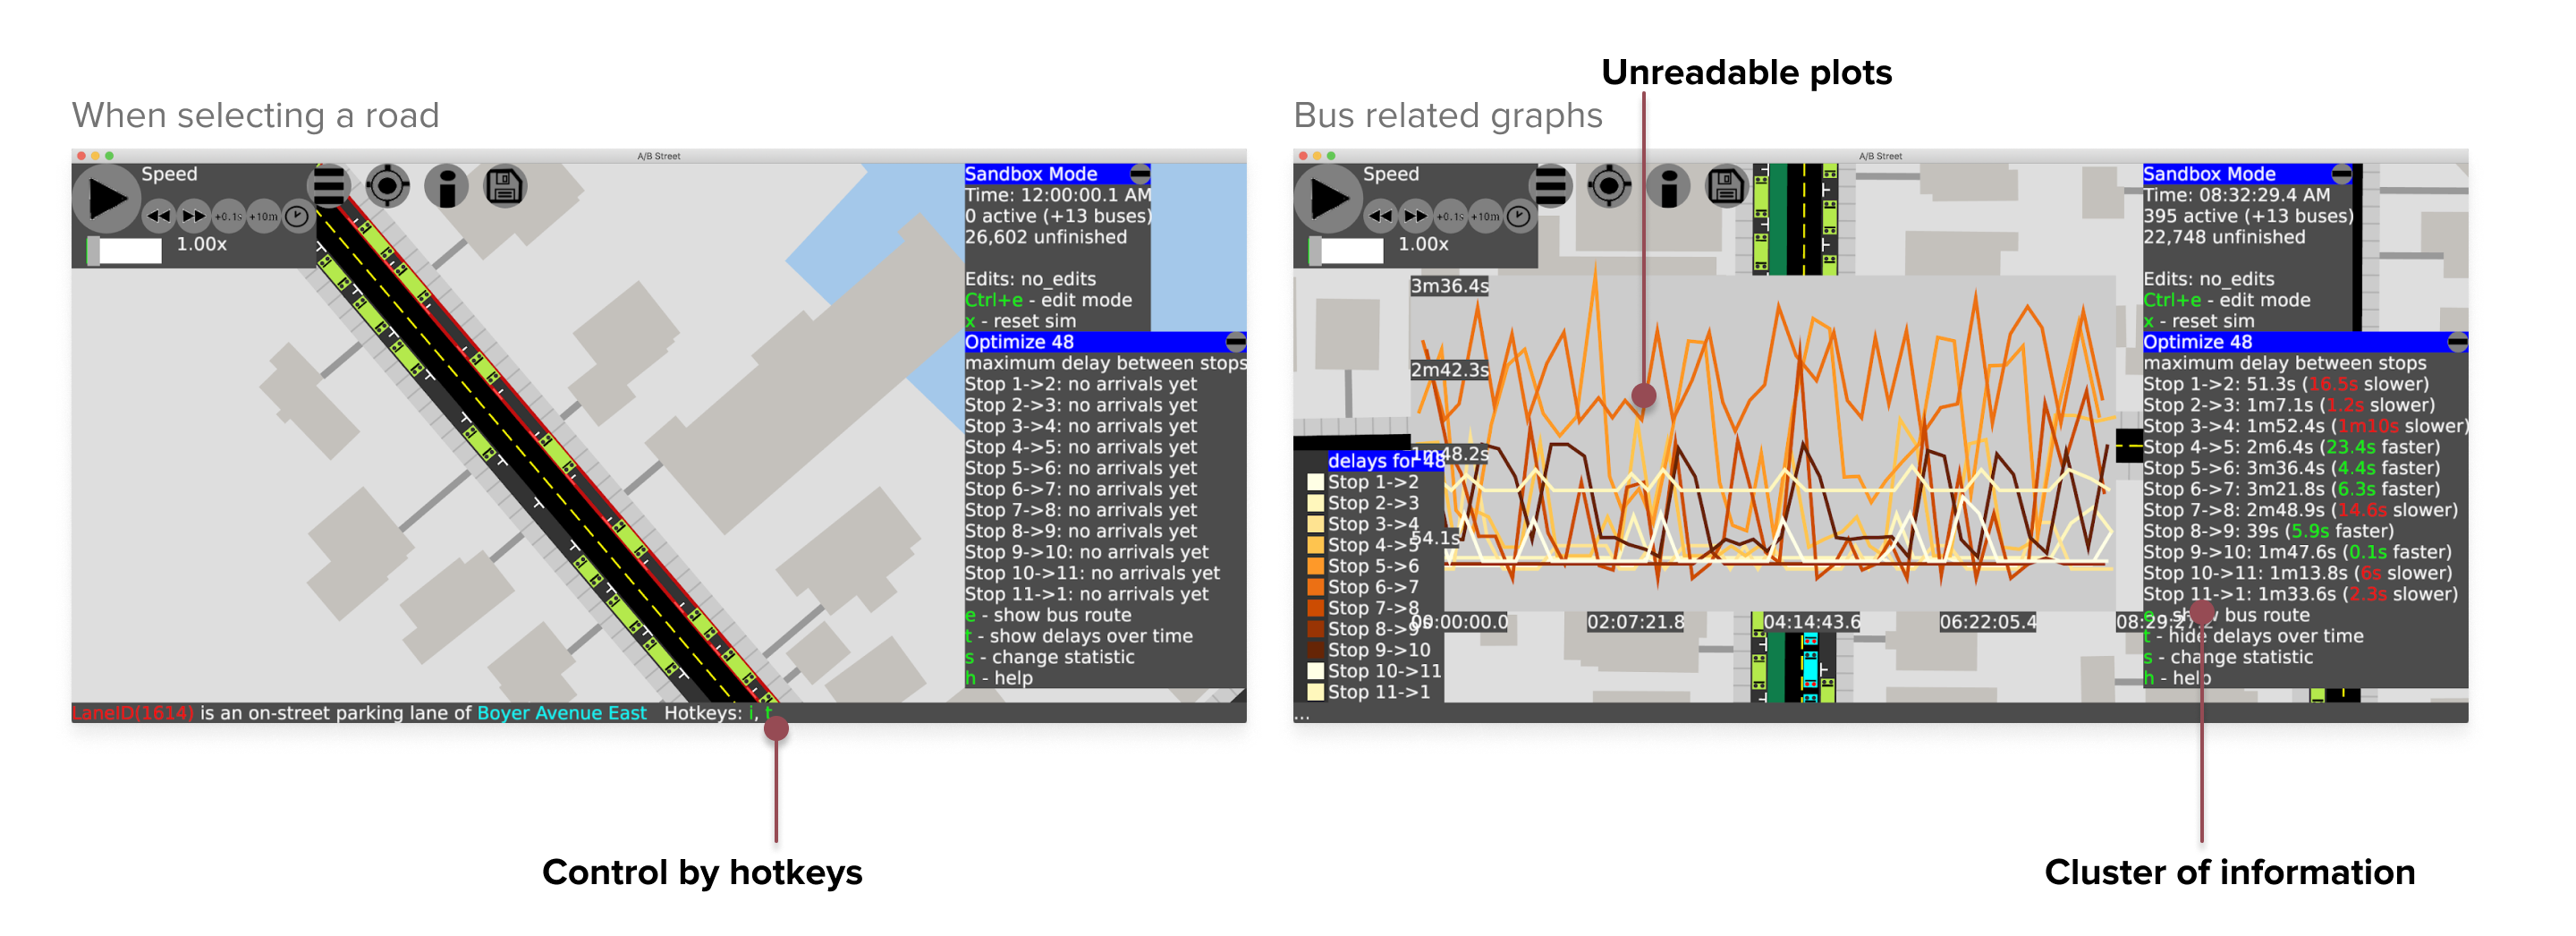 A/B Street as of September 2019
A/B Street has lots of complex information to convey and data to visualize, and getting people excited about a vision for a more sustainable transportation system requires beautiful design. So... it's quite awesome that Yuwen joined the project at the right time. Thanks to Michael and feedback from dozens of people from OpenStreetMap, Github, Twitter, and user testing studies, A/B Street today is quite aesthetic and functional.
Color schemes
One of the puzzles I struggled with from the very start was how to communicate both lane types and road types at the same time. Unzoomed, a simple color scheme distinguishes highways from major and minor roads:
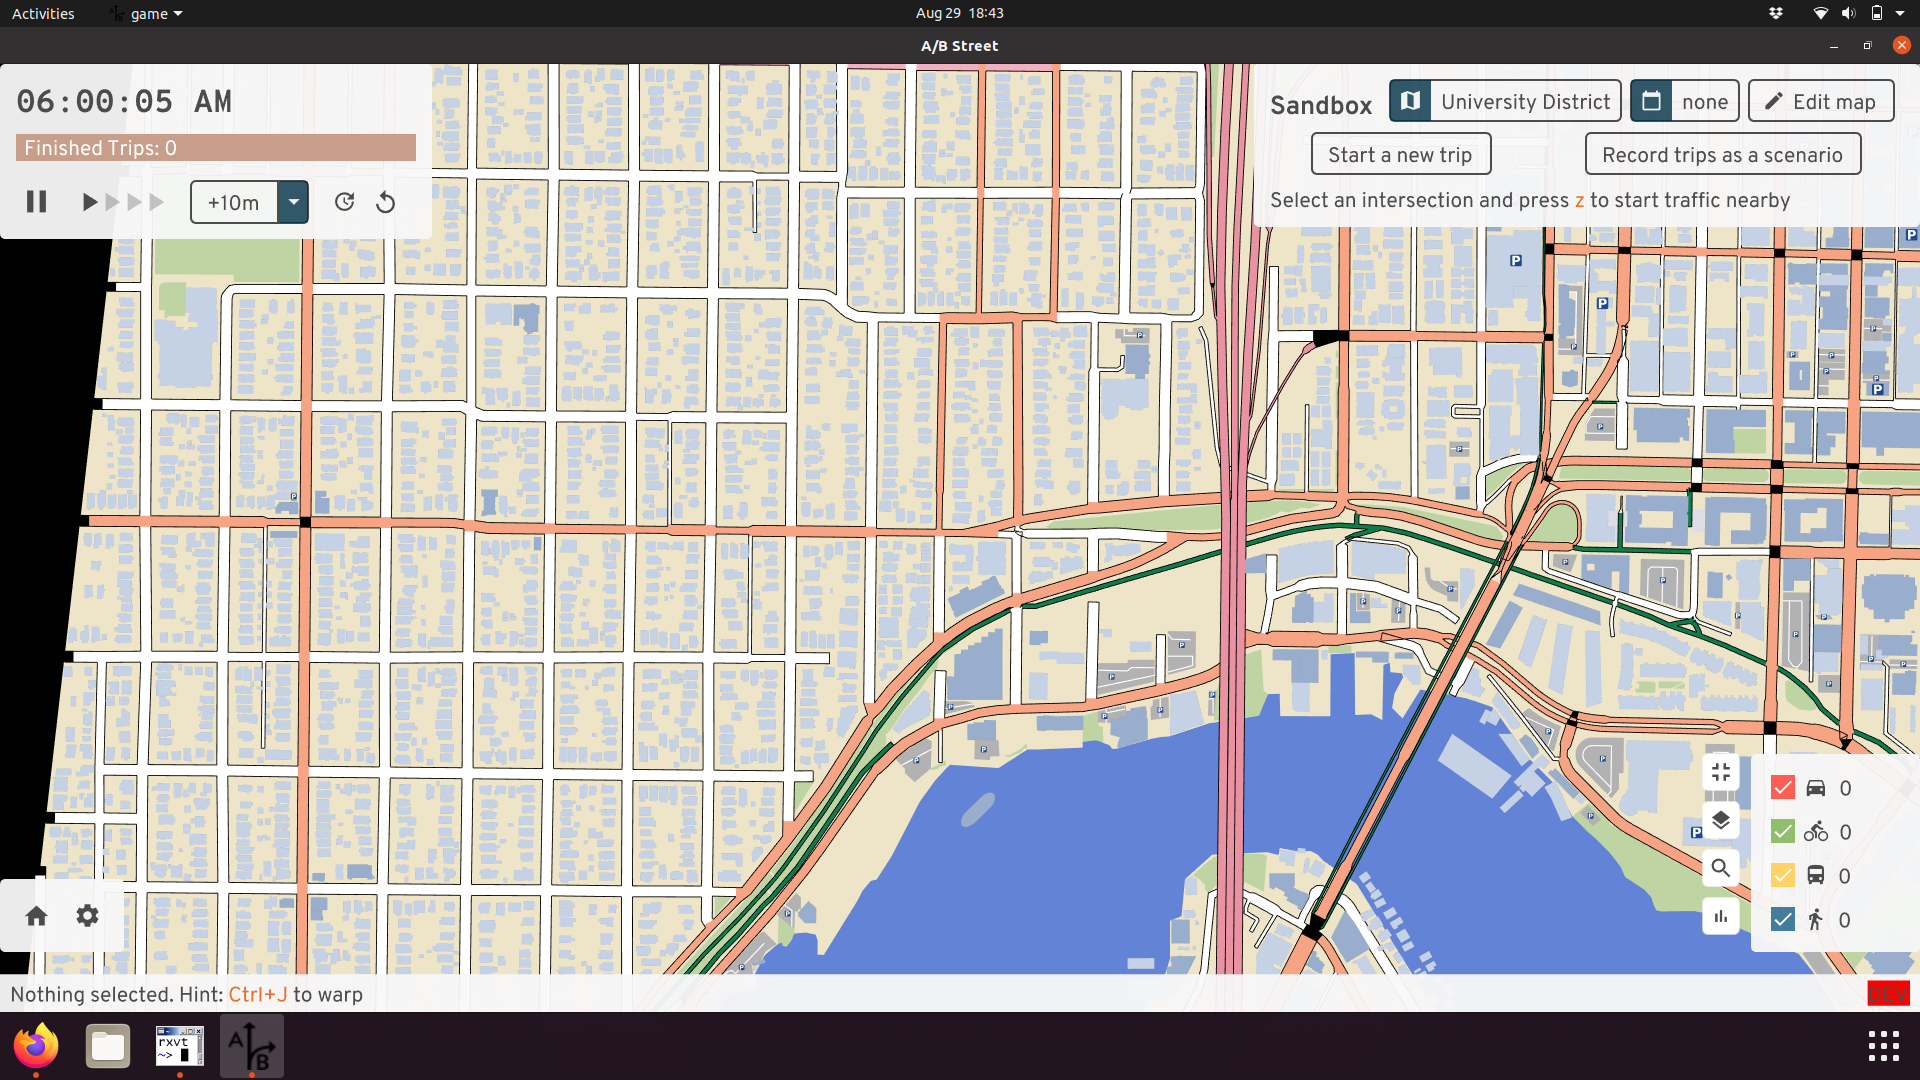 I5 is distinguishable from arterial and residential
roads in Seattle, and the Burke Gilman trail is also visible.
I5 is distinguishable from arterial and residential
roads in Seattle, and the Burke Gilman trail is also visible.
But zoom in, and we use coloring to distinguish regular lanes, parking, and sidewalks. It's still useful to distinguish major and minor roads, though! Most maps cheat with road width and use that, but there are many cases where arterials are just as wide as residential streets.
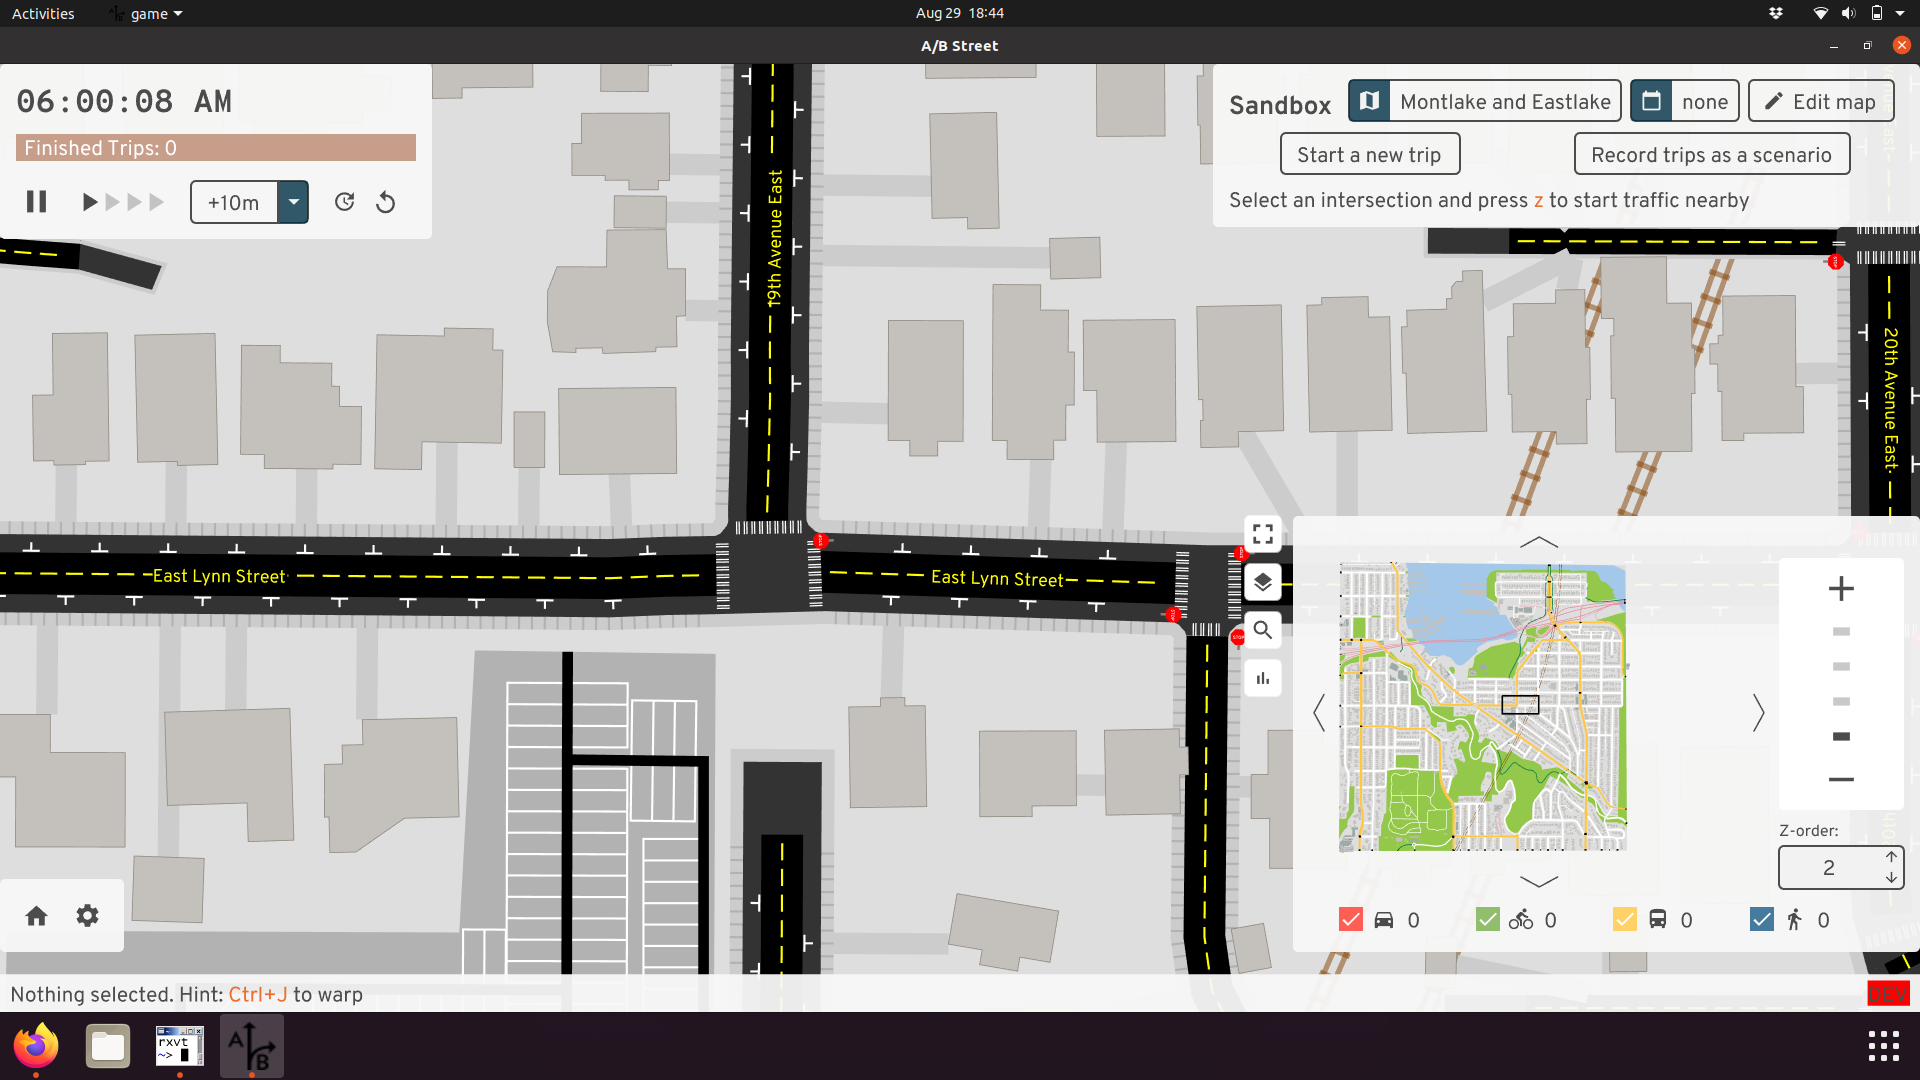 Can you spot the arterial?
But inspired by designs from Streetcomplete by Tobias, we found some shades of grey that convey the difference quite effectively, as well as slightly convey the curb height:
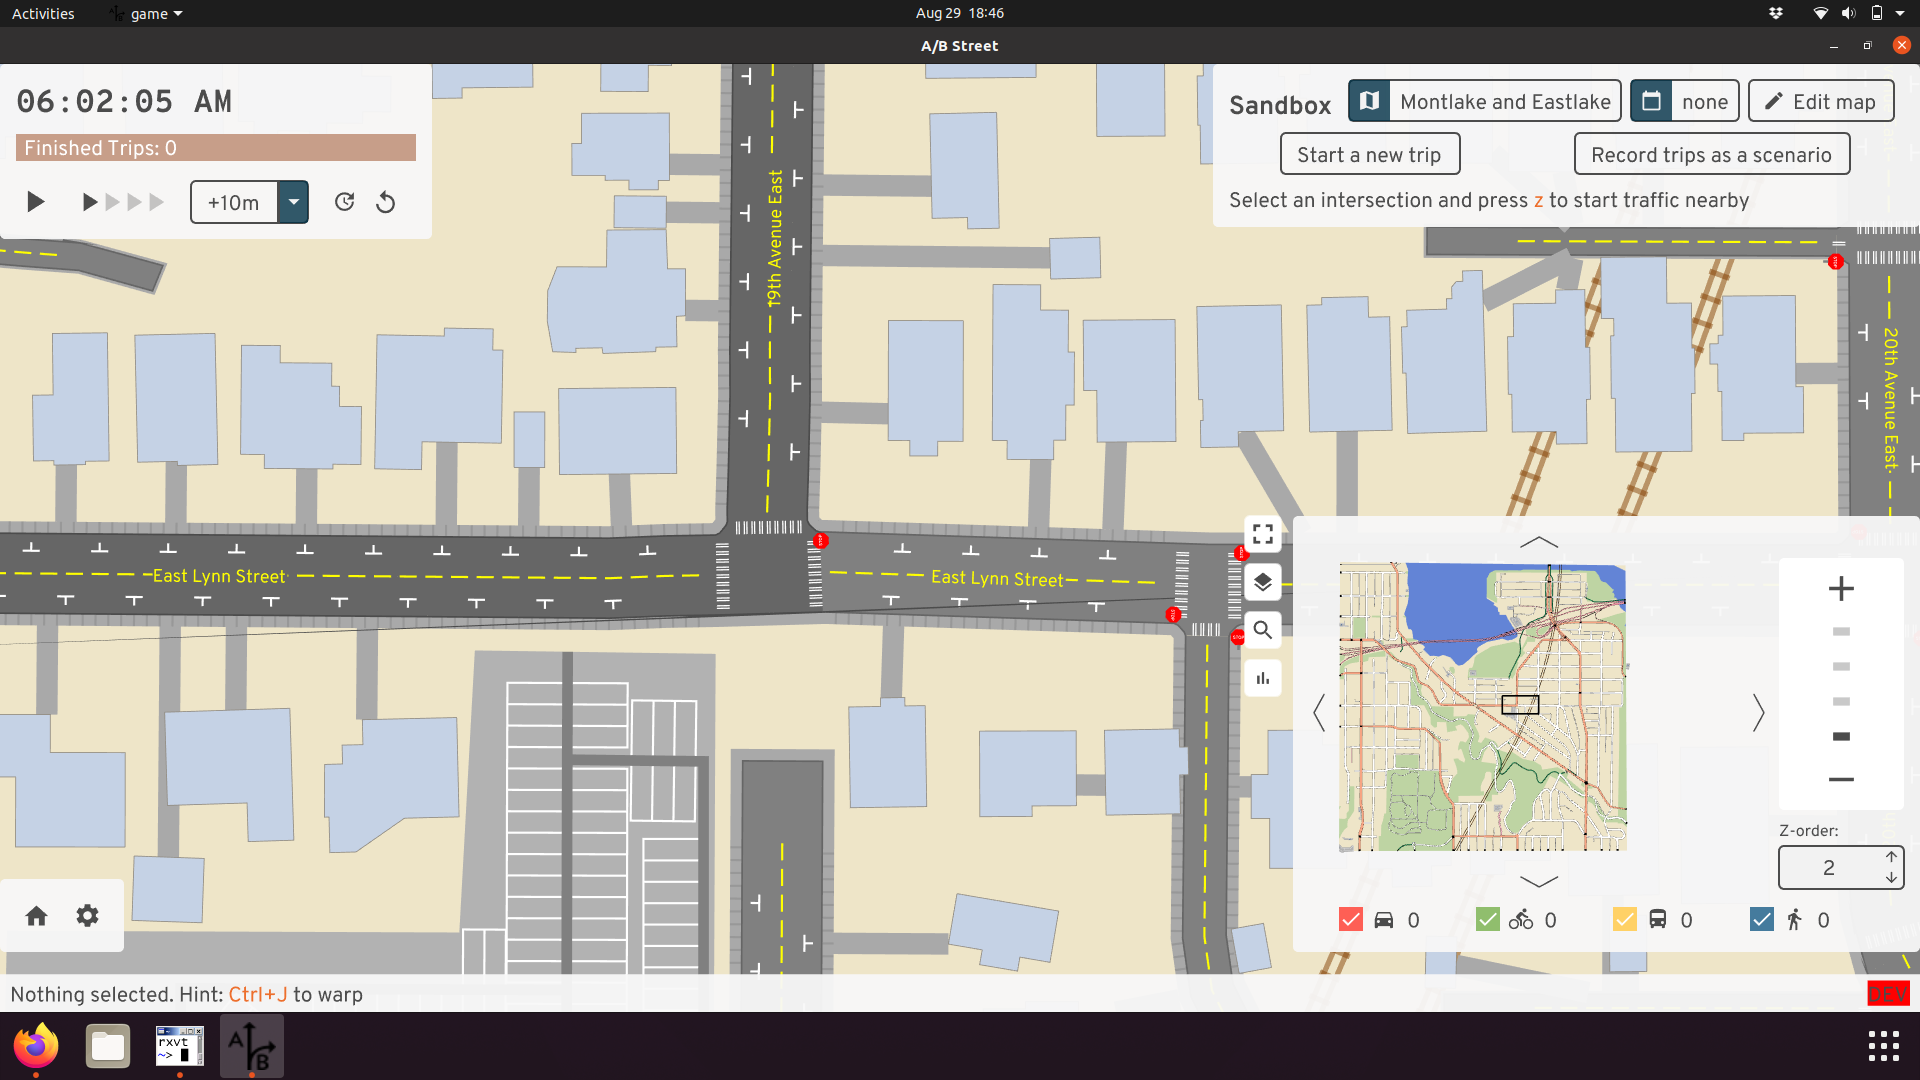 There it is!
Also, we have a pretty fantastic night mode, although I'm still holding out for something more cyberpunk.
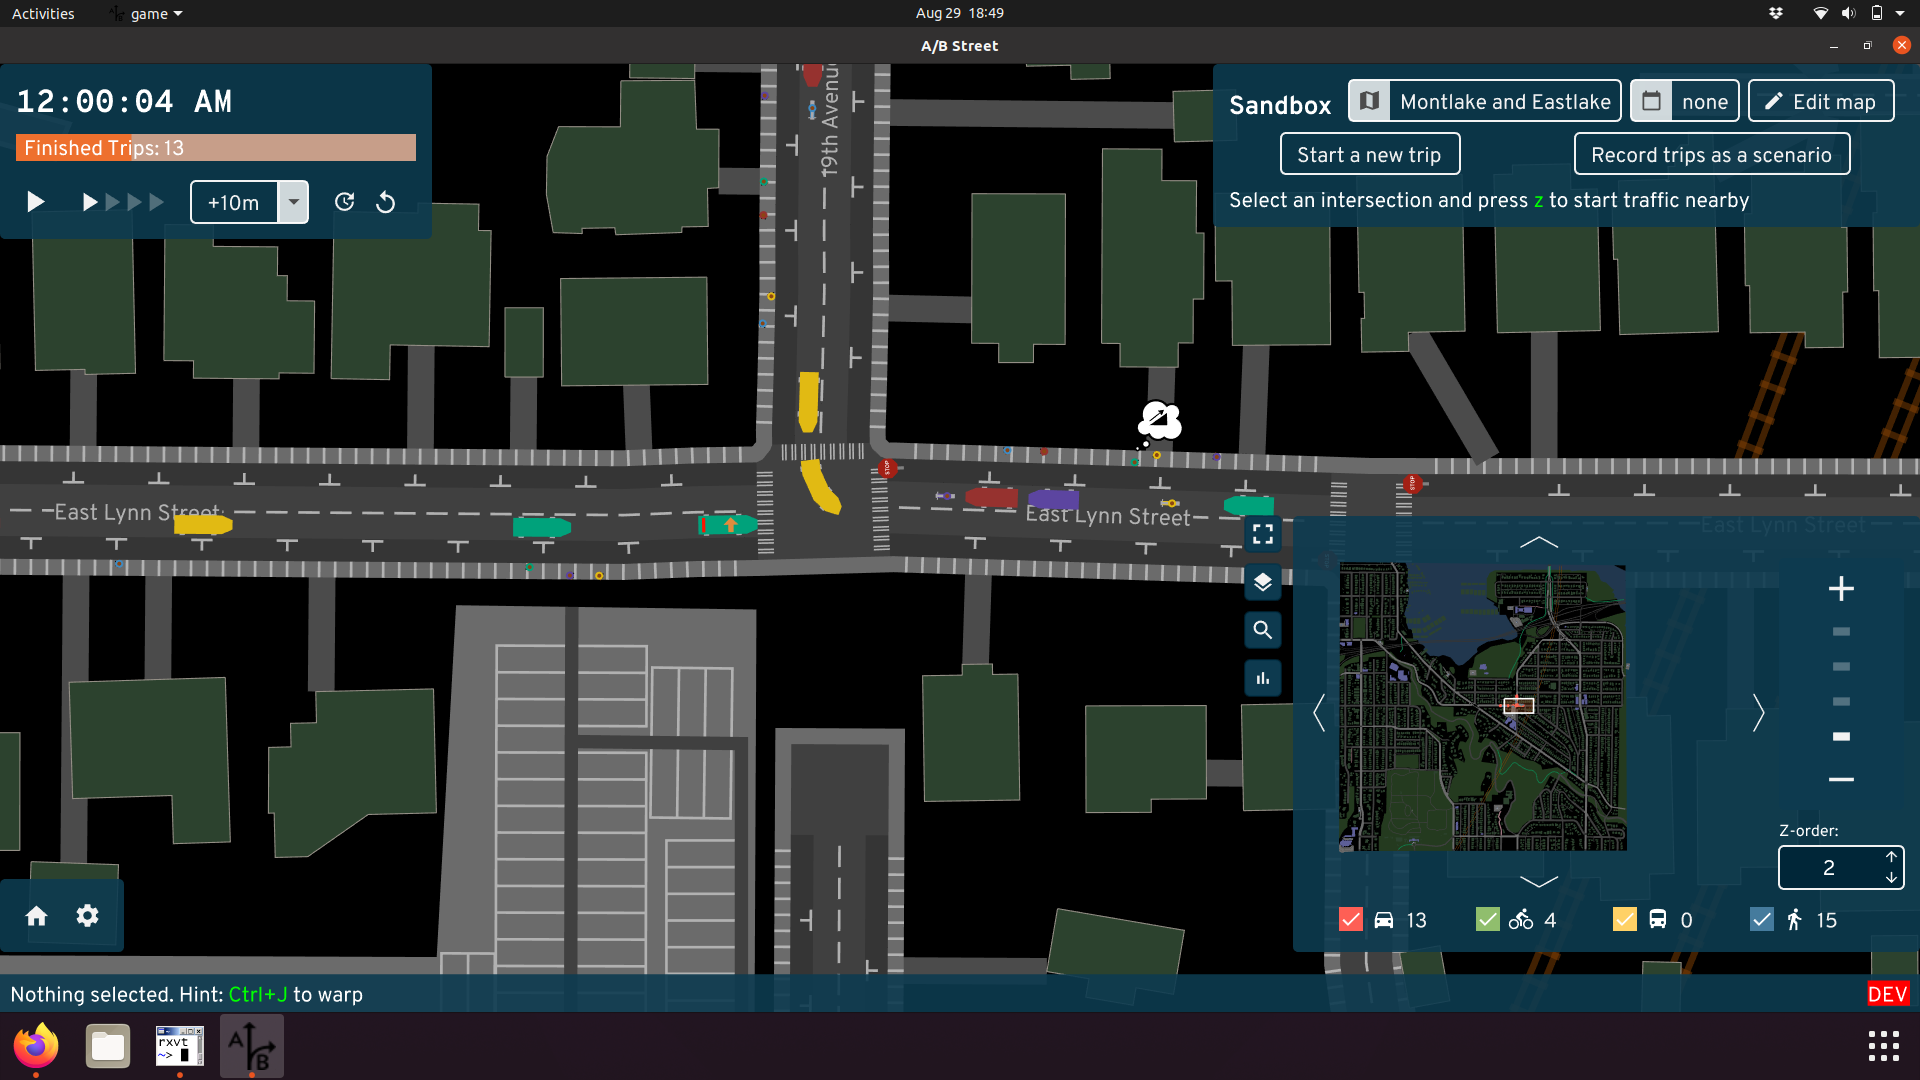 Both the UI and map have colors to show when the
simulation is after-hours
Both the UI and map have colors to show when the
simulation is after-hours
Road editor
A/B Street's ability to edit roads started simple, but today is quite powerful. Inspired by Streetmix, you can modify lanes however you want:
 Drag-and-drop, spear-headed by Michael, is key to this UI
working smoothly.
Drag-and-drop, spear-headed by Michael, is key to this UI
working smoothly.
We arrived at this design only after many rounds of designing, implementing prototypes, and gathering feedback.
Traffic signal editor
Most people experience traffic signals from the ground, not the sky -- they think about just the direction they want to go, not how the entire intersection behaves over time. At any point in time, a particular movement could be protected by a green arrow or light, permitted after yielding to oncoming traffic, or not allowed. After many iterations, I think we represent and allow changes to this quite well:
 Left turns should be protected here. So first we remove
the left turns from stage 1, where they were just permitted. Then we add a new
stage, protect the left turns, and adjust its timing to end early if there's no
traffic.
Left turns should be protected here. So first we remove
the left turns from stage 1, where they were just permitted. Then we add a new
stage, protect the left turns, and adjust its timing to end early if there's no
traffic.
Data visualization
A/B Street measures all sorts of things -- travel times, delays, throughput, a biking route's steepness, exposure to risky events. All of these things can be understood at the level of individual agents, roads, and intersections, or you can explore aggregate patterns and finder larger trends. You can view the data in absolute terms based on the current simulation running, or if you've edited the map (and the map is one of the lucky few that doesn't gridlock), then you can compare the results to the baseline simulation without edits -- the essence of A/B testing.
Here's a very incomplete sampling of our work:
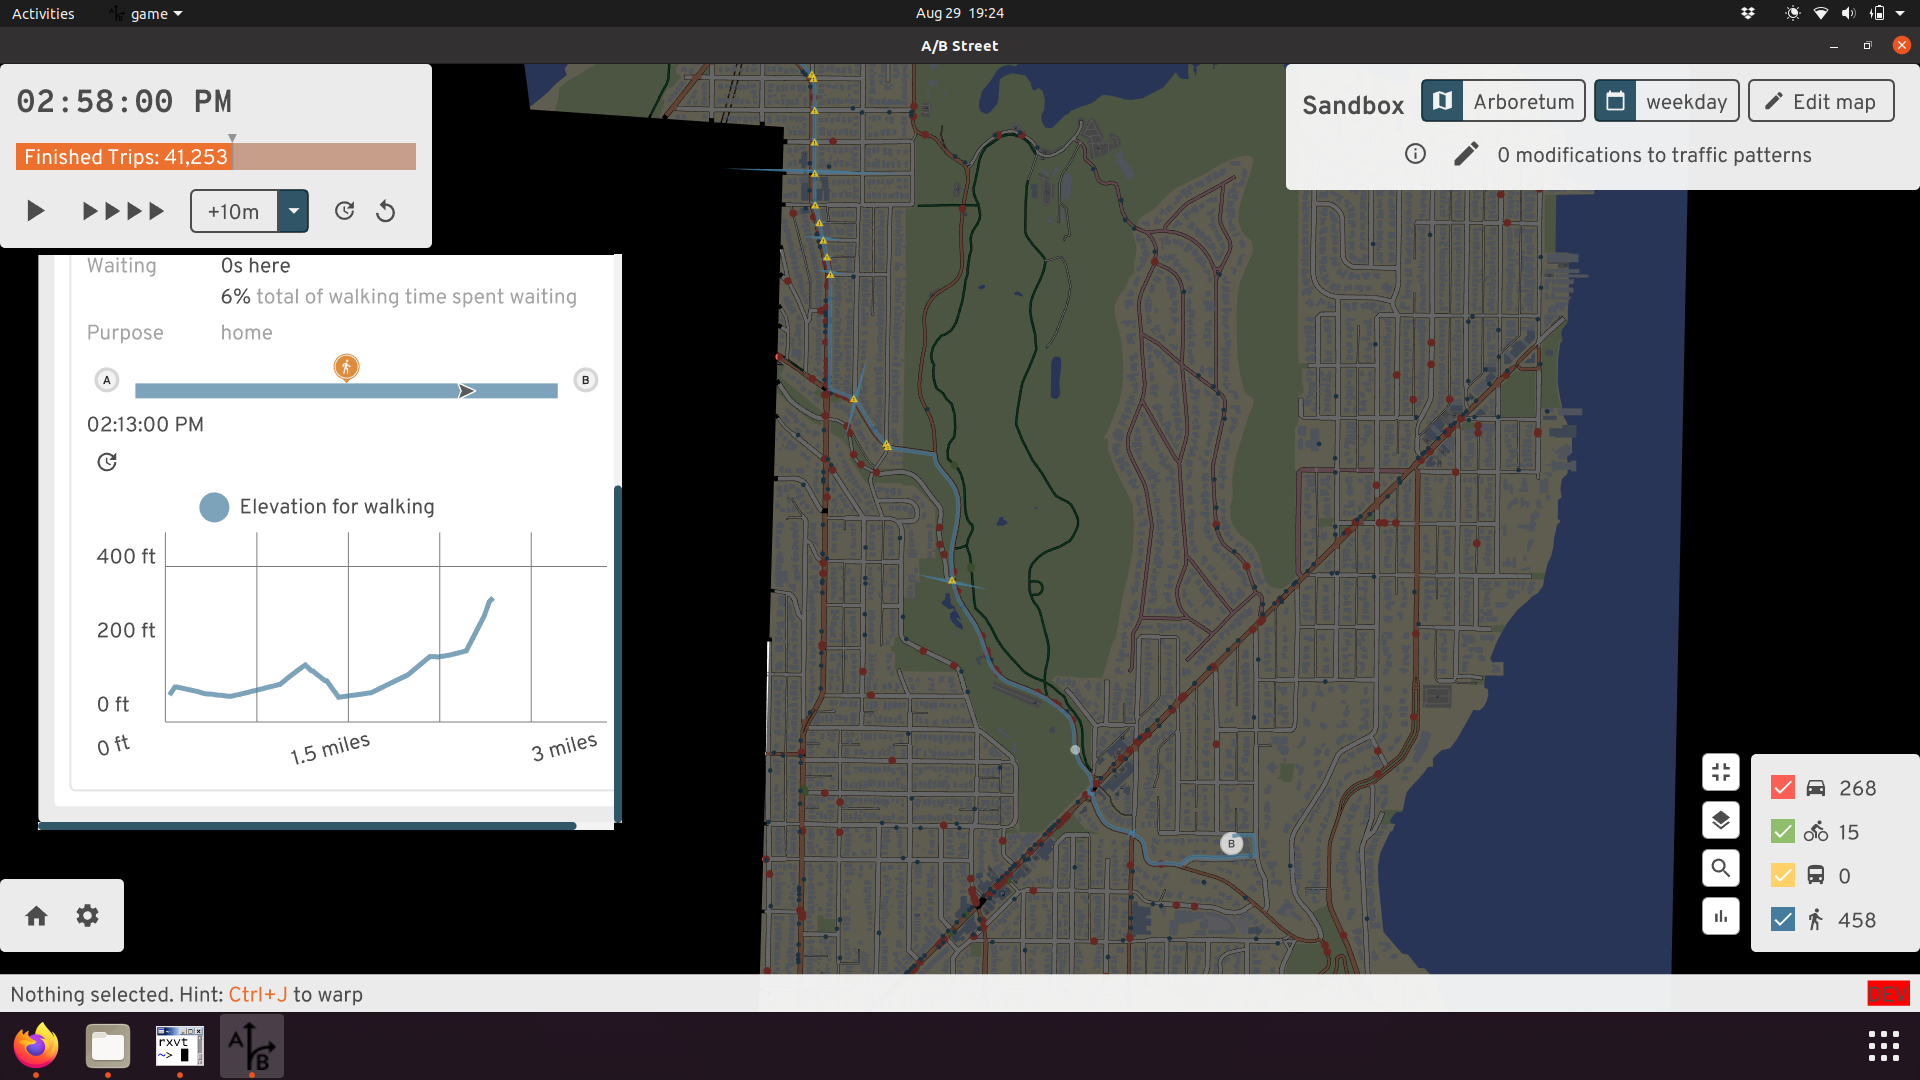 Diving into one person's route
 Watching a live scatter plot of delays through an
intersection, broken down by mode
Watching a live scatter plot of delays through an
intersection, broken down by mode
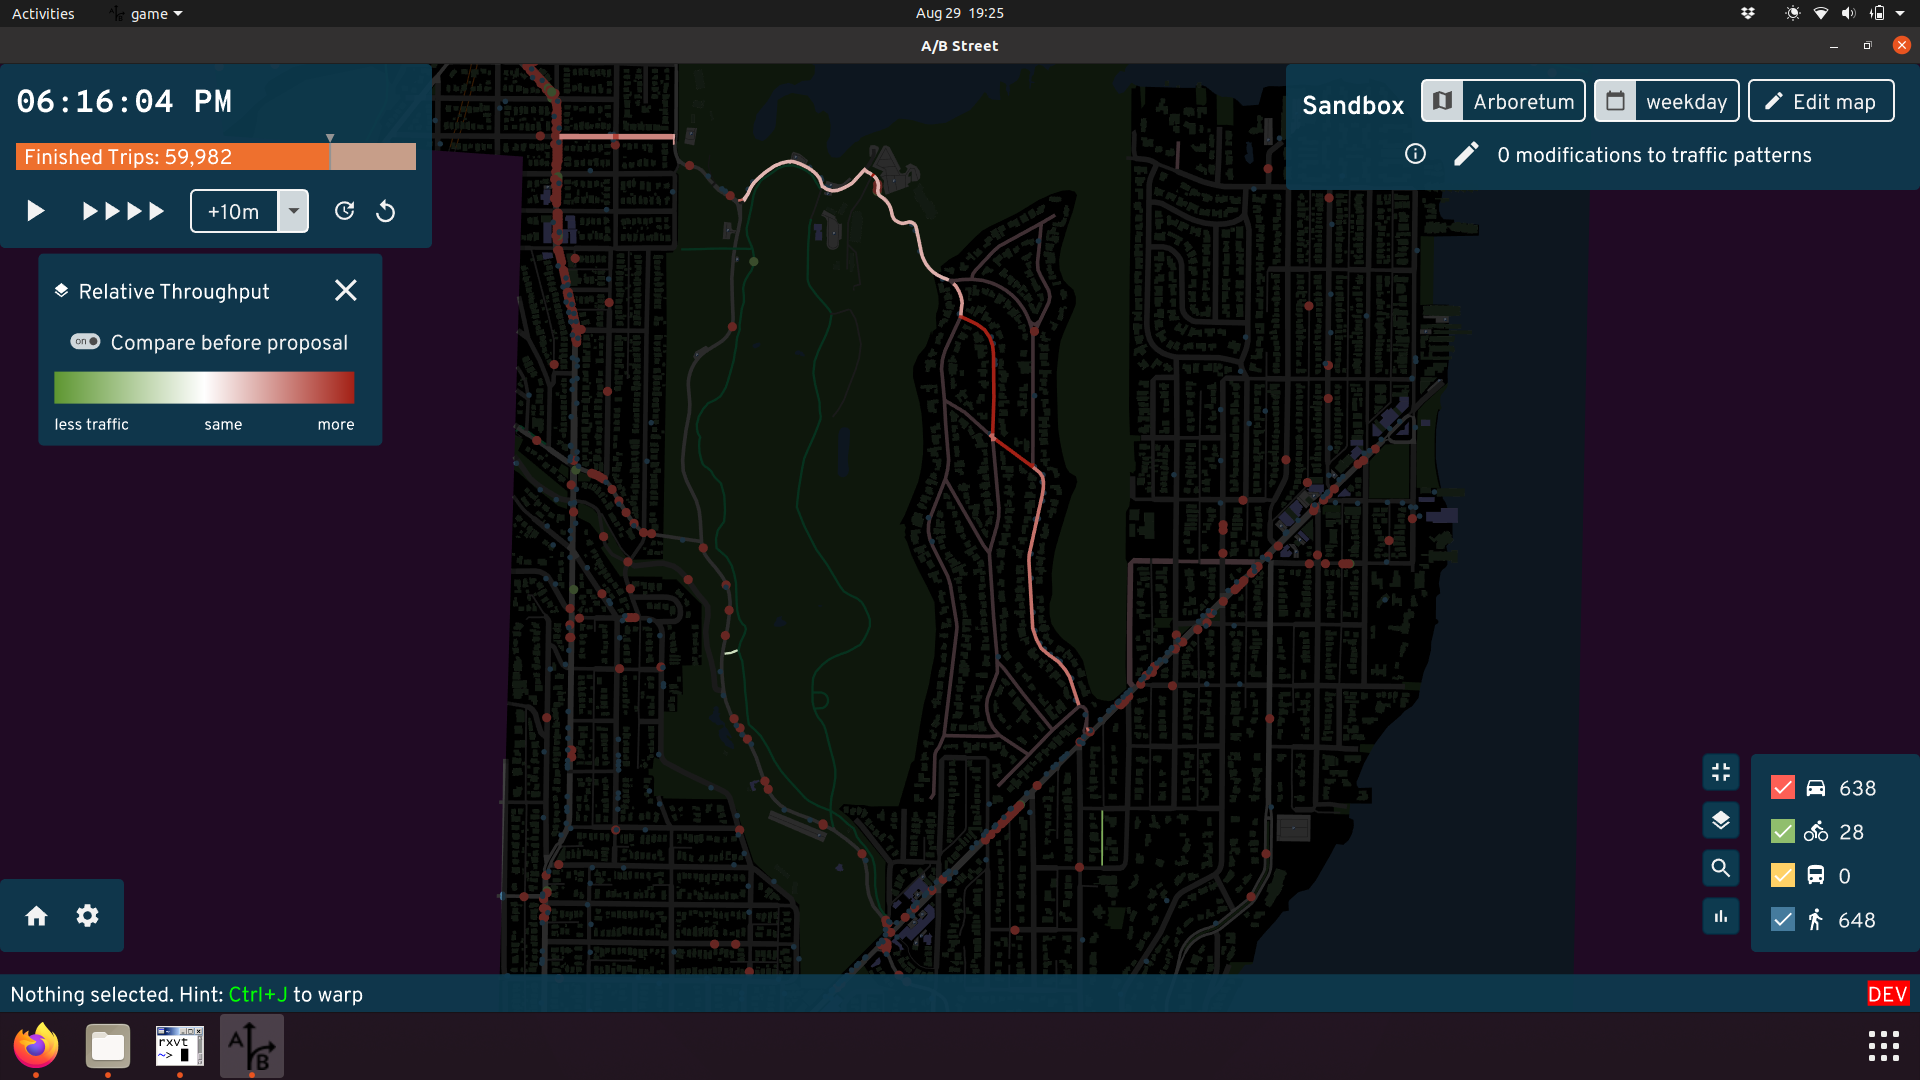 The red roads have higher foot traffic, due to
converting Broadmoor to a Stay Healthy Street
The red roads have higher foot traffic, due to
converting Broadmoor to a Stay Healthy Street
 Using a sortable table of all trips to find individual
people whose journey got much faster due to map edits
Using a sortable table of all trips to find individual
people whose journey got much faster due to map edits
 Understanding how short and long trips got faster or
slower due to map edits
Understanding how short and long trips got faster or
slower due to map edits
Road labels
Placing road labels on a map is quite a design and implementation challenge, but Michael and I cranked out something decent in a few days:
 Labels aren't too densely clustered, but they still appear
to help orient by major roads.
Labels aren't too densely clustered, but they still appear
to help orient by major roads.
Charm
Some design decisions in A/B Street are a love story to the city that started it:
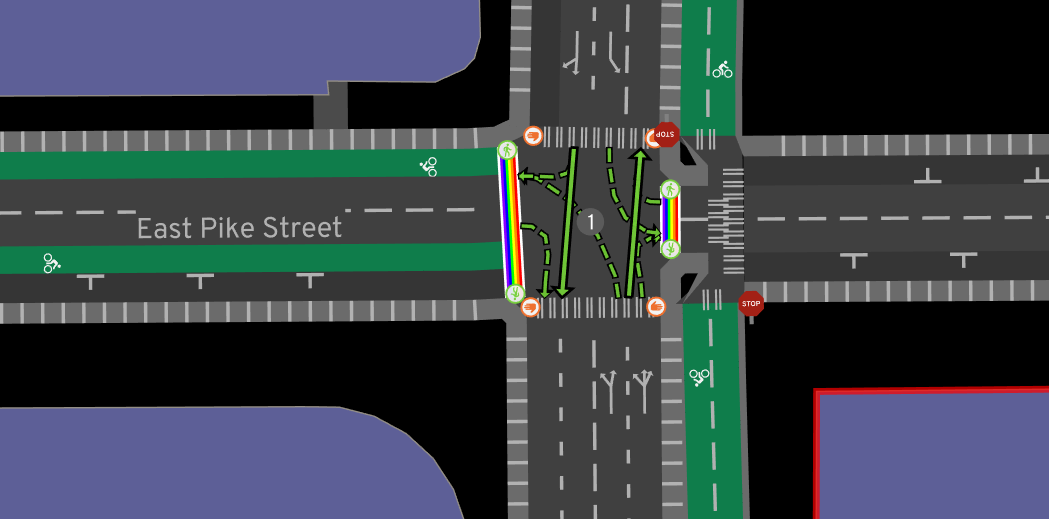 The cycletrack may not be snapped to Broadway
properly, but we do have the rainbow crosswalks on Pike
The cycletrack may not be snapped to Broadway
properly, but we do have the rainbow crosswalks on Pike
We tried to create a narrative around the game's challenge modes, with character art from a college friend:
 The Boss doles out assignments and placates irate
citizens
The Boss doles out assignments and placates irate
citizens
One of the first things people point out about A/B Street is the unusually bendy buses:
 "This frustrated tension and brief relief I can’t
articulate / oh, but the bus can." - from
public transit
"This frustrated tension and brief relief I can’t
articulate / oh, but the bus can." - from
public transit
For the record, this started because the simpler alternative is much worse. If you draw a long bus as a straight line and use any one point to determine the angle, the bus will pendulum around tight curves, happily smashing into anything in the way. Snakes are a slightly better approximation of reality. (I think the bendy buses have been called some less polite, but more hilarious, things too...)
Project management
Here's the section where I feel like the challenges have swallowed me, with very little success.
Collaborations
I was pretty quiet the first year, but then I started actively looking for people interested in working on this. I've lost track of all the people I've spent at least an hour talking to and seriously trying to set up some sort of collaboration -- at least 100? I've tried everything I can to attract contributors for programming, design, business, outreach, writing. Many start, but wind up vanishing. It's exhausting for me; I get emotionally invested in everybody who wants something from A/B Street. Running an open source project is really hard. But I want to emphasize it has partly worked -- I'm super thankful for the ~dozen people who have stuck around and really made working on this project a true pleasure. I probably need to learn to filter better, fail-fast, and put some barriers up before I invest.
There were a few low moments that stand out. Accidentally CC'd on an internal email literally stood the question, "It's open souce, why pay him anything?" when I was trying to set up a small consulting deal. There was also a group that was too cheap to hire somebody for their own idea, so exploited the fact that this is a passion project for me and for a while, somewhat successfully coerced me to work on their quasi-startup. There were also some highlights, especially when butting heads philosophically. Not everybody understood my mission before reaching out. I'll never forget one video call with a company that was going splendidly, until I explicitly stated all work I do will be open source -- watching the other person scramble to control their plummeting facial expression was perfect. And once I got the most Silicon Valley-ish email ever that started, "I'm the founder of a XYZ billion dollar AV startup." After thinking a moment, I led back with, "Well I think your XYZ billion dollar startup is a reasonable stepping towards car-free cities, but AVs aren't part of the world that I ultimately want to build towards."
These moments still bring me strength.
The success stories
I want to particularly thank Robin for his involvement with A/B Street. He fought to make it a part of ActDev, a really neat data science tool studying how people living in new residential sites in the UK are likely to commute. This integration provided a strong push to solidify the web deployment of A/B Street.
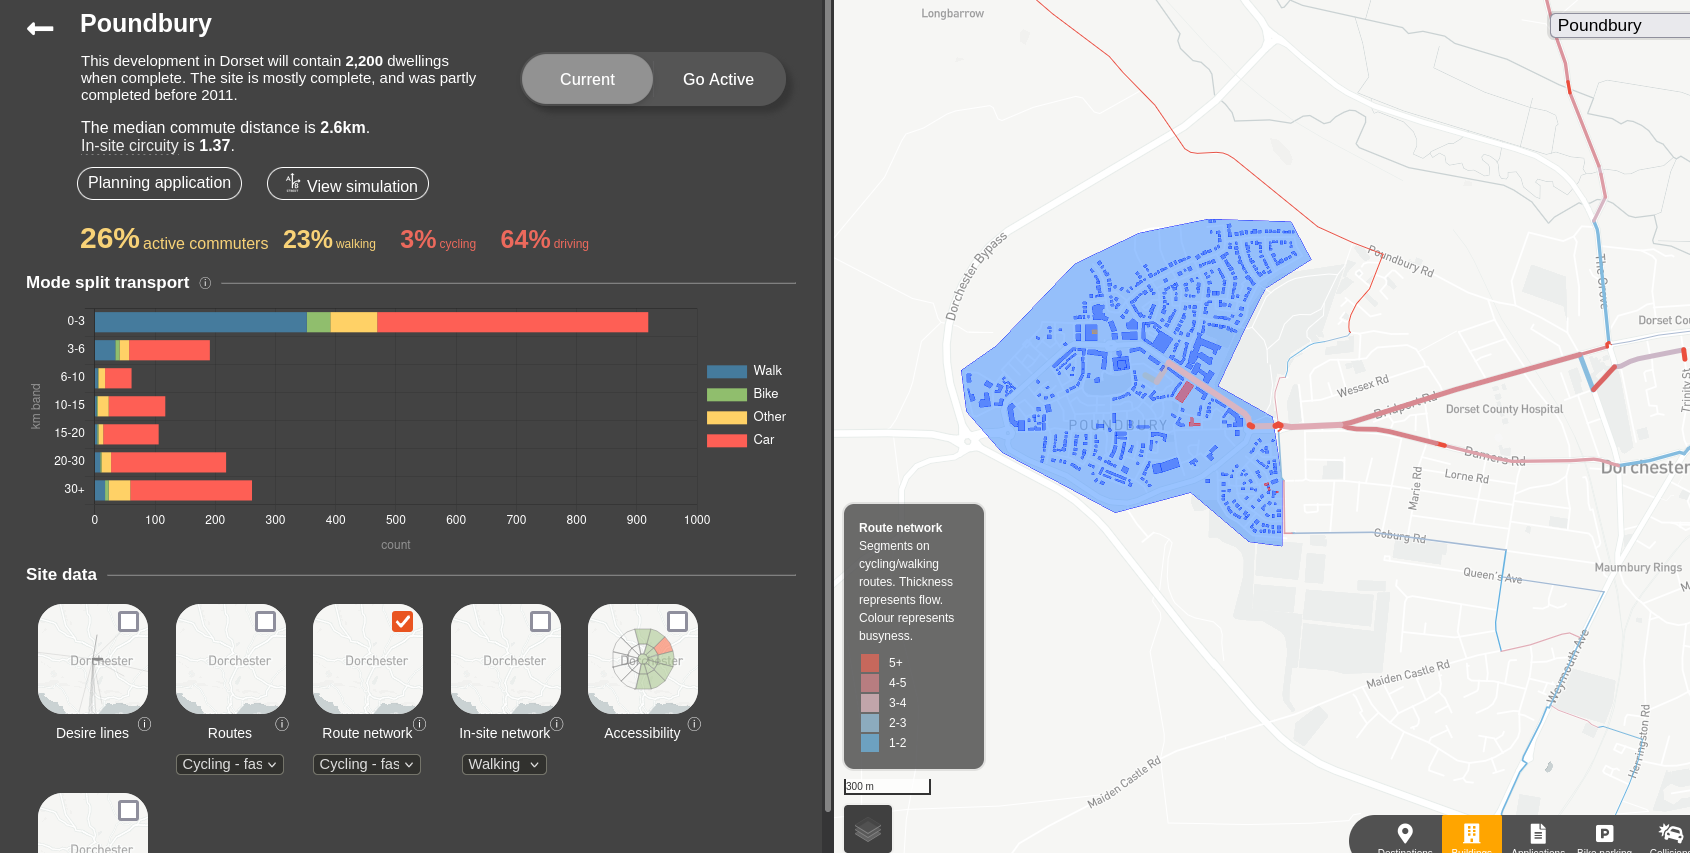 You can explore mode split patterns and other data in
the ActDev site
You can explore mode split patterns and other data in
the ActDev site
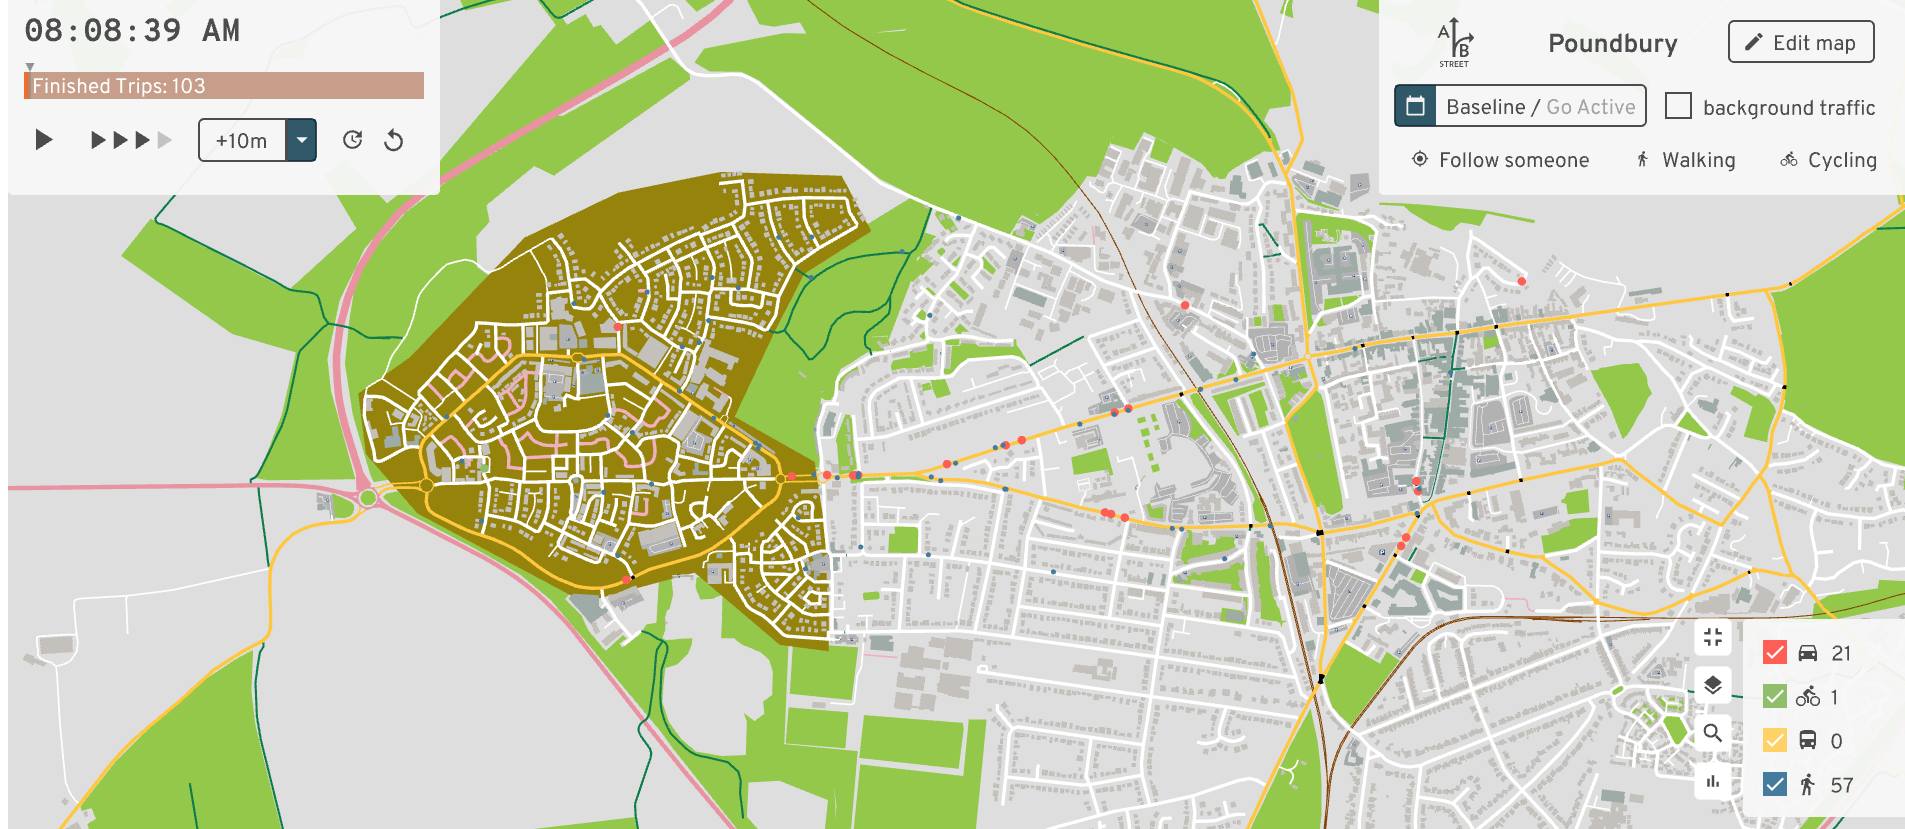 and then just click to simulate the site at an
agent-based level, and edit the cycle network
and then just click to simulate the site at an
agent-based level, and edit the cycle network
Robin has also massively helped evangelize the project and network with possible users. Along with Nathanael, they've made A/B Street more accessible to the data science community, creating an R package to transform travel demand models into individual trips to simulate. Robin's enthusiasm for open source and reproducible research is infectious.
Project scope
Traffic simulation is such a massively broad endeavor, and because I dabble in so many parts of it, people really brought strong expectations about what they wanted it to be. What about Monte Carlo simulations? Or gondolas? (No, really.) Why not build a city from scratch, just merge with Citybound? Oh, there's no lane-changing? Not calibrated to real traffic volume data? Well then it must be useless.
I tried my best to balance all of that input with establishing boundaries and pursuing MY vision.
... But what exactly was my vision? I said early on, "this is an identity crisis between a game and a serious planning tool." At first that was a way to punt on the realism and calibration problem -- I couldn't hope to alone compete with industry standard simulation software. It was also a way to engage the general public, or at least the percentage that plays games.
Teasing apart the monolith
The scope of A/B Street is way too broad. Early on, all of the new experiments were just crowded onto the title screen, but at some point, we split out more tools with more focused purposes.
The "main" app is A/B Street -- that thing that lets you simulate traffic and edit roads. Part of it still tries to act like a computer game, but we haven't put much effort into this in quite a while. It does have a tutorial and a few challenge modes with particular objectives (and even a narrative with some characters!). But I wouldn't call A/B Street as a game "fun" -- one of the challenge modes is impossible to win, because we picked too large a map to ever hope to get past the gridlock bugs. We could chop up the challenges into much smaller "levels" and properly tune the difficulty curve, but it would honestly take somebody dedicated to game design to spearhead that.
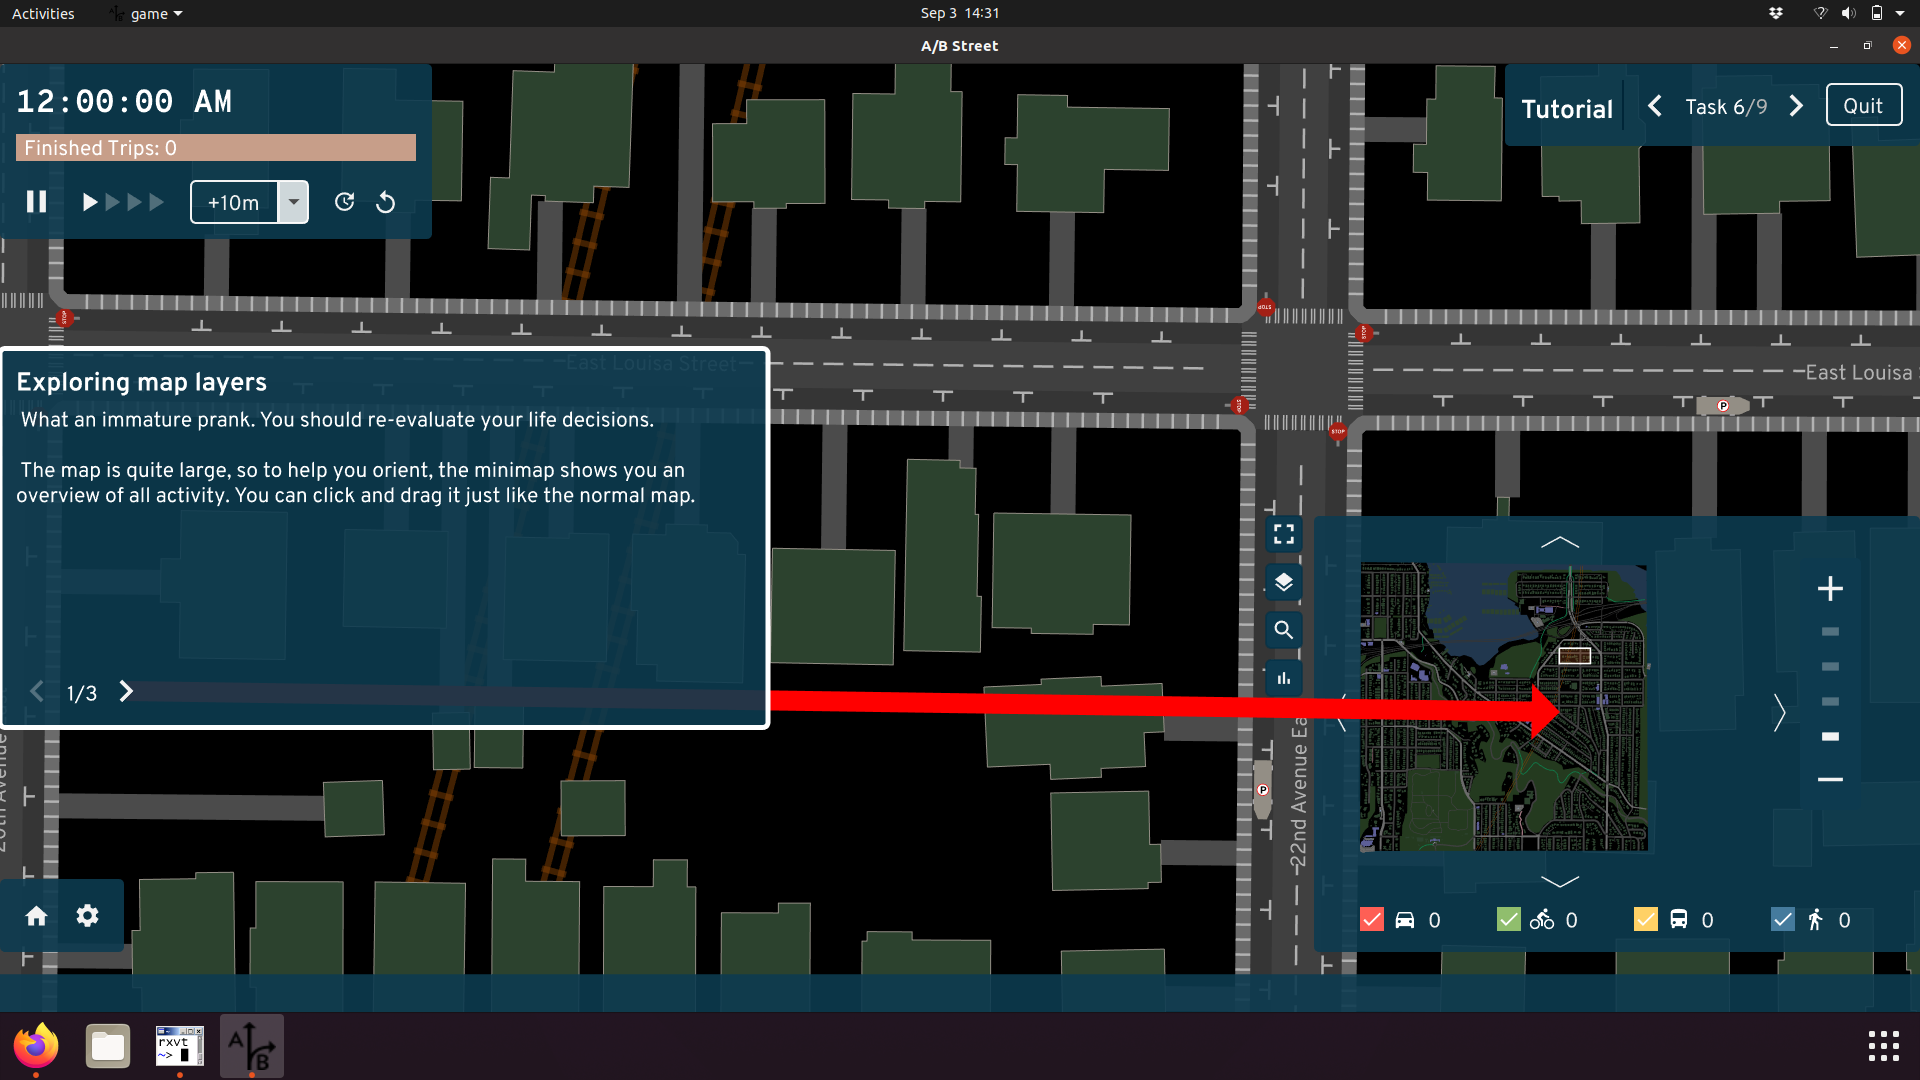 The user interface can be overwhelming, but the tutorial
slowly introduces and motivates different features. The more ambitious idea was
always to have the player slowly "unlock" more of the tools as they complete
challenges.
The user interface can be overwhelming, but the tutorial
slowly introduces and motivates different features. The more ambitious idea was
always to have the player slowly "unlock" more of the tools as they complete
challenges.
Instead, most uses of A/B Street are in the "sandbox" mode, where no specific objectives exist. Instead, this is a place to edit the map, explore all the different data visualizations, and try to inch towards completing a full simulation without gridlock.
I feel bad that A/B Street as a properly fun game was never realized, but I'm proud of 15-minute Santa. By no means is Santa attempting to split the difference between serious planning and entertainment; it's just a silly arcade game that loosely involves transportation and land use.
 Paperboy modernized with OpenStreetMap, a Santa sprite, and
plenty of silliness
Paperboy modernized with OpenStreetMap, a Santa sprite, and
plenty of silliness
We also made a tool to explore 15-minute neighborhoods. The isochrones are hopefully useful to understand what parts of a city have good or bad access to different types of shops, and how hills and slow traffic signals affect walk or bike-sheds. Editing the map -- particularly to modify land use -- and checking out the differential isochrone would be the ultimate use for this tool, should we ever revive it.
As I realized the most active audience for A/B Street is the OpenStreetMap community, I spun out some tools to validate lane tagging and tag street parking.
After some feedback from advocacy groups and people who felt overwhelmed by the broad scope of A/B Street, we created a simple interface for sketching and evaluating a bike network.
And now we're spinning up a dedicated tool for low traffic neighborhoods.
Marketing
The successful marketing basically came for free. A single bold post to r/seattle was magic. Someone "leaked" the project to Hacker News. I think the alpha launch trailer got the point across. The Stranger made a shocking connection between my childhood with Banjo Kazooie and my current fascination with multi-modal travel.
But I've also hustled near-constantly online and in-person, at countless hackathons and conferences. I've cold-emailed so many companies trying to set up collaborations.
Community
The A/B Street Slack has a sense of home to me; it might've started for work, but I've forged friendships there.
I think I did a reasonable job amassing a small army of people interested in open source transportation software. Some of the academic and data science communities weren't talking to each other before I got people into the same (virtual) room.
Money
I self-funded from savings from my previous big tech job. I feel super fortunate to have had zero pressure to make money with A/B Street, letting me prioritize what really matters to me. I've even personally funded a few people to create new open source libraries that I needed.
But not starting a business, even some kind of consulting firm, was likely a mistake. Many of the groups I tried to collaborate with probably had no idea how to deal with me. There's no legal entity for the project, I'm not in academia, I'm not even calling it a startup.
The problem
That thing I've poured 3+ years of my life into? Nobody's using it.
(Except maybe a few members of the OSM community, in a way I mostly don't hear about.)
Advocacy groups
For a long time, I've insisted that either advocacy groups who fight for biking/walking-friendly changes in cities or individual Twitter urbanists with large followings would find some use for A/B Street. Maybe the traffic simulation stuff is overwhelming and not trustworthy, fine. But at least the top-down road visualization and editing is better at communicating an idea than some squiggly lines on top of Google Maps? Surely groups pushing for a better bike network want to see how elevation and collision data relate to their ideas?
And the more I understand about how advocacy groups (at least in Seattle) work, the less I have faith in them to avert the climate crisis. I seriously respect their longevity and determination, but fighting for years to get only the slightest improvement isn't a time-scale I believe in. Cities need a massive culture shift. I want to find and work with the people who have some sense of urgency, even if that's not realistic.
The public
The thesis behind A/B Street is that ordinary citizens are experts in some small slice of the city that they interact with. And so when they see a problem, A/B Street is a tool for them to explore and express ideas for changing it. But I'm beginning to believe I'm wrong about this -- because, where are they? If somebody's only casually interested, they're not going to dedicate their time to fighting for a real change. And if somebody really does care enough, they'll... possibly wind up working for a city government, where they actually have power to change things (and slowly have their spirit crushed by bureaucracy).
I had many goals with A/B Street that are about sparking culture shifts:
- Pushing people towards sustainable car-free cities
- Getting more ordinary citizens involved, in a productive way
- Getting different parties -- government, citizen, advocacy group -- on the same level, communicating in a standard way
- Promoting open data and open source software for use in government planning -- why trust the traffic analysis that you can't read and reproduce yourself?
I don't feel I've budged the needle on any of these.
Who's our audience?
I've tried to avoid actually advocating myself for specific changes in Seattle. Partly this is because there are well-established groups here that do this already, and I want to spend my energy doing what I enjoy more -- creating software to empower them. Partly I'm afraid of promoting ideas that're tied to my own biases and wouldn't serve everyone in Seattle well -- I have a conspicuous gap of knowledge about biking in South Seattle, a place with much more traffic violence and much less cycling-friendly infrastructure. And partly, I'm just lazy and avoiding writing -- I can do it, but it's so draining -- writing this document was quite difficult for me. As a team, we have published one simple advocacy piece -- written by Michael -- more to experiment with the format than to push for a real change (although the idea would be fantastic, asking to open up private roads is a non-starter).
I don't have a good understanding of politics or how to actually help advance real changes on the ground. But since we've failed to find users for A/B Street that're advancing some cause, then... there is one last thing we could try. Will I rip off such an adhesive bandage before it's too late?
What this project means to me
I try to inject my humor into A/B Street wherever I can. When I skim through the release names, I remember the story of my life that week, or something bizarre I cooked/ate/"foraged" -- ajitummy, twice-dumpstered anything, beef welldoneington, tostonical vows, the rise of Fridgehaus, rubducks in the laptub, taro bingsoothsayer, Hausbroken.
After weeks of sweating over what the 15-minute neighborhood tool is supposed to do and just one stout, I exploded out of my room and drunkenly pitched 15 minute Santa to my bewildered housemates. Then Michael and Yuwen and I made it (thank you for putting up with me).
A/B Street is my self-expression. Its origins are tangled in a mess of bittersweet memory (I wasn't the one who thought a game should be about traffic) and near-misses with trucks passing too closely on Boyer. I used it to pull out of a nose-dive of depression -- that's a story I'm still trying to write. I broke my fear and landed some of the largest jumps of my life (I do parkour) as an escape from constantly thinking about A/B Street. I've worked on this project for the entirety of COVID. I've coded while taking the shinkansen from Tokyo to Miyazaki and the TGV from Paris to Berlin. I pushed code the morning of my ACL surgery, and reviewed a PR when I got home (and was remarkably lucid). It's safe to call me obsessed. I quit my job to do this. I've worked on it basically every weekday and weekend for 3 years, and thought about it constantly for at least 6 months before starting the project full-time.
A/B Street lets me take a bird's eye view of the messy world I move through, imagine it a bit differently, and try to convince others to see it the same way.
If anybody wants to convince me to do something else instead, now you know what you're up against. And if you succeed, you know how important your idea must be to me instead.
Epilogue
(November 2021, a few months after this article was first written.)
After a rocky few months, I've decided to continue this "passion project," but with some changes and a much more clear understanding of what I want out of it. Stay tuned.
Vision and validate -- a reflection on 2022 and a lookahead
I wrote such a dramatic almost postmortem last year; this one doesn't live up at all! I blew past 5000 words, sorry. Please just skip around to sections or look at pictures.
For context to the unfamiliar reader, I joined the Alan Turing Institute a year ago, so I'll often refer to "Turing projects."
A reflection on 2022
What I worked on
Let's start with the easy stuff.
People often ask me, "do you still spend most of your time working on A/B Street?" That was already hard to answer last year, with the original vision of a traffic simulator getting stretched into "side projects." The line has only been gettier fuzzier, with some pieces being split into standalone projects. I consider most things I do to be under the A/B Street umbrella, but it sure is a wide one.
The low-traffic neighbourhood tool

I started this tool right before the move to London, and in some sense, it took until October to feel properly useful. That seems like a long time for such a technically simple tool, but I also haven't focused on it constantly.
The LTN tool is tremendously important to me because it's what I consider the first big success of A/B Street in the real world. I wrote last year about how frustrating it's been to work hard on other parts of the project, but never see them get used. I really can't overstate how happy I am about working with Bristol City Council to use the LTN tool in their public consultation. I had the immense pleasure of attending a few of their workshops in person and meeting residents who had used the tool on their own and who tried it out for the first time there. I heard great feedback, and watched some people get totally sucked into it. This is what I've been trying to achieve for four years. It took so many pivots to carve out this niche, but it's been so worth it.
Lots of feedback about the LTN tool has been quite skeptical. Some groups are afraid the public will misinterpret the tool as over-promising an easy solution. Their concerns are often about how an LTN will affect the wider area. Very importantly, the LTN tool does not try to say anything about that. (The "predict impact" mode is hidden behind a screenful of warnings!) I think this comes down to a bit of a philosophical difference -- I'm not trying to outcompete the existing traffic modeling world with all of its calibration, rigor, and complexity. I'm trying to inspire people, start conversations about what's possible, and help them make more informed decisions. Demanding perfection and rigorous modeling for everything is a delay tactic. We don't have time to incrementally decarbonize transportation, improve air quality, or make streets safer. Rapid prototyping is A/B Street's niche.
So much of the development time for the LTN tool has been attempts at design. There were many rounds of feedback from about a dozen groups using the tool. I still feel very slow without a UX designer's help, so it's awesome that I got help from my colleague Fernando on cartography and from Madison on many parts of the tool's UI. Things have really changed over a year:
Calibrating travel demand models
One of my Turing projects has been to use real traffic count data to calibrate travel demand models to current conditions. This took me far out of my comfort zone; I avoid calibration because it involves a level of statistics that I'm neither comfortable in nor really interested in learning. I'm surrounded by people who're experts in this stuff; I'm happy specializing in adjacent problems.
This project didn't feel like a success to me. As expected, the existing demand model produced from ancient 2011 census data -- and that only covers a fraction of all trips by purpose -- doesn't match up at all with real counts from 2021 and 2022. I'm no closer to knowing what parameters to adjust to try to make things match up.
But many people keep asking for something like this, so I think 2023 will finally have to be the year to give it proper attention.
Pedestrian simulation
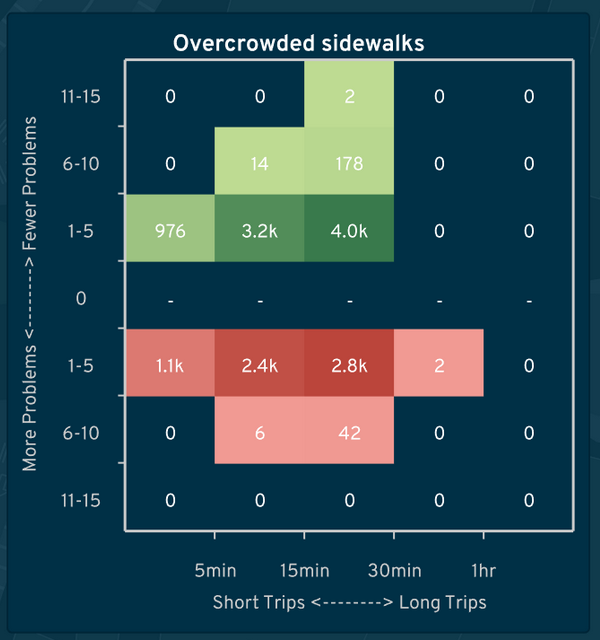
I also worked on a project to study overcrowded sidewalks in Brazil. The A/B Street model is fairly coarse-grained: check how many pedestrians are on a sidewalk at the same time, and compare the count to the total area of that sidewalk. When some density is exceeded, slow down the speed of people crossing the sidewalk, and record an event about overcrowding. Then someone can use A/B Street's lane editor to mimic a real proposal to widen sidewalks, repeat a simulation, and compare the frequency of overcrowding.
This was much more complicated than I expected, due to two problems. First, spurious diffs, where a tiny change to the map causes huge cascading effects. Second is unrealistic behavior of when people will cross a street. Lots more work is needed both in the traffic simulation and map importing to handle marked and unmarked crosswalks realistically.
osm2lanes
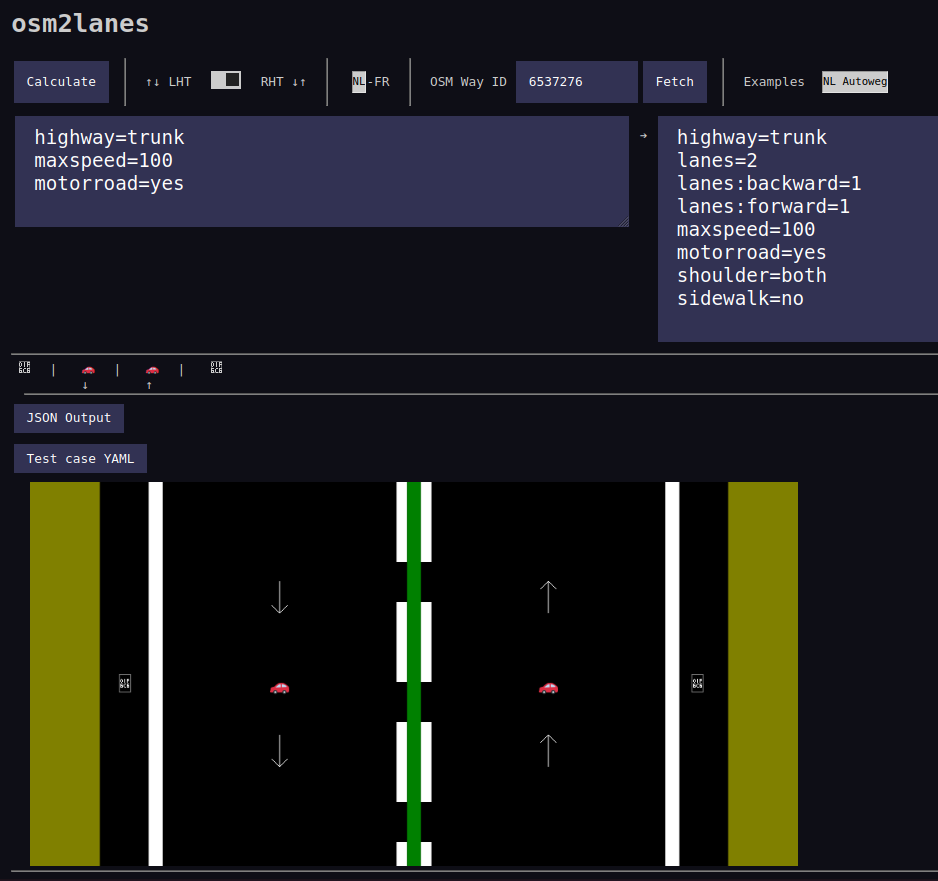
Early in the year, I got sufficient interest from a few other OpenStreetMap people to split out one "simple" piece of A/B Street code -- the bit that looks at one OSM road object and figures out what the lanes are. At first we tried to keep parallel implementations going in Rust, Python, and Kotlin, with shared unit tests. But interest in Python and Kotlin faded away, and we could generate bindings for other languages anyway.
Michael Drooglever drove this project forward for a few months, but unfortunately it's at a bit of a stand-still right now. The new implementation introduces some excellent ideas, like splitting the problem into two stages. First parse messy OSM tags into a higher level structure describing something, like the presence of bus lanes on each side of a road (from three different OSM schemas, which're often tagged simultaneously and in contradictory ways!). And then update an overall list of lanes based on that summary. But the new implementation also brings much more complexity and difficulty implementing new features, and produces very different results in many cases.
So for the moment, osm2lanes is in limbo. The original lane parsing code, slightly cleaned up, is still the production version.
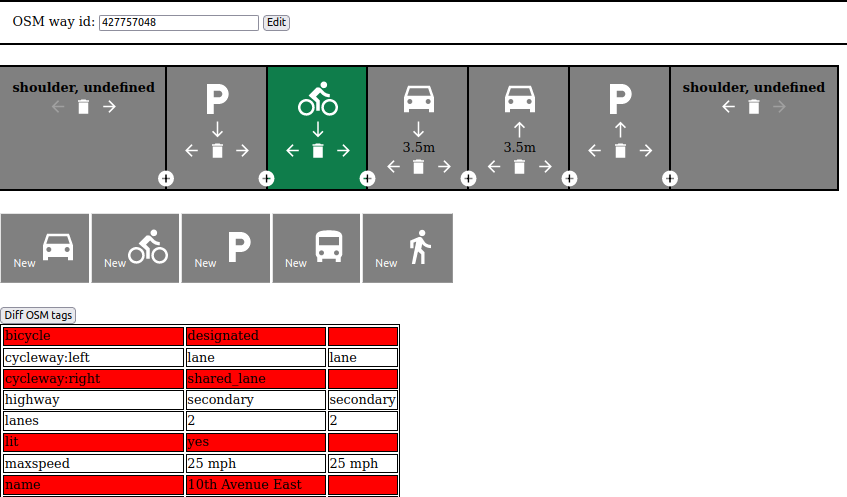
One experiment we started here was a simple Javascript editor to visually describe the lanes along one road, based on the universal Streetmix-style cross-section view. To make this work, we'll eventually need to implement "lanes2osm" -- overwriting or modifying the tags already on a road.
osm2streets
osm2streets feels like the huge technical accomplishment this year -- not one breakthrough, but a bunch of small ones adding up. It's been awesome working with Ben Ritter, who brings fresh perspective and experience with the JOSM lanes plugin. Just in the last few weeks, we've totally rewritten the intersection geometry, road trimming, and boundary clipping code, easily some of the most complex things I've ever worked on.
Why has the OSM importing code been split out from A/B Street? At first I was nervous about the maintenance overhead and still validating changes all the way in A/B Street. But we created StreetExplorer, a Leaflet-based UI to import data from Overpass and rapidly iterate on test areas we've clipped out. It's so much faster to work with better tests and a faster compile cycle. Another advantage is to be free from old assumptions in A/B Street -- namely that the traffic simulation is the highest priority. And most importantly, a more focused codebase lets more people get involved, like Jake and the new vector tileserver integration.
Another "breakthrough" happened in just one day. The visual lane editor in osm2lanes has a number of unsolved design problems -- how do you see the lanes in context on a map, even just to understand forwards and backwards? It turns out the osm2streets web UI is already pretty much usable as a tag editor. You still have to understand the tagging schema, but now at least you can immediately visualize the results of a potential edit.
SPC and ASPICS
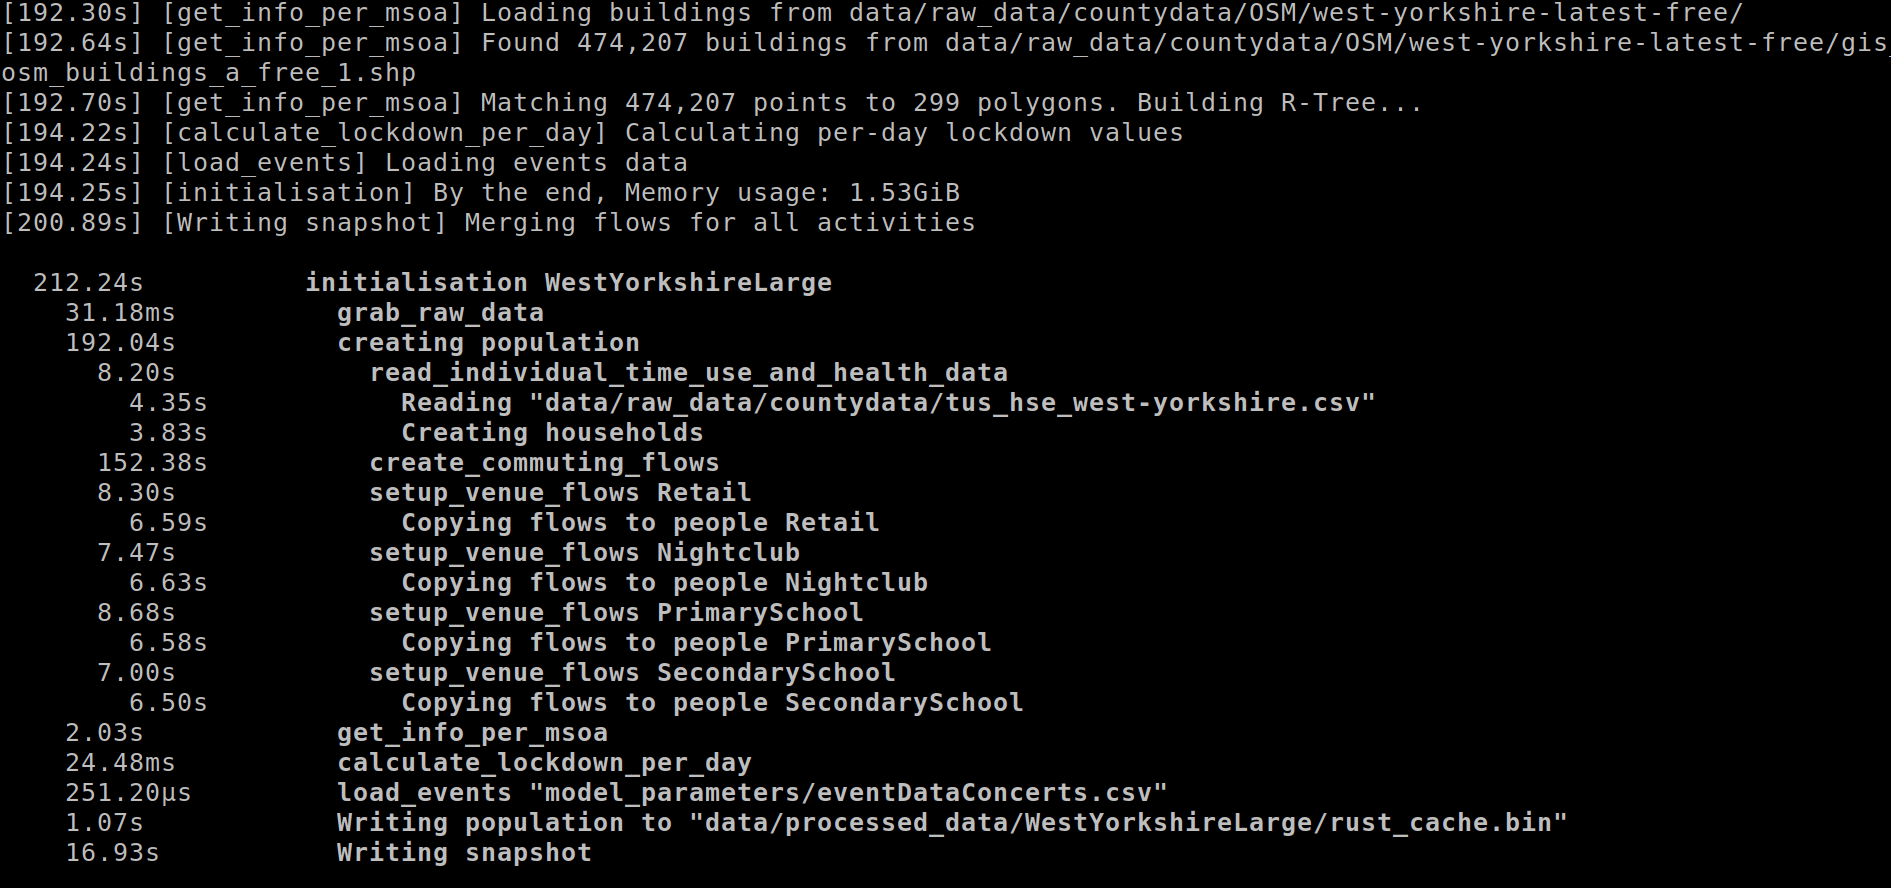
I swear I haven't just been working on A/B Street-related things all year! My first project at Turing was to help a project originally called RAMP. RAMP combines a bunch of UK-specific census and survey datasets to build a detailed synthetic population for England. Each "person" has income and an employment sector, pre-existing health conditions, and a daily schedule of activities. Using a model called QUANT, the people visit different venues every day, spending some amount of time in a particular building. From time spent in shared spaces, a COVID transmission model predicts the spread.
(This was awfully nostalgic to see -- well over a year prior, Orestis added a pandemic simulation on top of A/B Street, based on people spending time in the same building!)
Since I joined Turing in late December 2021, the team wasn't around, and all I had was the RAMP codebase and some complaints about runtime performance. It was treachurously difficult code to decipher -- many acronyms undefined, inconsistent terminology, made liberal use of numpy with intense index manipulation, had several people rotate in and out of the project previously, and was itself a port of an earlier attempt in R. I poked at a few glaring issues, and, without further direction from vacationing colleagues, decided to understand it in depth the way I do best: by rewriting it.
... Of course I chose Rust. It was a fairly quick job -- unburdened by the meetings that would start in the new year, about a week to port the data prep stage. Seeing how normal it was to work with dataframes with 100 untyped columns, I made careful use of Rust's type system, demonstrating the strengths of things like type-safe IDs for people and venues. Absolutely no index mangling left!
We've wound up using this Rust port, and calling it the Synthetic Population Catalyst -- the idea is that it can be generally useful to other projects that need detailed synthetic population data. It's been successful in speeding up and solidifying the first half of the COVID project. But the real experiment I tried was to teach my colleagues some Rust, sell them on the idea of using types to clean up messy data once and work with stronger assumptions elsewhere. I've failed on that front; it's too big a leap from Python and R to be worth learning.
So something I still want to experiment with is a way to get the best of both worlds, and do something like embed an interactive Python shell in the middle of a Rust pipeline, letting someone poke around with some half-assembled but type-safe structures with a familiar REPL.
A foray into public transit
I've avoided focusing on buses and public transit in A/B Street for a few years now, always trying to lure someone else into it. The reasons are simple: it's an absolute minefield of new complexity, RAPTOR pathfinding algorithms, new messy GTFS datasets to deal with, and a host of new UX/design challenges. It's not a small side-quest, and it's something that commercial software probably handles pretty well (if you can afford a Remix license).
But I got caught up in a particularly convoluted Turing project, and the end-result was spending 2 months on a project called Bus Spotting (for lack of a better name). The project had two aims. First was to just interactivly explore GTFS data in certain ways. Drawing route shapes is misleading. What's the service look like on Saturday evenings? What if you only want to see routes with some minimum hourly or daily frequency? And exactly what stops do the five identically named variations of "Route 123" visit?
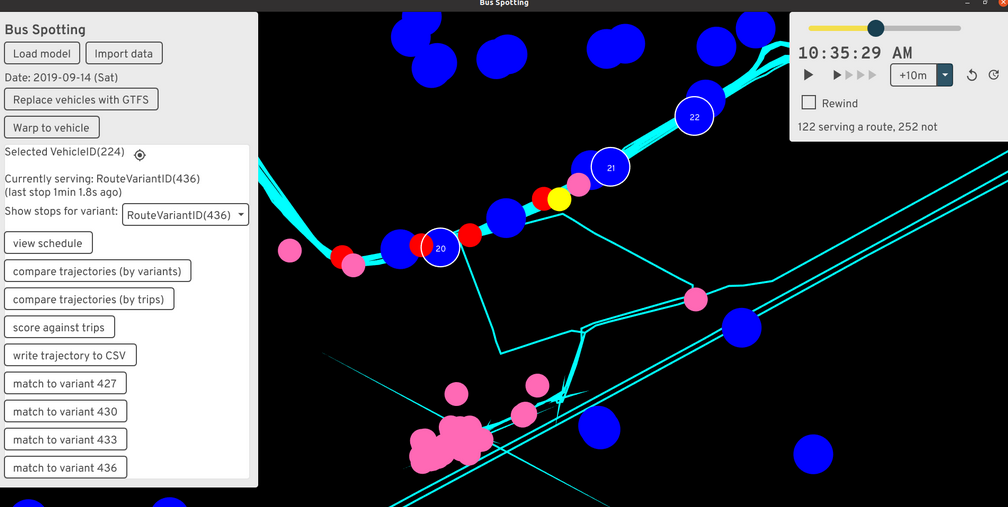
The second goal was much harder -- given real bus GPS traces and data from people tapping onto a bus, derive a bunch of useful dashboards to help bus operators. This sent me down the absolute rabbit-hole of matching up bus trajectories with GTFS routes. The trajectory data only hints at some possible GTFS route IDs the bus could be serving at the time; how to resolve them to specific GTFS trips (scheduled runs of a route variant)? The answer I came up with requires looking for when the trajectory passes close to the stops along a candidate route, then trying to stitch together stop times in a reasonable sequence. The result somewhat works, but in practice, some scheduled trips are skipped entirely, extremely delayed, or buses silently skip stops in the middle or end of a route.
I implemented the project on top of widgetry, the from-scratch UI library A/B Street uses. This was frustrating; it wasn't designed to do things like this, I dumped time into (unsuccessfully) making huge scrollable tables work properly, and the compile times were painful. Something with an interactive REPL would've been much easier to use. But while I worked on it (before summer 2022), I didn't know how to do anything on the web.
Technical reflections
I put off trying web dev for way too long. Part of the fear was all the frameworks and build tools -- there's no consensus what to use, everything is a little broken, and Googling anything turns into an afternoon of deciphering outdated StackOverflow answers.
But thanks to Ben walking me through the basics of vanilla Javascript in osm2streets, I've become comfortable enough to crank out a few simple web projects. I feel I've gotten my head around JS -- the DOM and being able to disorganizedly stick state anywhere felt very odd coming from a solid few years of Rust and Scala and "owning" the full-stack down to the event loop. CSS continues to mostly elude me; I'm clumsily stitching together examples I've seen before. I've just now started playing with Svelte and using pre-made component libraries, so maybe I'll never have to really figure out CSS!
Growing my toolbox like this lets me pick the right tool for the right job, and to make tools that more people are likely to use widely. As some of the sections below show, I think the way forward is to write complicated bits of backend logic in Rust, compile to WASM, and expose bindings to various places, especially JS and the web, where frontend logic is particularly fast to crank out.
ATIP and route snapping
The Active Travel Intervention Platform, co-produced with Robin, is my biggest web project so far. It's a very simple tool for data entry about new walking and cycling infrastructure. You can sketch a polygon and say there'll be some kind of LTN here, draw a crossing as a point or line, and so on. It's mostly just MapLibre with a drawing plugin and some convenience around auto-saving to local storage. ATIP will gradually introduce detail -- first get someone to sketch an intervention in 30 seconds, no effort. Then get more specific, possibly leveraging existing tools -- load that area polygon into the LTN tool and get specific. Or chop up a route and show specific changes to lanes / existing road-space, or where raised pavement will go for side roads.
The really fun new piece is route snapping. Drawing lines manually to trace along existing roads is tedious. I made a simple tool to do this in Ungap the Map last year, so at a hackathon one afternoon in Leeds, I split it out into its own simple Rust library and glued it up to MapLibre. (It's had considerable polish after that afternoon!) It's conceptually very simple, but I've not seen anything similar before. All other route drawing tools, like in Felt, work by repeatedly querying a server to calculate routes. If your connection is slow, it's a choppy experience. My plugin folows the A/B Street "everything is a file" approach and just loads once, then runs locally. Of course the study area is fixed, but... I have some ideas about that.
In late November, I joined a one-day hackathon by Department for Transport, and with a small team cranked out a simple web frontend to a new API they're developing. It was a great test of my comfort with webdev, to get something working in a day. I'm hoping to support its development going forward, by splitting out any hard problems into new modular libraries, like the routing tool.
New job
Alright, onto other reflections about this year. Taking a job at Turing was a huge (but very calculated) gamble on my part, after the freedom of working for myself for three years. I'm pleased how well it's turned out, and very excited at how the job is evolving. I'm very lucky to have found a program like Urban Analytics that so closely matches my interests and ethos.
One thing I really wanted to gain by taking a job and moving to London was recapturing the experience I once had at Google of working on a daily basis with people on the same project. Remote work has become normal for everyone, though, and my team is scattered around the UK. I have met so many awesome new people at the office and wound up collaborating with some of them, like Jennifer Ding.
I've had to get used to near-constantly attending conferences and having meetings; it's really worn me down a few points in the year. A few events this year have really stood out as worth the stress of preparing -- Geomob and finally meeting much of the OSM community at State of the Map.
Personally
I've wanted to move to London since December 2017 when I first visited with my sister. (That was the trip that started A/B Street, by the way.) I was very wary of hyping it up too much in my head and being disappointed when I got here. After a year, I can firmly say that fear hasn't manifested. I love living here. It's an unusual day if I don't hear a few different languages spoken walking around. I think I've fleshed out my mental map of haunts around Lambeth and Southwark thoroughly enough, but every week or so, still manage to get lost in some previously hidden estate. Walking around assaults my mind with new ideas for maps, for art, for things to notice. And the weather is far superior to Seattle. Making friends took more effort than I anticipated, but it's turned out quite alright.
I've struggled through a few things the past year, and one of the more visible is my off-and-on relationship with parkour. I moved to London about a year after my ACL surgery, and after a few cautious months of re-introducing bigger movement, tore again in March. That was a huge reset and sudden new demand of time and money to work on rehab and conditioning. I diligently did that for months and months, and... tore it again in early December. I really need something physically demanding in my life to balance all the computer work, and parkour so perfectly scratches itches for socializing, creativity, introspection, and exploring the nature of fear. But my knee hasn't keep up.

I also took a few trips this year. Visiting Taiwan was utterly fantastic. Last year I entered the Presidential Hackathon, and against all odds the in-person ceremony happened in October. This isn't the place to elaborate on that trip, but the ease with which I made new friends, wandered into bits of architecture that ensnarled me, and had ideas about transforming streetspace... I definitely want to spend much more time there.
Retrospective on the retrospective
I wrote last year's ~postmortem in a state of high emotion, while I was deciding whether to take a job that would've meant the effective end of A/B Street. I've become very accustomed to listening to my gut about decisions (and rationalizing later), but that one stumped me for a long time, because I didn't have enough information about the possible futures. The postmortem was a reflection on what I had experienced for 3 years, and in writing it, I realized how impossible it was to let go.
One of the main frustrations expressed last year was wanting real-world impact, users who very actively care about the project. Thank you so much to Sam and the rest at Bristol for finally offering that. If I have to wildly pivot 5 more times for the next such experience, that's fine, I'll have plenty of fun on the way.
What's next for 2023
And now for the ideas I'm excited to start soon! Aside from working on all these things myself, I also anticipate some logistic/organizational changes coming, but won't speculate much here. (Besides to say that capacity building in people around me and aggressively networking is a strategy that pays off more and more with time.)
Also, feedback welcome -- if you think I should be focused on something different, let's talk about it!
Technical debt
It's only natural that A/B Street has accumulated a bunch of technical debt -- the idea/goal has changed many times, I've learned a bunch in 3 years, and I don't really take an approach of polishing before moving on. But now it's worthwhile to whittle down some problems that keep resurfacing. We've been doing this in osm2streets and it's really paid off there.
Most urgent is the save file format. When you edit something in A/B Street and try to load the edits many months later with a new version of the map, it often breaks. I hoped matching to OSM IDs would suffice and that upstream roads wouldn't be split that often, but that's just not true at all. A better strategy would be something like SharedStreets, identifying roads with GeoJSON coordinates and always doing map matching/snapping. There are other complications when lane data being fixed in OSM, but someone's edits being based on older, incorrect basemap data.
The second ever-growing problem is blockfinding, the process that partitions a map into 2D polygons in between roads. The LTN tool only works when you can define neighbourhood boundaries the way you want. Bridges, tunnels, and splitting a boundary based on water and large parks all cause complications. I want to overhaul this idea and just treat everything as planar graphs, letting people draw boundaries however they like.
The geom library is also increasingly problematic. It's somewhat based on
georust, but adds a bunch of poorly tested and
frequently buggy behavior on top. It also attempts fixed-precision math poorly
by trimming floating points, and this doesn't interact well with validity
requirements for line-strings to not repeat points.
There are also smaller refactoring ideas that, if solved reasonably, could vastly simplify lots of code: updating the URL across apps, handling interactive object on the canvas, and letting users manage saved objects consistently. These're things that an opionated web app framework or game engine might solve. A/B Street effectively acts a bit like both, and so needs to help with these.
Polishing / reviving existing apps, not starting new ones
Last year, there was an obvious new niche to leap into -- designing LTNs. I don't think anything's "missing" from A/B Street right now -- aside from public transit (but again, I'm not touching that yet). Instead, I want to refine existing ideas.
Ungap the Map and the LTN tool provide complementary ways to improve cycling. An LTN is limited without main road interventions and new crossings. And sometimes cycle routes need not follow the main road. Maybe the two apps should be combined?
I'd also like to revive the 15-minute neighbourhood tool. I thought it'd be less relevant in the UK, where mixed-use zoning and higher density are normal. But Turing has a few people calculating connectivity and accessibility to various resources (green-space, jobs, hospitals, schools). I see the same types of technical problems being solved repeatedly, and am curious about potentially generalizing the 15m tool to help.
Notably absent from this section is the traffic simulation. I "deprecated" it a few months ago. I don't really want to touch it again until the map model is much more accurate (osm2streets) and travel demand models are decent see below). Eventually I'd like to revisit many ideas in the simulation -- coarse-grained turn conflicts, lane-splitting and "ghost bikes", lane-changing, priority between pedestrians and vehicles -- but not anytime soon.
Improving OSM data
A/B Street is very much bottlenecked on what OSM contains. osm2streets is evolving to work around limitations in the representation (things like fake geometry where dual carriageways split), but lane tagging also needs to be improved. I want to polish the lane editor and incorporate the idea in existing editors like iD and JOSM, to make it easy to visually edit lane configuration.
There are other types of data important to A/B Street, like crossings. Inspired by the MapComplete and Every Door, simple new editors dedicated to correctly tagging other pieces of active travel infrastructure might be the approach.
ATIP and OSM conflation
In many ways, ATIP is a much less detailed version of A/B Street, designed for large-scale areas. This project will evolve and morph quickly next year as requirements change, so I won't speculate much about it.
But there is one really hefty technical challenge I'm excited about. Government authorities need a verified source of infrastructure data, and in many cases maintain their own separately from OSM. At the same time, they want to leverage the power of OSM. There are projects like this in London to conflate datasets, generate understandable diffs, and assist humans in fixing errors in either direction. These're problems related to brittle savefiles. I have some ideas in this space.
Scaling everywhere
The A/B Street ecosystem is predicated on using a single file that covers some specific study area. That approach mostly works, but there's more friction as people just rely on the web version. Importing dynamically on the web is possible, but it'll be a slow experience. I'd like to continue some initial experiments around tiling and lazily importing and caching areas.
Census and travel demand models
In March I gave a talk about ideas for producing reasonable demand models for anywhere in the world, starting with widely available data. 2023 is finally the time to start working on this.
The first piece is aggregating census data from various sources -- WorldPop as a fallback anywhere in the world, more specific datasets in some places. Then to distribute the 500 people to specific origins within a zone, using some basic guesses from OSM building tags. And in some places, configure better guesses with Colouring London, OpenAddresses, or similar.
A second piece is extracting weighted destinations for trips for various purposes. Something like osmox might already get the job done. Sometimes there might be region-specific data, like a number of students per school, or trip rate tables that've been calibrated.
Besides producing travel demand models for A/B Street, these two components have wider uses. A typical analysis of a new bus route will ask how many people (with certain occupation and vehicle ownership characteristics) live near bus stops? Half of this question is about isochrones and the street network, and the other half is about the population.
In the same way OSM makes it possible to get a transportation network of decent quality anywhere in the world, I want the same for population data. Plugins are the key. Somebody can do the work of finding, cleaning, and converting data for some particular country once, and just hook it up to common infrastructure for visualization and analysis. Over the past year, I've met different groups with expertise in calibrating demand models to real traffic count data, modeling future population growth, and statistically assigning individual-level attributes from census data. Many of these groups are duplicating part of their effort. I want to bring them together and let people specialize on their strengths.
Experimenting creatively
I originally learned programming by making games, and I'm still convinced I need to scratch creative itches that build up. Even if nothing comes from it, I really enjoy experimenting with something new with zero pressure to make something "useful." I've been playing around with Bevy recently to explore some old ideas about 3D map rendering. Maybe some of that could transfer over into an existing project someday. (My interest in Bevy was sparked when Matthieu started porting part of A/B Street to it!)
Some more stray thoughts: just using building data and road center-lines, approximating road width is possible in some places. I enjoy discovering narrow little footpaths around Lambeth, and figuring out how to chain together the longest possible circuitous route without seeing a busy road -- maybe there's a variation of Dijkstra's algorithm to automate this? When I visit new places, I try to just navigate intuitively and by direction, but sometimes small streets force me out onto main roads and I check my phone. Is there a graph theoretic property formalizing this? How many variations of quiet routes are possible in very gridded cities, and what're the bottlenecks that all routes are forced to cross? And inspired by Footways London and Nate Wessel's maps, I have some ideas for maps that emphasize what's important for people moving around without a car.
I don't know if these are useful diversions, but I'd like to spend a bit of time on them and see what happens.
Conclusion
This retrospective took me a month to write, and I'm glad it's over, so I can go jump into some subset of the ideas outlined. I'm really thankful to everyone I've met and worked with this year, and look forward to the next steps.
CHANGELOG
Every time I upload a new binary release, I'll list major changes here.
0.1.0
- First binary release
0.1.1
- drawing arrows better
- start with a splash screen, make it easy to change maps in-game
0.1.2
- totally revamp GUI by organizing everything into distinct gameplay modes
0.1.3
- new warp tool that autocompletes street names
- hideable menus, place context menus better, remove top menu bar, add a simple OSD
- loading screens reflect what's printed to the terminal
- depict pedestrians and bikes with more detail
- tool to scroll through an agent's route
- make simulation speed controls actually work
0.1.4
- improve stop sign editor UI (toggle entire roads)
- better mouseover / selection rendering
- better traffic signal rendering (show time left, use outlines for yields)
- make cars actually stop and briefly wait at stop signs
- improve edit mode diff visualization (cross-hatching)
- render actual stop signs, not just red lines
- fix intersection policies confused by conflicting straight turns with lane-changing
- fix mac scrolling
- better turn indicators
- nicer unzoomed view of roads, with different colors for big/small roads
0.1.5
(release file size jumped from ~15MB to ~70MB because of new PSRC trips)
- improve UX of intersection editors
- define a better set of maps included by default
- improve drawing speed by batching more stuff
- better default traffic signal policies for many cases
- import and visualize census data
- fix missing sidewalks on downtown one-ways
- import and visualize PSRC trip data
0.1.6
- slider widget for controlling time and speed
- fixing bad polyline geometry in most cases; visualizing routes should no longer be buggy
- handle PSRC trips that begin or end out-of-bounds
- draw agents in unzoomed mode in a way simpler way
- improve edit mode: detect reverts to original, easier lane type switching
- lots of fixes for buses: handle edits better, read sequence of stops correctly from GTFS
- set up A/B tests faster
0.1.7
- bulk and revert tools in edit mode
- improve turns and default intersection policies when bike/bus lanes involved
- new tool to manually hint for short roads and weird intersections. some problems have now been manually fixed
- scoreboard of trip results for sandbox and A/B test mode
- reduce lag when sim is running at full speeds, but system is too slow
- switch to easbar's contraction hierarchy crate, making all pathfinding INSANELY fast
- remove weird rules about the world freezing when traffic signals are in "overtime"
0.1.8
- edit mode: convert to a ped scramble cycle, simplify stop sign editor by removing individual turns
- ui: put labels next to sliders, organize modal menus into sections, add a minimize/maximize icon
- A/B test mode: savestate, include time controls and agent following/route tools here
- use more OSM data for turn lanes, turn restrictions from lanes, turn restrictions between entire roads
- dont attempt to cross a traffic signal if there's absolutely no hope
- improve bus route UI tools and make routes using transit more sane
- user-defined shortcuts for jumping between views of a map
0.1.9
- sliders to pick times in wizards
- fix hidpi scaling
- traffic signal diagram scrolls properly
- easier to instantiate a scenario, show all trips involving a building for a scenario
- colorschemes to show trip duration or time blocked
- label buses with route number
- represent overlapping pedestrians as a labeled crowd
- massive performance boost via real priority queue
- prevent cars from "blocking the box"
- prevent all? aborted trips (due to parking blackholes mostly)
- smarter roam-around-for-parking router
0.1.10
- sim
- parking in off-street garages and on-street lanes on the off-side of oneways now mostly works
- detect and handle parking blackholes; cars should never get stuck looking for parking now
- let lower-priority turns happen at traffic signals when higher-priority ones blocked
- get closer to FCFS ordering at stop signs
- basic opportunistic lane-changing
- a bus should be seeded for every route now
- demand data
- show trips to/from buildings and borders
- make PSRC trips seed and attempt to use parked cars
- UI
- different heatmap overlays, like parking availability and busiest areas
- show colorscheme legends when relevant
- interactively seed parked cars, spawn more types of trips
- fix major A/B test mode bug (mismatched scenarios and map edits)
- adjusting sliders, menu placement, dynamic items
- consolidating different tools into a single info panel for objects
- bus route explorer shows entire route, current bus location
- map quality
- degenerate intersections only have one crosswalk now
- revamped the map editor for fixing geometry problems, used it in many places
- nicer yellow center lines (dashed when appropriate)
- handling OSM turn restriction relations properly
- fix empty traffic signal phases
- handling bike lanes on certain sides of the road
- starting to upstream manually-verified parking lanes into OSM
- new gameplay: reverse direction of lanes
0.1.11
- small UI fixes: fixed width traffic signal diagram, skip info phase of menus when empty
- start drawing (but not using) shared left-turn lanes from OSM
- fix OSM polylines with redundant points (fixing an issue in ballard)
- improved traffic signal policies in some cases
- started upstreaming some sidewalk tags in OSM to fix inference issues
- fixed misclassified right turns
- adjusting map colors
- handling lakes/ocean polygons from OSM way better
- reorganized sim analytics, added stuff for bus arrivals
- adding new internal road points to map editor. almost ready to really aggressively use it
- skipping parking lanes with no nearby sidewalks, since they're unusable
- fix z-order of bridges/tunnels in unzoomed view
- allow unzooming indefinitely
- move lots of sandbox mode controls (and other modes) to menus under buttons and dedicated buttons
- basic support for marking a lane closed for construction
- improved geometry of sidewalks at dead-ends
0.1.12
- reorganize everything as different challenge modes. start implementing 3: optimizing a bus route, speeding up all trips, or causing as much gridlock as possible
- improved bus route explorer
- some UI fixes (popup messages in a few places, moving mouse tooltips to the OSD)
- lots of analytics and time-series plots
0.1.13
- analytics: prebake baseline results properly. hover over plot series. some new modes to see bus network, throughput of a road/intersection over time
- log scale for the speed slider
- add a bulk spawner in freeform mode (F2 on a lane)
- rendering: nicer routes, crosswalks, zoomed car colors
- map data: better stop sign and sidewalk heuristics
- fixed the mac hidpi text rendering issue once and for all?!
0.1.14
- better crosswalk generation when there's only a sidewalk on one side of a road
- edit mode UI revamp: paintbrush-style buttons to apply changes to lanes
- show error messages and prevent edits, like disconnecting sidewalks
- properly ban bikes from highways (revamped rules for vehicles using a lane)
- new freeform mode tool to spawn bikes
- WIP (not working yet): make bikes prefer bike lanes. some debug heatmaps for path cost
- edit mode has proper undo support
0.1.15
- minor bugfixes with reverting lane types, preserving stop signs
- incorporate edits into the challenge splash screen, make sure edits are reset when appropriate
- starting a new challenge mode, just focused on traffic signals
- can't leave traffic signal editor with missing turns
- render pedestrian crowds on building front paths
- traffic signals support an offset parameter
- traffic signal visualization and editing revamped to group related turns together
- can preview traffic using a signal from the editor
- actually apply priority at intersections, so protected turns get first dibs over yield turns
0.1.16
- fix Mac crashing with texture limit bug by switching to texture arrays
- fix crashing simulation when a border intersection was used
- started to implement a new UI design for starting the game
0.1.17
- more work on the pre-game UI, with some flexbox layouting
- prototype a minimap in sandbox mode. doesn't pan or scroll yet.
- prototype a new speed/time control panel from the mockup
- nicer time warp loading screen
- record and show detailed trip timeline, including time to park
0.1.18
- map data: infer more building addresses
- some analytics on how long people spend parking and intersection delay over time
- create an options panel, allowing runtime customization of color scheme, traffic signal rendering, etc
- internal changes to map building pipeline to make it much easier for new devs to onboard
- organizing challenges into sub-stages, starting to flesh out specifics for the fix traffic signal track
- much more realistic pedestrian pathfinding
- fix minimap on mac (dpi issues)
- visual tweaks to cars to make front/back easier to distinguish
- internal change to switch most assets from PNG to SVG
0.1.19
- some challenge modes show a histogram for counting faster/slower trips
- new visualization of current demand per direction at a traffic signal
- implementing some of Yuwen's UI changes: agent counter, split time/speed panel, moved functionality out of the old drop-down menus into a bottom-left tool panel, hiding debug functionality
- replaced right-click context menus with left click to open info panels
- fixed random issues reported by people from HN
0.1.20
- moved some UI functionality around, pulling graphs into info panel
- interactive legend for the minimap, toggle visibility of different agents
- nicer colors and shapes for cars
- misc simulation bugfixes that might help huge_seattle
- pedestrians choose to use transit more realistically, factoring in time for the bus to drive
0.1.21
- switch some analytics dashboards to use buttons, not old non-scrolling menus
- scrollbars... at least a start
- preview traffic signal changes from live sim as the base
- traffic signal preview has normal time/speed controls
- traffic signal editor has undo support
- minimap has buttons to pan
0.1.22
- minimap zoom controls
- traffic signal rendering overhaul
- heatmap colors improved, heatmap appears on minimap
- bus info panel, a start to live delay analytics
0.1.23
- UI revamps: speed panel, minimap controls, heatmap chooser
- bus timeline
- hide internal IDs normally
- limit map zoom
- fix bugs with crosswalks conflicting with vehicle turns
0.1.24
- overhaul traffic signal editor UI, and add redo support
- update main edit mode UI, and add redo support
- limit max unzoom
- fix the infamous HiDPI bug once and for all; minimaps should work everywhere
- almost bug-free support for floating, horizontally and vertically scrolling panels
- overhaul top-center panel, rename scenarios to be less confusing
- expose bus analytics outside of challenge mode
- live info panel can exist during a running simulation
- consolidated agent route/trip information into info panel
0.1.25
- overhauled the tutorial
- tuned top-center panel for sandbox and challenge modes
- make bike and bus lanes more obvious
- show map edits as an overlay anywhere
- tune info panel contents, and show relationships between parked cars and buildings
- fixes to traffic signal editor, like making all-walk conversion idempotent
- nicer throughput and delay plots (sliding windows, grid lines)
0.1.26
- tutorial improved in a few places
- map data: thinner sidewalks, associate buildings with named amenities
- traffic model: vehicles can spawn on all lanes from a border
- much better gameplay speed (previously was too fast)
- UI tuning: lane editor, minimap, signal editor, heatmap legends don't overwrite minimap
- traffic signal challenge communicates score more clearly
0.1.27
- edit mode revamped: click to edit stuff. no more lane paintbrushes. autosaving and save as.
- tutorial: can quit and resume tutorial now
- challenge picking flow simplified
- UI: layouting fixes to full-screen / into stuff, popup menus go beneath buttons, plots improved
- internal change to render all text using vector graphics. other than a few text layouting issues, shouldn't be noticeable, except now tooltips in plots don't get covered up
- misc perf improvements (cache SVGs, drawing many circles for unzoomed agents, dont reload prebaked data)
- upgraded winit, glutin, glium -- hopefully no new bugs introduced on any platforms
0.1.27a
- patch to fix a crash with empty text dimensions on things like building info panels
0.1.28
- all info panels revamped
- some tutorial stages are much more clear, with an updating goal
- traffic signal scorecard generalized to work for some tutorial too
- adjust how selected agents look
- X button on popup menus
0.1.29
- new tool to convert between stop signs and traffic signals
- lane editor easier to edit multiple lanes
- info panels: IDs, mostly avoid horizontal scrolling, better info about trips to/from somewhere, move buttons up
- traffic signal editor UI overhaul
- different data in top-right agent meters panel
- tooltips to communicate keybindings better
- new jump-to-time panel, showing when rush hours occur
- speed controls use more useful speeds
- include ongoing trips in measured trip times
- jump to next challenge after completing one
- lots of tutorial tweaks
0.1.30
- show additional info about traffic patterns and buggy maps
- revamp tutorial UI to group tasks and messages better
- handle different mode transitions when info panel open on an agent
- select entire roads in unzoomed edit mode
- show total time an agent has spent moving / blocked
- use 2-phase traffic signals by default, making the 23rd map successfully complete!
- jump-to-time now optionally points out traffic jams forming
- challenge splash screen improved
0.1.31
- overhauled trip timeline in agent info panels
- overhauled traffic signal details panel and the per-lane turn explorer
- settings page: show all options at once. add way to scale up text/UI elements for high-DPI displays, and an alternate pan/zoom control scheme
- traffic signal edits can now be exported and used in any slice of Seattle. will be using this to hand-map many of them.
- many small tutorial fixes
0.1.32
- some UI work on giving focus to textboxes, improving dropdown menus
- road/intersection plots display baseline sim data too
- start associating people with multiple trips, exposing this a little in the UI
- bring back elevation data, introduce a new overlay. the elevation data is still really bad.
0.1.33
- new "population" overlay, showing people (not just current trips). heatmap and dot map to visualize.
- improved the "delay" overlay to handle roads and intersections
- removed the confusing and useless alternate color schemes for agents
- initial left-hand driving side, tested in Perth, also drawing more arrows for all one-way roads
- loads of internal GUI code refactorings, preparing for a standalone release of the library
- fixed z-buffering and alpha values for web backend
0.1.34
- info panels have been totally overhauled again. multiple tabs, way more clear representation of agents, trips, and people.
- draw people inside of a building
- applied consistent typography everywhere
- lots of internal refactoring
0.1.35
- more info panel work, particularly for trips and buses. change plot settings live.
- prototype of a SEIR pandemic model based on time spent in shared spaces, by orestis
- slight heatmap improvements, more coming
- more typography changes
- mouse cursor now changes for buttons and dragging!
- overhaul minimap controls, make layers behavior zoomed in a little better
- new speed panel and jump-to-time modal
0.1.36
- overhauled simulation data page, with a table to find slow trips and some initial summary visualizations
- plots can change windowing and show/hide series
- layers: fade map to contrast more, better scales/legends
- show relative trip times in info panels
- tools to rewind/ffw to watch particular trips
- refocusing efforts on challenge modes; level 1 of a new one is pretty much ready
- some simulation fixes around parking and a corner case of cars temporarily forming a cycle
- orestis improved the population/pandemic heatmaps
0.1.37
- optimize commute challenge: high score, live sentiment, second stage
- parked cars are owned by people, not buildings
- info panel improvements for trips
- bike layer suggests places where bike lanes could be helpful
- many improvements to scatter plot
- a new histogram-ish thing for understanding faster/slower trips
- handling scenarios longer than 24 hours better (for pandemic model)
- prototype of commute visualization, grouping buildings by blocks
- sim bugfixes: crosswalk / vehicle turn conflicts, start bikes in bike lanes from borders
0.1.38
- major internal changes to ensure people's schedules don't have impossible gaps, to associate fixed bikes/cars to a eprson, handle delayed starts to trips
- parking changes: show path to closest free spot, utilization of a lane over time, every building includes at least 1 offstreet spot by default
- progress on removing unrealistic gridlock: detect turn conflict cycles and temporarily allow conflicts, trim last steps of a laggy head
- internal sim alert system. speeds up debugging, could be used for player-facing "traffic jam!" alerts
0.1.39
- switched to proper OSM-based maps; no more brittle, manual geometry fixes
- more sorting and filtering options in trip table and parking overhead tables
- improve offstreet parking rendering. park closer to destination buildings
- easier process for importing new cities. introducing Los Angeles, Austin, Barranquilla.
- new data updater tool so people can opt-in to new cities
- many internal fixes to prevent gridlock. smarter cycle detection, manual OSM fixes and traffic signal timings
0.1.40
- differential throughput layer to understand routing diversions
- map edits now reference longer-lasting OSM IDs, can work cross-map
- basemap updates: new areas for west seattle, mt baker, lots of upstreamed fixes in OSM and traffic signals, smarter border matching
- parking: optionally filter on/off-street spots in the layer, allow disconnecting spots via edits
- render some tunnels with lower opacity
- new feature to change speed limits and bulk road selection tools
- first write-up of a real use case (closing lake wash through arboretum)
- make the traffic signal challenge act like a game, with a failure/win state and scoring
0.1.40a
- added a mode to map parking
0.1.41
- new parking mapper tool
- include a one-shot .osm importer in the release
- new layer to find different types of amenities / businesses
- adjust traffic signal rendering style
- bulk lane editor for changing speed limits and lane types
- including west seattle and udistrict maps
- include some OSM buildings that were being skipped
- dont pause after opening something from sandbox mode
- adjust turn signals for lane-changing cars
- lots of fixes for monitors with different DPIs, enabled by default
0.1.42
- many misc UI bugfixes, especially for high-DPI screens
- managing turns across multiple nearby intersections: tool to visualize, handling multi-way OSM turn restrictions, using this to ban illegal movements at the pathfinding layer, starting a traffic signal editor variant to edit these
- rendering improvements: unzoomed agent size, visualizing routes on trip table, transparent roads beneath bridges, draw harbor island
- overhauled street/address finder
- parking mapper: shortcut to open bing
0.1.43
- new map picker!
- UI polish: traffic signal editor, layers, bus stops, delay plots
- generate more interesting biographies for people
- tuned all the map boundaries
- fleshing out lots of docs in preparation for the alpha release...
0.1.44
- spawner UI revamped
- model parking lots! and finally model public/private parking
- fix up tutorial
- starting a story map mode
0.1.45
- overhauled challenge cutscenes and hints
- traffic signal challenge: fix score detection, add meter, much faster startup, no reset-to-midnight required
- layers: use gradient for a few, delay comparison, new UI for picker
- overhauled minimap controls, should be intuitive now
- edit mode changelist UI started
0.2.0 (alpha launch)
- road names now shown by default, in a new style
- all layers now use gradients and show up zoomed in. worst traffic jam layer revamped.
- scatter and line plot improvements
- internal UI fixes: proper word wrap
- bugfixes for following people riding the bus
- rainbow crosswalks in one neighborhood
- final polishing for launch
0.2.1
- busy week due to launch, but many new features in the pipeline
- many bug fixes
- edit mode: proper autosave, load proposals, jump between lane/intersection editors
- very first steps on light rail... importing the tracks
- starting a new traffic scenario modifier system, to repeat entire scenario or outright cancel trips for some people. many more ideas for filters and actions coming soon.
- starting to represent private roads
- add a very simple actuated traffic signal
0.2.2
- the default traffic signal configuration is much smarter now, handling roads with some sidewalks missing and automatically synchronizing pairs of adjacent lights
- much faster startup time for large maps
- better UX for handling unsaved edits
- access-restricted zones: changing existing zones almost completely works, except for granting new access to pedestrians
- new sidewalk corner rendering, more rounded
- ui style standardized for margins, padding
- Javed got camera panning when your cursor is at the edge of the screen to work; enable it in settings
- pulling bus stop/route info from OSM, not GTFS. steps towards light rail.
- experimenting with controls for hiding bridges to see roads underneath; try them in dev mode (ctrl+S)
- many bug fixes
0.2.3
- lane geometry is dramatically fixed, especially for one-ways
- importing lanes from OSM improved
- UI: bulk select includes select-along-a-route, show all bus routes in the layer, unzoomed zordering for roads/intersections
- traffic scenario modifier can now convert trip modes
- slight progress on light rail, although the train only makes one stop
- vehicles moving through complex intersections with multiple traffic signals will now make it through multiple lights, even if they're unsynchronized
- new random traffic scenario generator that makes people go between houses and workplaces
- access-restricted zones: granular editing of individual roads now mostly works
- removing the hardcoded relative directories, which many people have been having problems with
- many many bug fixes, and some optimizations to reduce release file size
0.2.4
- bus/train routes overhauled; they're now one-way, regularly spawn every hour, and may begin or end at a border
- new commute pattern explorer tool
- new character art to give cutscenes a bit more personaliy
- some progress on gridlocking maps, both from manual fixes and an attempt to reduce conflicts in multi-turn sequences
- misc UI: show cars seeking parking in unzoomed mode, plot arrival rate at border intersections, consolidate bulk selection controls
- trips modified by an experiment can now be filtered in summaries
- buses, trains, and passengers on them are now properly distinguished in different stats
- include krakow and berlin in release
- buildings with holes in the middle are now rendered properly
0.2.5
- cars pick lanes better
- overhaul bus/stop/route info panels
- UI: better autocomplete, commuter pattern improvements by Michael, toggles instead of checkboxes, contours for heatmaps, edit mode loader revamp
- internal refactors: turn creation, osm tags, osm parsing
- import living streets from OSM as restricted-access zones, and other importer tweaks for berlin, krakow, san jose, sydney
0.2.6
- many roads without sidewalks now have a tiny shoulder lane, still enabling pedestrian movement, but with a penalty
- bike trips will stop/start at a better position along the sidewalk now
- support parking lanes on the off-side of a one-way
- UI: search by building names, commuter patterns shows borders better
- transit: make people ride off-map, spawn buses on short roads
- internal cleanups for buttons
0.2.7
- many intersections with on/off ramps have much better geometry
- lane-changing banned on turn lanes
- lots more work matching bus stops/routes to the map. some progress, also some regressions.
- fixing spawning on tiny borders
- bus spawn rates from GTFS for seattle. started an editor for the schedule.
- internal ezgui refactorings
0.2.8
- multiple traffic signals can now be synchronized and edited together
- new dashboard for "traffic signal demand" over the entire day and map
- started experimenting with controlling the headless runner via a JSON API
- epic ezgui fix by Michael to consolidate handling of HiDPI scaling
- got a bunch of huge cities importing and loading quickly
- you can now save the trips you manually spawn in freeform mode, then replay them later
0.2.9
- import Xi'an, add a Chinese font, and add a tool for that group to import their external demand data
- control A/B Street through a graphics-less API, with a Python example
- improve UI for per-direction traffic signal demand
- on/off ramp geometry fixed in a few more cases
- fix some missing parking lot aisles, handle parking lots with 0 spots, and extract parking garages from OSM
- switch road/building language in settings, if OSM data exists
- congestion capping prototype: declare a max number of vehicles that can pass through a zone per hour, view/edit it, and very simple implementation in the sim layer
- add custom-drawn trips to the main scenario, for exploring new demand from a new building
- mkirk fixed up the glow/wasm ezgui backends, letting us remove glium
- make map edit JSON backwards compatible
- better lane/turn markings
0.2.10
- two-way cycletracks and arbitrary direction changes for roads
- fix map editing for lane reversals, make edits backwards compatible, and massively speed up applying edits
- fleshing out the headless API and tooling for controlling the simulation from any language
- import a few more places, redo left-hand driving support so far
- various bug/performance fixes
0.2.11
- disabled support for editing the map without resetting the simulation. needs more work, but solid start.
- improvements to API, activity model, congestion capping
- small UI tweaks for parking, editing multiple signals
- fixed last bugs for left-handed driving, should work just as well now
- lots of graphics experiments from the hackathon, not merged yet
0.2.12
- new textured color scheme and isometric buildings, in settings
- new layer to show how far away people parked
- Massive UI overhauls: jump to time/delay, edit mode, traffic signal editor (now with offsets), lane editor, bulk lane edit, traffic signal demand (individual intersections and all), loading screen
- the Go API example compares trip times and detects gridlock
- infinite parking mode
- show how long a car has been parked in one spot
- bugfix for some pathfinding costs around uber-turns
- start to show a trip's purpose
0.2.13
- alleyways from OSM imported
- traffic signal minimum time now constrained by crosswalks; thanks Sam!
- UI changes in progress for trip tables, summaries, bulk edit
- more API / Python example work for congestion capping
- bug fixes: isometric buildings, documentation links, dropdown widgets, turn restrictions
0.2.14
- improve turn generation, with goldenfile tests
- UI adjustments: unzoomed routes, better delay layer, include reasons for cancelled trips, throughput layer counts
- small map importing fixes: multipolygon parking lots
- fix infinite parking and blackholed buildings
0.2.15
- large internal change allowing asynchronously loading extra files over HTTP for web
- the release of the first web version!
- cars looking for parking now have a "thought bubble" showing this, by Michael
- slow sections of a trip are now shown in the info panel, by Sam
- fix by Michael for handling window resizing in panels
- fix original routes on edited maps
- internal code organization and documentation
0.2.16
- UI: click unzoomed agents, switch between metric/imperial units, show reason for cancelled trips, new "faded zoom" color scheme based on mapbox, more detailed agent counts in the top-right panel's tooltips
- started a new dedicated OpenStreetMap viewer, will split out from A/B Street later
- fix alpha colors on web
- bugfixes for the new asynchronous map loading
- some substantial simulation performance gains (168s to 90s on one benchmark!)
- lots of progress towards editing the map without resetting the simulation to midnight. please test with --live_map_edits and report any issues
- internal refactoring and code documentation
0.2.17
- tooling to automatically extract different shapes around cities without an explicit bounding polygon
- imported many maps for an OSM viewer demo
- misc bug fixes, UI tweaks, and perf improvements, especially for the web version
- start using OSM sidewalks data properly in krakow -- more work needed, but better start
0.2.18
- overhaul data/system management: switch from Dropbox to S3, reorganize files, add an in-game updater
- started a UI for collision dataviz, with data in the UK and Seattle
- improve turns between separate footways
- simplify the process of importing a new city
0.2.19
- added experimental day/night support; run with --day_night
- slight performance improvements by avoiding applying no-op edits
- new tests for lane-changing behavior, used to more safely allow more realistic behavior blocking "degenerate" intersections
- experimenting with filling in gaps between one-way roads, to represent medians
0.2.20
- prototyped a new 15-minute neighborhood tool
- overhaul internal simulation input code -- better performance, way simpler
- debug tool to record traffic around a few intersections and replay later
0.2.21
- split separate tools into their own executables
- misc bug fixes and other refactoring, focused on GUI code mostly
- most of a prototype done for an experiment
- map added for north seattle
0.2.22
- vehicles will lane-change less erratically during uber-turns (sequences of turns through multiple traffic signals close together)
- debug mode has a "blocked-by graph" tool to understand dependencies between waiting agents
- try multiple OpenGL video mode options if the first choice fails (thanks Michael!)
- refactoring trip starting code and the minimap
- non-Latin fonts now supported on web too, thanks to rustybuzz release
- new small maps in Seattle included in the release, and NYC added to optional cities
- saving some player state on the web (mostly camera position per map, for the main game)
- partial prototype of a new census-based scenario generator, thanks to help from the Amazon SSPA hackathon
- significant progress on the experiment, about one week left...
0.2.23
- released the 15-minute Santa experiment!
- trip info panels now show more continuous progress along a route
- fixing inactive buttons stretching too much
0.2.24
- variable traffic signal timing, thanks to Bruce
- 15 min explorer: more walking options (require shoulders, change speed), more organized business search
- 15 min santa: remember upzoning choices
- misc bugfixes and refactoring
- 2021 roadmap drafted
0.2.25
- huge breakthrough on merging intersections to handle short roads. applied to just a few places so far
- support one-way roads with default traffic signal heuristics
- 15 min explorer: find residences close to user-specified businesses, see unwalkable roads
- bugfix from Bruce to prevent sim from crashing when a short road is over capacity
- automatically fetch census data for any US map and use for scenario generation, from Michael
- some initial experiments to bring A/B Street's lane rendering to the web using Leaflet
0.2.26
- dramatically improve initial web loading and be able to start with any map
- city picker UI now better organizes other regions with many maps
- new tool to convert SUMO networks into A/B Street maps
- taking screenshots of the entire map now much faster, portable. trying to use for Leaflet raster tiles, but not working yet.
- widgetry UI library now doesn't depend on anything specific to A/B Street
- internal refactoring for error handling
0.2.27
- dramatically speed up starting scenarios by deferring when public transit riders pick their route
- start importing separate cyclepaths and pedestrian plazas for Cambridge, many adjustments to make these start working
- full panel for picking a scenario to start
- import trip data from the actdev project for Cambridge
- improve inferred map elements (stop signs and crosswalks) near short roads
- heuristics for automatically finding and merging short roads. disabled, but solid start
0.2.28
- massive button overhaul by Yuwen and Michael
- the color scheme automatically switches between day/night based on simulation time!
- significant progress on editing the map without resetting the simulation
- various bugfixes, new maps, improvements to running the importer, faster updater
0.2.29
- new map, Rainier Valley, is the 3rd ever to finish without gridlock! One of the fixes was collapsing traffic circles into a normal intersecton
- bugfixes for map importing: cycleways with left-handed driving, matching traffic signals, odd number of lanes, u-turns
- further fixes after the great button refactor
0.2.30
- split documentation into a separate git repo
- UI: filter throughput layer by mode, render stop signs better
- started a debug tool to live-tune routing parameters and see the effects on a single route or all trips
- Michael improved the web loading screen and added webgl1 support for ios browsers
- cars looking for parking now randomize a bit, eliminating the unrealistic "parking snakes/parades" effect
- Bruce fixed a critical bug with uber-turns, helping ease gridlock in some maps
- new tool to procedurally generate houses along empty residential roads, useful when OSM is missing most data
0.2.31
- loads of work integrating abstreet with the actdev project, and importing tons of maps
- new tool to find the geofabrik OSM source best fitting a boundary
- fix crosswalks and traffic signal policies in left-handed driving countries
- fix initial zoom when starting with flags to copy the viewport from OSM
- Bruce added lagging green signal heuristics
- make it easier to click tiny bikes and pedestrians
- change the URL in the web version as you change maps/scenarios
- split the list of cities by country, and improved the UI for picking a place
0.2.32
- easier to share web URLs with the current viewport
- more actdev integration work
- misc bugfixes, especially with uber-turns and the city picker UI
- revived the map_editor tool for drawing small test maps and iterating faster on merging intersection geometry
0.2.33
- import service roads and separate cyclepaths in all maps!
- brand new day theme, designed by Yuwen and implemented by Michael!
- improved rendering where sidewalks and shoulders of roads meet
- fix overlapping panels on HiDPI screens with low resolution
- prototype of loading abst in the background on a webpage
- adjusted routing, penalizing unprotected left turns onto bigger roads, which often contribute to gridlock
- fixed some turn restrictions at merged intersections
- widgetry: change fonts mid-line, dynamically load extra fonts (for a Taipei map)
0.2.34
- new travel demand generator using UK origin/destination data
- the 15m and OSM viewer web apps also have nicer URLs now
- 2 more seattle maps complete without gridlock!
- less seattle maps bundled with the release by default, to keep file size sane
- many UI changes for the actdev integration, pending rollout to abst generally
- initial experiments with implementing lane over-taking and road-based pathfinding
0.2.35
- vast improvements to roundabouts, gridlock, and ordering at stop signs
- consolidated UI panels in simulation modes; should work much better for smaller screens
- measure intersection delay more intuitively
- use straight lines for right/left turns at small intersections
- various bugfixes and small UI improvements
- started a tool to import from OSM without the command line; should be ready next week
0.2.36
- released a new tool to import anywhere from OSM from within the game!
- UI: finished trips meter, consolidated agent counters on minimap, move layers to the left for small screens, new tab style, use new day colorscheme in other apps
- fixed a bug with comparing the route somebody took before/after changes
- start integrating Eldan's elevation data and reviving parts of the UI that use the data
- better routing into/out of access-restricted neighborhoods
0.2.37
- import elevation data for Seattle!
- add layers showing steep streets, elevation contours, and show elevation profile for bike/pedestrian routes
- faster, simpler pathfinding for access-restricted zones
- faster map importer and some UI fixes
0.2.38
- change walking and biking speed based on elevation
- import elevation data for all maps -- though there may still be quality issues
- filter trip table by start/end location on the map
- Michael made the web deployment much more flexible, in preparation for a blog post
0.2.39
- massive internal change to make pathfinding use roads, not lanes. paves the way for many exciting things, like...
- changing the number and width of lanes per road! WIP, debug mode-only UI for now
0.2.40
- fix bugs running the importer
- import grid2demand scenarios from the UI
- implement more of road widening internals
- new --minimal_controls option by Michael for screencasts
- ran the first UX study in a long time, lots of feedback on the tutorial and traffic signal editor
0.2.41
- first prototype of the new road editor!
- much easier way to download new cities -- just try to open a map you don't yet have. much smaller .zip release now
- track two "risk exposure" events -- when cars want to overtake cyclists, and passing through a large intersection -- and start to show data on trip panels, a new "problem map" layer, and a WIP summary dashboard
- better geometry for some merged intersections, and applying the algorithm all around Tempe
- another UX study and some tutorial UX fixes
0.2.42
- improvements to experimental road editor
- 2 more UX studies and a slew of small fixes
0.2.43
- starting to import GMNS traffic signal timing. this will eventully let us import from Synchro!
- more work on the new road editor, but still not ready. lane widths are now more varied and realistic.
- Trevor overhauled the OSM amenity categories and added a multi-source isochrone to the 15m tool to find places without access to some amenity
- partial work running the map importer in a Docker container, to eventually speed up the import process in the cloud
- signal editor UI adjustments
- time warp UI fixes and a new risk exposure contingency matrix by Michael
- internal code cleanup using clippy, by Vinzent
0.2.44
- experimental road editor finally released! more improvements still planned
- save/restore settings (like camera angle and units) between sessions
- Michael improved performance of scrolling panels
- Michael adding more dataviz to travel time and risk exposure dashboards
- regenerating all maps now happens on the cloud -- faster and less harmful to my poor laptop
- exploring some debug tools and strategies for consolidating intersections
0.2.45
- map importing fixes: multiple left/right turn lanes, combo bus/turn lanes, tidy up degenerate intersections along cyclepaths, allow explicitly tagged U-turns, better stop sign placement heuristics
- in Seattle, snap trips entering/leaving map through borders more carefully
- prebake data to cover trips starting near midnight. down from about 3000 cancelled trips in montlake to 300
- road editor UI: explain disabled actions
- Michael added new "arterial crossing" risk for pedestrians
- improved GMNS signal timing importer
0.2.46
- lots of internal writing, presentations... not quite ready for an audience yet
- fixed weird turn lane arrows
- GMNS signal import now works for many intersections, thanks to crosswalk inference
- road editor UI fixes
- speed up starting a simulation with infinite parking
- possible breakthrough with intersection consolidation
0.2.47
- simulation speedup by storing turns better
- new website/docs maybe halfway done
- sped up rust build process
- improved some geometry around Tempe
- fix broken screenshot diff test
- trevor added the "cloud of uncertainty" in the 15m tool to show borders
0.2.48
- vehicles will now dynamically change lanes to pass slower traffic! in limited cases only.
- vehicles can now exit a building's driveway and immediately cut across a few lanes
- new UI tool to easily find when trips start
- fix some crashes related to widening roads
0.2.49
- vehicles can exit driveways in either direction!
- bugfixes with lane-changing, time-warping, settings, nondeterministic z-ordering, changing speed limits
- speed up edit mode on large maps
- loading maps on native now sees locally imported maps
- smaller files across the board by serializing f64s as integers
- map data quality: greenlake cycletrack, better stop sign placement, crosswalks at consolidated intersections
- risk exposure matrix labels
- keep cars out of bus lanes with better costing
0.2.50
- UI: improve elevation profiles, add road editor revert button, thought bubbles for people climbing steep inclines
- fixed signal timing for 3-ways
- fixed a race condition with two vehicles going for the same offstreet parking
- fixing pedestrian speeds on inclines
- improved relative positons of adjacent lanes on curvy roads
- internal speedups for map importing and a tool to compare two maps, for intersection consolidation
- let lane-changing happen in more cases (when vehicle1 wants to pass vehicle2, but can't until a few lanes later)
- add a mode to import a region-wide map without local roads
- internal pathfinding refactor to switch between contraction hierarchies & Dijkstra more flexibly, reduce duplicate higher-level input graph logic
0.2.51
- special mid-week release to support a blog post
- using infinite parking for the arboretum scenario
- add y axis to trip time dashboard
- faster OSM import using overpass
- internal tools for working on intersection consolidation and cyclepath snapping
0.2.52
- started a mode shift dashboard
- individual trips can be explored from the risk exposure dashboards now
- fixed actdev scenarios
- web file loaders now show progress
- performance improvements for editing roads
- various bug fixes
0.2.53
- new intersection consolidation algorithm, applied around Seattle and Tempe with really great results!
- Seattle fixes: deduplicating cycletracks, connecting Arboretum bike paths
- add new lane types to express buffers for protected bike lanes
- better neighborhood shapes by Michael, in the commuter patterns layer
- fixed Overpass imports, which were missing border intersections
0.2.54
- brand new day mode color scheme!
- road editor automatically adjusts lane width, and other small UI fixes
- show bike network gaps in the mode shift dashboard
- progress on snapping cyclepaths, representing buffers, fixing up nearby geometry
- fixed crosswalks for consolidated intersections on left-handed maps
0.2.55
- more progress on cycleway snapping, but still not ready
- road editor sets new lane width better
- load proposals picks a better order
- a new experiment unfolding...
0.2.56
- releasing a new tool dedicated to planning bike networks!
- massive overhaul to the road editor, including lane cards that can be both dragged AND dropped
- new road labeling in unzoomed mode
- new tool to quickly sketch roads to edit
- new tool to plan routes and see elevation/road types along the way
- load previously saved proposals on web
- disabled prototype: uploading proposals to a central server for easier sharing
0.2.57
- bike network tool UI fixes, especially for the routing tool
- use drag and drop for traffic signal editor and route waypoints
- small internal map model performance boost
- heavy documentation week
0.2.58
- dramatically improve time to recalculate pathfinding
- deploy raw map editor to web, to support a long-form article: https://a-b-street.github.io/docs/tech/map/geometry/index.html
- long-form article about the simulation: https://a-b-street.github.io/docs/tech/trafficsim/discrete_event/index.html
- small fixes to ungap route tool
0.2.59
- bike network's route tool: naming saved routes, showing details about the route
- switch from s3 to cloudfront CDN; all downloads should be faster
- further pathfinding performance improvements
- fix bike quick sketch tool in left-handed maps
- consolidate tools into a single CLI and include it in the release
0.2.60
- incorporated a configurable mode shift and carbon emissions model with the bike network tool
- partially implemented Mara's UX changes to the bike tool
- improved UI map importing: no more overwriting, and naming new maps
- prototyped a new low-traffic neighborhood / rat-run tool
0.2.61
- bike network tool now shows alternate routes
- small fixes to mode shift and LTN tool
- major internal UI refactors started
0.2.62
- ungap the map bike network tool launched! bike.abstreet.org has documentation and videos
- uploading and sharing proposals now works!
- super speedup to applying map edits
0.2.63
- ungap: consolidate editing controls
- workaround some bugs loading map edits
- ungap: add ability to compare a trip before/after some proposed changes
- ungap: make the high-stress metric handle one side of a road missing bike lanes
- ungap route sketcher easier to use when zoomed far out
- ui fixes: units in barrier type, dropdowns focus-fighting with drag-drop cards
- perf: smaller city overview maps
0.2.64
- new algorithms to find and render city block and neighborhoods. almost ready for use in main applications
- fixed the worst of curb rendering bugs
- new mapbox gl + abstreet demo
- adding command-line --help to most programs
0.2.65
- rewrote the low-traffic neighborhood prototype. neighborhood detection much better, internal streets grouped into traffic cells, two rendering styles for cells. browsing rat runs not ready yet, disabled
- new shared title screen, to switch easily between all A/B Street apps
0.3.0 (major release)
See https://a-b-street.github.io/docs/project/history/retrospective/index.html for a look back on the project so far. I started https://github.com/sponsors/dabreegster to fundraise for a full-time Rust developer.
- added basic routing to LTN tool
- roads with modal filters belong to two traffic cells
- progress on LTN rat run detection, but still not ready
- new option to use OSM crossing nodes to model unmarked foot crossings
- better road label placement
0.3.1
- no right turn at red lights, in most of the world. thanks Marcel!
- simplify map importing config
- some fixes to OSM crosswalk matching
- placing LTN modal filters more intuitively
- change level of traffic assumptions in LTN pathfinder. thanks Andrew!
- diagonal modal filters for LTNs
0.3.2
- render one-way markings as outlines by Marcel
- few fixes, mostly just importing some new places
- the project lead has moved to London ;)
0.3.3
- bus routes now imported for Seattle and SF, from GTFS
- fix "bowtie" intersection shapes, resulting from incorrect clockwise ordering
- few small OSM data fixes for London and Leeds
- fix crash when customizing a route in Ungap the Map
0.3.4
- draw custom boundaries for LTNs (but can't yet save the boundaries)
- rendering modal filters better when zoomed in
- v3 of a rat-run detector, and showing a heatmap of quiet/busy streets
0.3.5
- improved LTN rat-run detection
- LTN UI overhaul, expressing 3 modes for per-neighborhood analysis, all of which can edit modal filters
- LTN drawing fixes -- including the 4-color theorem to make sure adjacent areas appear distinct
- LTN tool now understands roads that're already tagged as car-free in OSM
- LTN tool can adjust boundaries a bit more precisely, but this still half-broken
- Marcel overhauled walking turns, letting them be bidirectional and switching to a simpler implementation of crosswalk generation
- Marcel improved the geometry of all turns
- fix downloading maps in the Windows version
0.3.6
- bugfixes for partitioning space into blocks, which helps the LTN tool
0.3.7
- experimenting with a few heuristics for automatically placing modal filters
- improved rendering in the "browse neighborhoods" screen: show all filters, emphasize boundary roads, optionally show cell connectivity, and optionally show how "good" the neighborhood is
- draw disconnected cells more loudly
- fix bug introduced recently that broke listing files (especially newly imported maps)
- add an "undo" button for the LTN tool
- export all LTN data to GeoJSON -- the cell polygons are slow to produce, and buggy, though
- start ranking neighborhoods by how many streets with through-traffic exist
- make the "adjust boundary" UI mostly work now -- individual blocks are transferred between neighborhoods properly in most cases
0.3.8
- sped up initial loading of the LTN tool on web by splitting it from the main A/B Street binary
- LTN UX: preserve dropdown settings and saved routes
- draw LTN cells as proper polygons, always clipped to the neighborhood boundary (instead of a grid)
- support LTN GeoJSON export in web
- prototyped an impact prediction for LTN schemes by comparing per-road volumes using a demand model. Not working yet.
0.3.9
- LTN boundary selection can now split neighborhoods in most ways
- allow UK scenarios to be generated with one-shot imports
- fix pedestrian rendering crash that happened in some maps
- fix how cycle-and-foot-only roads are drawn unzoomed
- make LTN impact prediction tool stop running out of video memory
- internal refactoring to separate Scenario stuff from rest of simulation code
0.3.10
- save/load LTN proposals as local files only
- improve LTN block tracing near railroads and bridges/tunnels, fixing many overlapping areas
- LTN UI: draw cell & neighborhood areas beneath roads, add road name search tool everywhere
- make modal filters visible even at very low zoom levels
- extend the quietness view and automatic filter heuristics to the entire map
- improve the travel demand model for UK data by handling desire lines starting/ending off-map
0.3.11
- detect existing modal filters in OSM
- import Melbourne and most London boroughs
- simplify road center-lines after merging roads
- improve my workflow for regenerating all maps locally in parallel
- save LTN proposals in web browsers to local storage
- some small LTN UI fixes
0.3.12
- fix various crashes relating to geometry and edits near public transit
- internal refactoring to make the map_editor debugging tool build much faster
- improved geometry near dog-leg intersections in some maps
0.3.13
- swap between multiple LTN proposals easily
- LTN boundary selection is now faster, has simpler colors, has a freehand lasso tool, and includes blocks near roads without sidewalks
- quickly create multiple modal filters by freehand drawing
- core geometry fixes: remedy some lane center lines that explode at sharp angles
- upgrade window management dependencies; if you experience new problems, please report
0.3.14
- overhaul the rat-run mode: tighten up things counting as shortcuts, keep the same path after adding a filter
- change the LTN route planning tool to be map-wide, not per-neighborhood
- place filters at non 4-way intersections
- shrink some cases of overlapping roads, improving geometry when OSM data is not great
- a first round of simplifying LTN panels
- when the LTN blockfinding would've crashed previously, just fallback to using more expensive blockfinding
- bugfix: detect existing filters on really short roads
- fix initial camera placement outside of the main A/B Street app
0.3.15
- re-import the current map from fresh OSM data (native only)
- adjust LTN panels
0.3.16
- show rat-runs on the connectivity tab; understand both detours and cells as you place filters
- merge blocks with different winding orders
- better behavior when switching proposals on the rat-run tab
- new automatic filter heuristic inspired by min cut
- adjust LTN color scheme, de-emphasizing buildings
- simplify LTN UI, hiding advanced controls
0.3.17
- show biking and walking directions too in the LTN tool
- add help and info buttons to the LTN tool
- show area of neighborhoods
0.3.18
- fix major bug where pathfinding after map edits was broken
- make the LTN impact tool show results more reasonably
0.3.19
- breaking change: saved LTN proposals have a new format. Please contact me if you need to fix any previously saved files.
- starting to revive public transit support a bit, simplifying how many times pathfinding happens
- adjust LTN filter drawing style and allow toggling filters on "degenerate" intersections
- fix a rare simulation crash involving a vehicle exiting driveways off-side
- slow down pedestrians walking on crowded sidewalks, and track where this problem happens
- thanks to Michael, Mac binaries are now signed!
0.3.20
- you can now edit crosswalks!
- more realistic behavior of pedestrians at stop signs -- they won't endlessly swarm and cut off vehicles
- show a popup when the web browser version crashes
- change metric/imperial settings automatically based on the map loaded
- update Seattle OSM data (first time in over 6 months)
0.3.21
- new UI tools to explore risk exposure and problems: click a person's problem to time-warp and watch it, show A/B test of problems per road/intersection, time-series of problems per road/intersection
- fix various crashes
0.3.22
- revive an internal A/B test mode to keep simulations between two similar maps in sync
- new layer for pedestrian density
- improve the SMP scenario
- ltn: one-way border arrows, freehand filter tool can be used from either editing mode,
- simplify LTN cells around non-driveable roads
- introduce a Bristol consultation mode for the LTN tool
- export problem list to CSV, and make all CSV/GeoJSON exports work on the web too
0.3.23
- small LTN fixes: don't filter one-way roads or mess up undo with the freehand tool, highlight the boundary road
- LTN style changes: traffic signals, don't show stop signs or crosswalks, get the center line color correct in the UK
- create a second Bristol LTN consultation mode, with a special overriden boundary
- initial support for modifying one-way streets in the LTN tool (with many limitations)
0.3.24
- improve the LTN route planner UI
0.3.25
- improvements for road labels in the LTN tool
- explain errors to the user better in the LTN tool
- prevent more illegal combinations of filters, one-ways, and dead-ends
- improved UX after downloading a new map natively
- fix some missing U-turns
- temporarily disabled code-signing for Mac binaries
0.3.26
- major LTN color redesign
- fix LTN modal filters that were pre-existing in OSM data
- fix missing schools and other OSM amenities
- bad elevation data disabled in most maps (it never worked outside of Seattle)
- internal refactor to extract osm2streets code to another repo, allowing faster iteration and some upcoming related projects
- re-enable Mac binary code-signing
0.3.27
- rearrange LTN tool controls -- you can now view shortcuts by road
- bug fixes and perf fixes for scrolling and drawing road labels
0.3.28
- LTN design overhaul: remove the zoomed view, simpler road labels, multiple modal filter types
- overhaul the LTN impact prediction tool: make it work on all maps, improve how before/after paths drawn, fix major bug with paths changing spuriously, add CSV export
- transform a simple case of dual carriageways into a single road with a divider lane
- workaround broken LTN partitioning in some maps
- fix color scheme when drawing LTN cells as areas
- show an icon for schools in the LTN tool
0.3.29
- another LTN color scheme update
- some LTN bugfixes
0.3.30
- fix some major crashes with the LTN tool
0.3.31
Note the Linux build now uses Ubuntu 22.04, not 18.04, and thus requires a new glibc to work
- initial support for uploading and sharing LTN proposals!!!
- changes to one-ways / road direction are now saved in the LTN tool and work with undo
- deal with "holes" in the middle of blocks when adjusting LTN boundaries
- add zoom buttons and a collapsible legend to the LTN tool
- import missing London boroughs
- start internally switching to a better representation of tessellations that aren't simple polygons. Thanks Michael!
0.3.32
- trying to filter a one-way road will now prompt you to change it
- fix LTN shortcut calculation: make them stay inside the neighbourhood and handle access=private roads
- add optional bus route layer in the LTN tool
- draw new / existing modal filters differently
- fix important bug causing some routes to make illegal turns
- fix a few OSM import crashes
0.3.33
- overhaul LTN navigation between modes
- much nicer road labels in the LTN tool
- prompt the user to add a bus gate on appropriate roads
- huge internal refactor of Polygons complete. thanks to Michael for help!
- slightly improve LTN route tool, partly by hiding extra controls by default
- improve LTN colors for parks and water
0.3.34
- massive LTN UI overhaul based on Madison's designs
- start importing footways and shared-use paths from OSM
- change text scale factor in the LTN tool without restarting
- many small ltn UX fixes
0.3.35
- fix missing shortcuts in the LTN tool, involving corners where a main road changes name
- start improving how saving LTN proposals works, for quickly comparing alternatives
- use real photos to explain the modal filter types
- fix a few reported crashes
- substantially speed up map importing for certain areas with lots of amenities
- fix an edge case with point closures defined at intersections
0.3.36
- start a mode in the LTN tool showing and editing crossings and porosity
- draw one-way arrows in the LTN tool less horribly (in narrow roads or with labels)
- internally simplify OSM import process, by relying on osmium
- speed up OSM XML parsing and reduce memory overhead
0.3.37
- left/right driving side is now determined automatically when importing maps
- LTN route tool can now start/end at roads, not just buildings
- LTN tool doesn't constantly warn about bus gates and one-way roads
- fix a few crashes in the LTN tool and performance of boundary selection
- add elevation data for all of the UK, thanks to Malcolm
- fix bus lane placement in left-sided maps
0.3.38
- upgrade osm2streets, with various geometry fixes
- shrink LTN build times a bit
- fix LTN bug where with crazy route times involving private roads
- fix Santa in downloaded version, before data is downloaded
- clean up the 15m tool's UI and mark footways as walkable
- speed up polygon editing tool and add a "leafblower" mode
- start experimenting with "custom boundary" areas in the LTN tool
0.3.39
- warn about problematic LTN boundaries
- add a school street filter
- add a 20mph LTN tool
0.3.40
- new LTN tool to show driving impact from everywhere within a neighbourhood
- update most external dependencies (hopefully without introducing any new platform-specific problems)
- update osm2streets, with new default lane widths
- hopefully fix some geometry-related crashes
- update all OSM data for all maps, and always include the full area
- cosmetic improvement to unzoomed road outline styling
0.3.41
- major fixes to LTN blockfinding, letting boundaries be edited more frequently and default boundaries look more reasonable
- osm2streets geometry fixes and new OSM data for GB maps
- show main roads vs neighbourhood perimeters in LTN tool
- help the user figure out what blocks to add first in the LTN tool boundary adjustment
0.3.42
- ltn tool now treats main roads better, and handles neighbourhoods with perimeters only partly on main roads
- ltn tool has a new cycle network tool, showing how quiet streets augment cycle lanes
- ltn bugfix: roads starting with a filter now behave correctly
- ltn routing: overlapping paths now start and end precisely at a building driveway
- major speedups to LTN tool initial load time and shortcut calculation, and map importing
- adjusting ltn boundaries is now a bit smoother when there are intermediate blocks
- 15m tool overhauled. score homes tool is no longer all-or-nothing
0.3.43
- add vehicle ownership census stats to the LTN tool for England
- show Underground and National Rail stops in the LTN tool
- only download one map at a time, to deal with huge cities like London or Seattle
- misc bugfixes and performance improvements
0.3.44
NOTE! All prior savefiles in all apps won't load; the format has changed in an incompatible way. There will be more incompatible changes for the next few releases.
- fix 15m tool crash on maps with shared paths and sidewalks
- fix bug where alt+tab counts as tab keypress (thanks Abdul!)
- use HTTPS for all downloads
- let file pickers work on the web too
- let the LTN tool save and load proposals from regular files
- improve .zip binary releases, making all apps capture error logs
- disable broken tutorial mode (but thanks to Antelope for starting to fix it)
- internally change LTN tool to use regular map edits. some behavioral regressions with undo, but improvements with handling existing modal filters
0.3.45
- show turn restrictions in the LTN tool (thanks Andy!)
- show main road labels when adjusting LTN boundaries
- import a few places and manually fix LTN boundary issues
0.3.46
NOTE this was first released 14 August broken, then re-released 30 August fixed
- fix some map importing problems
- regenerate all maps, fixing a previous attempt at this
- import a few new places
0.3.47
- edit turn restrictions in the LTN tool (thanks to Andy!)
- remove old procedurally generated buildings from some UK maps
- fix Santa crashes (thanks to Stuart!)
0.3.48
- few bugfixes and new areas
- try to fix Windows launcher scripts
0.3.49
- Many new imports
- Improved turn restriction icon placement in the LTN tool (thanks Andy!)
- Speed up the main import process
- Use new GeoTIFF elevation importer
Users
This page lists people/groups using some part of A/B Street who publicly share their work. I've likely forgotten many examples, please add if so!
Public consultation
- Bristol City Council used the LTN tool for a liveable neighbourhood consultation ending in October 2022
Academic
- A bachelor thesis importing (manually fixed) GTFS data for Geneva and simulating buses: pdf (in French), published July 2022 by Ilias N’Hairi and Thomas Dagier
- Forecasting Counterfactuals in Uncontrolled Settings, about human predictions regarding traffic simulations
- An undergraduate course at Arizona State University taught by Xuesong Zhou used A/B Street
- A master's dissertation looked at simulating a motor-free area in downtown Pune, a city in India using the LTN tool relying solely on OSM data. August 2022 by Varad Deshmukh, OSF preprint
References
Example use cases
- https://www.reddit.com/r/SeattleWA/comments/9mtgkh/seven_places_to_add_bus_lanes_now/
- https://www.reddit.com/r/SeattleWA/comments/9oqkz9/how_traffic_patterns_will_change_after_seattles/
- https://www.reddit.com/r/Seattle/comments/9orqne/4_fresh_ideas_to_ease_seattles_coming_traffic/
- https://www.reddit.com/r/SeattleWA/comments/cr1r1l/why_the_fuck_does_the_right_lane_convert_to/
- https://twitter.com/transitrunner/status/1175068582142599168
Groups that may be eventually interested
- Seattle Times Traffic Lab
- https://www.citylab.com/transportation/2018/08/is-it-time-to-rethink-what-a-bike-lane-is/568483/
- http://openseattle.org/
- https://igniteseattle.com/
- http://seattlegreenways.org/
- https://www.livablecities.org/
- https://www.reddit.com/r/openstreetmap/comments/a39uv0/ok_so/
- https://mic.comotion.uw.edu/
- https://www.seattleinprogress.com/
- http://www.seattle.gov/seattle-pedestrian-advisory-board
- Socrata
- http://transportationcamp.org/
- https://www.seattle.gov/transportation/projects-and-programs/programs/neighborhood-street-fund
- https://www.seattle.gov/neighborhoods/programs-and-services/your-voice-your-choice
- https://commuteseattle.com/
- https://www.theurbanist.org/
- https://humantransit.org/2019/03/notes-on-simcity-at-30.html
- https://mynorthwest.com/category/chokepoints/
- https://blogs.uw.edu/ceadvice/2019/05/08/infrastructure-week-2019-welcome-uw-cee-students-and-faculty/
- https://escience.washington.edu/dssg/
- josie kresner from transport foundry
- https://www.citylab.com/transportation/2019/08/city-planning-transportation-oakland-community-engagement/596050/
- tweeting small problems -> bug tracker
- https://www.the74million.org/article/building-a-smarter-and-cheaper-school-bus-system-how-a-boston-mit-partnership-led-to-new-routes-that-are-20-more-efficient-use-400-fewer-buses-save-5-million/
- https://www.citylab.com/perspective/2019/10/micromobility-urban-design-car-free-infrastruture-futurama/600163/
- https://www.sanjorn.com/
- https://ui.kpf.com/
Similar projects
- Urban Footprint (https://news.ycombinator.com/item?id=17895739)
Seattle-specific
SDOT asking for feedback:
- http://sdotblog.seattle.gov/2017/02/08/from-signals-to-signs/
- https://www.seattle.gov/transportation/projects-and-programs/programs/bike-program/protected-bike-lanes/n-34th-st-mobility-improvements
- https://www.seattle.gov/transportation/projects-and-programs/programs/transportation-planning/north-downtown-mobility-action-plan
- https://www.seattlebikeblog.com/2016/12/01/check-out-seattles-12-winning-neighborhood-led-transportation-ideas/
Seattlites with opinions and ideas:
-
https://www.reddit.com/r/SeattleWA/comments/5rvss5/what_changes_would_you_make_to_seattles_bus/
-
https://www.reddit.com/r/SeattleWA/comments/86g3p9/id_get_back_an_hour_and_a_half_a_week/
-
https://www.reddit.com/r/Seattle/comments/4z3ewl/what_are_seattles_worst_intersections/
-
http://www.seattle.gov/transportation/sdot-document-library/citywide-plans/move-seattle
Other projects
- https://github.com/uwescience/TrafficCruising-DSSG2017
- http://sharedstreets.io/
- https://github.com/twpol/osm-tiles attempting to infer nice road geometry too
Notes from related work
SMARTS (https://people.eng.unimelb.edu.au/etanin/tist17.pdf)
- Split map into sections, simulate in parallel, load-balance
- has an IDM equation
- tests against real TomTom data of average speed per link
Games
SimCity, Cities: Skylines https://steamcommunity.com/sharedfiles/filedetails/?id=583429740 https://github.com/fegennari/3DWorld
Open source urban planning
UrbanSim
Proprietary
Sidewalk Labs Model
Maps for people
https://arxiv.org/pdf/1811.01147.pdf
gamma.cs.unc.edu/RoadNetwork/wilkie_TVCG.pdf
section 6.3 talks about offset polylines http://gamma.cs.unc.edu/RoadNetwork
CityBound
https://github.com/aeickhoff/descartes
Discrete Event Simulation papers
-
section 5.1 of Advanced tutorial on microscopic discrete-event traffic simulation refers to some DES systems
- Florian, Mahut, and Tremblay 2008
- Sumaryo, Halim, and Ramli 2013
- Salimifard and Ansari 2013
- Burghout, Koutsopoulos, and Andreasson 2006
- Thulasidasan, Kasiviswanathan, Eidenbenz, Galli, Mniszewski, and Romero 2009
-
A Dynamic Traffic Assignment Model for Highly Congested Urban Networks
- section 2.2 models lanes as a moving and queueing part, references other possibly useful papers
- dont worry about multiple lanes for the moving part, just the turn queues at the end
Tactical urbanism
Presentations
Some presentations are not strictly about A/B Street, but related projects in the same ecosystem.
2024
- December 2024: Open source tools for transport planning at Active Travel Cafe: video, slides
2023
- January 2023: Open source and participatory transportation planning for DERI seminar
- January 2023: Building Multimodal Network Models for Every City using OpenStreetMap: Challenges and Opportunities for TRB workshop
2022
- December 2022: Transportation planning for the general public
- December 2022: LTN EDIF slides for DfT Data Advisory Board
- November 2022: A transportation planning platform for collaboration between government and the public for CSAP Seminar
- November 2022: A/B Street overview for TfL
- November 2022: An active travel infrastructure co-design tool for Walking & Cycling Innovations
- October 2022: Presentation for TWCAE CSO Forum
- September 2022: Redesigning roads to promote more cycling in Taiwan
- [September 2022]: A/B Street project overview
- [September 2022]: A/B Street LTN tool user guide
- August 2022: State of the Map on osm2streets: slides, video
- July 2022: Bus Spotting project status (For a side project on GTFS and matching bus data)
- July 2022: osm2streets talk for AI for Science & Government
- June 2022: Ungap the Map - collaborative cycle network planning for UA 2.0 Exeter
- June 2022: Modelling World open source session intro
- June 2022: Modelling World “no model” session
- March 2022: 2022 PHIT A/B Street experience sharing
- March 2022: Census data tool proposal
- March 2022: AI:UK workshop on low-traffic neighborhoods
- March 2022: The abridged and entirely truthful story of A/B Street (Geomob)
- March 2022: FOSSGIS session on better geometric representation in OSM
- March 2022: FOSSGIS session on osm2lanes
- March 2022: Leeds Transport Data Science seminar on travel demand modeling
- February 2022: OpenTransportMeetup slides
- January 2022: Geomob podcast
- January 2022: An open source transportation planning platform (for the U-Shift lab)
2021
- December 2021: Lightning talk at ATI's Towards Urban Analytics 2.0
- December 2021: A/B Street in the UK
- November 2021: Ideas with Beers
- October 2021: Taiwan presidential hackathon
- October 2021: FOSS4G
- September 2021: SUMO user conference
- August 2021: Actdev promo video
- July 2021: State of the Map 2021, Using OSM for transportation advocacy
- June 2021: Smart Planning, Digital Twins, & Open Data
- Slides, Video
- Talk given for Arizona State University TOMNET
- May 2021: Open:Data:Night for Open Manchester
- April 2021: FSUTMS talk
- March 2021 ActDev workshop
- February 2021: Transport Data Science guest lecture
- January 2021: TRB Network Models in Practice
2020
- October 2020: OSM Connect 2020
- July 2020: Silicon Valley Bike Coalition summit
- April 2020 Seattle Rust meetup
- Feb 2020 traffic sim